
Abstract
Background
The pathological damage mechanism of type 2 diabetes (T2D) and macroangiopathy is extremely complex, and T2D and arteriosclerosis obliterans have different biological behaviors and clinical features. To explore the mechanism of lower extremity arteriosclerosis occlusion (LEAOD) in T2D patients, we utilized RNA-seq to identify unique gene expression signatures of T2D and LEAOD through transcriptomic analysis.
Methods
We obtained blood samples and performed RNA sequencing from four patients with T2D, five of whom had LEAOD. Another six age- and gender-matched blood samples from healthy volunteers were used for control. By exploring the general and specific differential expression analysis after transcriptome sequencing, specific gene expression patterns of T2D and LEAOD were verified.
Results
Transcriptome analysis found differentially expressed genes in T2D, and T2D + LEAOD (vs normal) separately, of which 35/486 (T2D/T2D + LEAOD) were up-regulated and 1290/2970 (T2D/T2D + LEAOD) were down-regulated. A strong overlap of 571 genes across T2D, LEAOD, and coexisting conditions was mainly involved in extracellular exosomes and the transcription process. By exploring the sex difference gene expression features between T2D, T2D + LEAOD, and healthy controls, we noticed that sex chromosome-associated genes do not participate in the sexual dimorphism gene expression profiles of T2D and LEAOD. Protein–Protein Interaction Network analysis and drug target prediction provided the drug candidates to treat T2D and LEAOD.
Conclusion
This study provides some evidence at the transcript level to uncover the association of T2D with LEAOD. The screened hub genes and predicted target drugs may be therapeutic targets.
Introduction
Diabetes mellitus is a disorder in which the pancreas cannot make enough insulin or respond normally to blood sugar (glucose), causing high blood sugar (hyperglycemia), and finally resulting in health problems, such as heart disease, nerve damage, and eye issues.Citation1 Type 2 diabetes (T2D) is the most common type of diabetes, representing 90% to 95% of all diabetes cases, and is characterized by elevated blood sugar caused by insulin secretion defect or insulin utilization disorder.Citation2,Citation3 It is estimated that the number of diabetic patients worldwide will rise to 454 million by 2030 and 548 million by 2045.Citation4,Citation5 T2D can cause a variety of complications, of which diabetic vascular disease is the most common. Diabetic vascular disease includes macrovascular disease and microvascular disease. Diabetic macrovascular disease refers to atherosclerosis of the aorta, coronary arteries, and peripheral arteries of the limbs. T2DM can cause microvascular and peripheral vascular lesions, leading to lower extremity atherosclerotic occlusive disease (LEASOD), limb ischemia and intermittent claudication, and even lower extremity ulcer, gangrene, or amputation in severe cases.Citation6 LEASOD is one of the most common peripheral arteriosclerosis occlusive diseases in current society, and it is an important part of systemic arteriosclerosis disease. Its pathological changes are a group of chronic ischemic diseases that cause arterial stenosis or occlusion, such as thickening of arterial intima, calcification, and secondary thrombosis.Citation7,Citation8 The incidence of LEASOD is increasing year by year, and 70–80% of patients have no clinical symptoms. Some early manifestations, such as fatigue after exercise and soreness of the lower limbs, are often mistaken by people as a presentation of old age and/or fatigue. Some patients are insensitive to pain due to neuropathy caused by diabetes, and most patients have intermittent claudication, resting pain, ischemic gangrene, and other symptoms when it is difficult to treat, thus, seriously affecting the physical and mental health and quality of life of patients.Citation9,Citation10 It is assumed that there is an intricate interplay between T2D and LEAOD. The genes involved in insulin resistance, dysregulation lipid metabolism, and coagulation processes may contribute to the biological responses of the arterial wall.Citation11,Citation12 However, the pathological mechanism of diabetic macroangiopathy is extremely complex, and the etiology and underlying mechanisms are still unclear. There are still limited molecular targets or biomarkers that could be applied in the clinical and improve the individual treatment of T2D and LEAOD.
Human peripheral blood mononuclear cells (PBMCs) undergo both cell-intrinsic and cell-compositional changes with disease. PBMCs expression atlas has been used to reflect pathological conditions in a variety of diseases.Citation13–17 The available bioinformatics analysis tools and systems biology have provided an opportunity to better understand the complex biological processes of diseases and revealed some potential pathogenic targets for disease occurrence and development.Citation18 Recent studies have also reported biomarkers for early disease occurrence, for the effective control of diabetic blood vessels.Citation19–21
Apart from morphological differences, there are sex differences in the prevalence and incidence of T2D, and individuals with T2D also exhibit sex and gender differences in the burden of future cancer, dementia, and renal and cardiovascular diseases.Citation22,Citation23 Large-scale global observational studies have suggested a slightly higher prevalence of type 2 diabetes among men than women.Citation24,Citation25 In another Chinese population, the age-standardized prevalence of T2D was 16.1% in men compared with 14.9% in women.Citation26 However, no sex differences were observed in the US population. The mechanisms that have been proposed to influence these sex differences in T2D and LEAOD are limited. They include epigenetic risk factors, insulin resistance, lifestyle, and span.
In recent years, with the development of medicine and bioinformatics, gene expression information has been providing large-scale research on the diagnosis and treatment targets of diabetic macroangiopathy. However, the available data through bioinformatics analysis and systems biology are far from clarifying T2D and LEAOD, or explanation of different therapy strategies for patients with T2D and (or) LEAOD. Thus, it is important to decipher the comprehensive molecular characteristics of T2D and LEAOD to improve the individualized management of patients. Therefore, to support a hypothesis of an intrinsic interplay between LEAOD and T2D patients, we compared the peripheral blood gene expression profiles through transcriptomic analysis to better understand the association of these disorders.
Materials and Methods
Ethical Statement
The authors are accountable for all aspects of the work in ensuring that questions related to the accuracy or integrity of any part of the work are appropriately investigated and resolved. The study was conducted in accordance with the Declaration of Helsinki (Seventh revision (2013)). All patient samples were collected in adherence to local regulations and after obtaining institutional review board approved informed consent. The study was approved by the Ethics Committee of the Putuo Hospital Shanghai University of Traditional Chinese Medicine (No. PTEC-R-2021-13-1) and informed consent was obtained from all patients. The research complies with all relevant ethical principles.
Patient
Study participants of the study were screened as patients who were admitted to our hospital for type 2 diabetes between May 2020 and March 2021. We selected the population with lower extremity arteriosclerosis occlusion (LEAOD) diagnosed by color Doppler ultrasound as the research group (T2D + LEAOD group, n = 5). Patients without lower extremity arteriosclerosis and occlusion were selected as T2D group. The diagnosis of T2D was in accordance with World Health Organization criteria.Citation27 The age and race-matched patients attending the outpatient department were recruited as control during the study period in our hospital (n = 6). The inclusion criteria were as follows: Patients met the diagnostic guidelines for T2DM and lower extremity arteriosclerosis obliterans; Patients had a medical history of T2DM with symptoms such as limb pain, intermittent claudication or ischemic ulcer, and gangrene in the lower limbs, and LEASOD was confirmed through color Doppler ultrasound, CT angiography, and other imageological tests to detect the corresponding artery stenosis or occlusion, and all patients should have complete clinical data.Citation6 The exclusion criteria were included patients who had acute complications of T2DM, patients with hemorrhagic diseases or disorders of the coagulation system, patients with cerebrovascular diseases, patients with severe cardiopulmonary liver and kidney failure, patients with infectious or autoimmune diseases, fever or infection, current smokers, vaccination within 3 months, history of prior organ transplantation, steroid use, estrogen replacement, AIDS, on chronic anti-inflammatory use, chemotherapy within the prior year, acquired Immune Deficiency Syndrome or immunocompromised, hemochromatosis, diagnosed with cancers, or neurodegenerative disease.Citation6 The average age of these patients was 50.25 ± 6.16, with the majority being between 45 and 55 years old (age ranged from 41 to 59). Demographic data and medication of the study population are summarized in .
Table 1 General Information for Patients
Sample Collection
Blood samples from patients were collected within 3–4 days of hospital admission. Briefly, the blood sample (5 mL) was obtained by venipuncture or from an existing line cleared of IV solution (venipuncture, arterial, or venous recorded) in 6-mL K2 EDTA Vacutainer tubes. Peripheral blood mononuclear cells (PBMCs) were isolated from ethylene diamine tetraacetic acid (EDTA) anticoagulated whole blood using Ficoll-Hypaque gradients. Briefly, blood cells were removed by centrifugation (4°C, 800 × g for 10 min), and the platelet-poor plasma collected after another centrifugation (4°C, 10,000 × g for 10 min) and stored at −80°C until all samples were ready for analysis. All assessments were performed blinded to the subject’s history. All assessments were performed blinded to the subject’s history of T2D and (or) LEAOD.
RNA Extraction
Total RNA from PBMCs was extracted from the tissue using TRIzol® Reagent according to the manufacturer’s instructions (Invitrogen, Carlsbad, CA, USA). Then, genomic DNA was removed using DNase I (TaKara). The quality and quantity of RNA were evaluated by 2100 Bioanalyser (Agilent) and quantified using the ND-2000 (Thermo Scientific, Wilmington, DE, USA). Isolation of messenger RNA (mRNA) was carried out using a TruSeq RNA library preparation kit (Illumina, San Diego, CA) according to the manufacturer’s instructions. Only high-quality RNA sample (OD260/280 = 1.8–2.2, OD260/230 ≥ 2.0, RIN ≥ 6.5, 28S:18S ≥ 1.0, >1 μg) was used for sequencing library construction.
Library Construction and Illumina HiSeq Xten/Nova Seq 6000 Sequencing
RNA-seq transcriptome library was prepared following TruSeqTM RNA sample preparation kit from Illumina (San Diego, CA) using 1μg of total RNA. Shortly, messenger RNA was isolated according to polyA selection method by oligo(dT) beads and then fragmented by fragmentation buffer first. Second, double-stranded cDNA was synthesized using a SuperScript double-stranded cDNA synthesis kit (Invitrogen, CA) with random hexamer primers (Illumina). Then, the synthesized cDNA was subjected to end-repair, phosphorylation, and “A” base addition according to Illumina’s library construction protocol. Libraries were size selected for cDNA target fragments of 300 bp on 2% Low Range Ultra Agarose followed by PCR amplified using Phusion DNA polymerase (NEB) for 15 PCR cycles. After being quantified by TBS380, paired-end RNA-seq sequencing library was sequenced with the Illumina HiSeq Xten/NovaSeq 6000 sequencer (2 × 150 bp read length).
Read Mapping
The raw paired end reads were trimmed, and quality controlled by SeqPrep (https://github.com/jstjohn/SeqPrep) and Sickle (https://github.com/najoshi/sickle) with default parameters. Then clean reads were separately aligned to reference genome with orientation mode using HISAT2 software. The mapped reads of each sample were assembled by StringTie in a reference-based approach.
Differential Genetic Data Analysis
Based on the quantitative expression results, differential gene analysis between groups was performed to obtain differentially expressed genes between the groups. The DESeq2 workflow was used for differential expression analysis. The filtered raw counts were normalized using the DESeq method, and differentially expressed genes were determined by the screening threshold was: |log2FC| ≥ 2 and p-adjust < 0.05. Hierarchical clustering of differentially expressed genes was performed using the R/Bioconductor packages.
Enrichment Analysis
To search for unique biological processes, cellular components, and molecular functions, GO enrichment analysis was performed on significantly differential genes. GO enrichment analysis was performed using the clusterProfiler,Citation28 and the enrichment results were then displayed using the ggplot2 package. Where a p-value < 0.05 was considered significant. In this part, we perform functional enrichment analysis on the genes in the differential gene/transcript set to obtain which functions or which metabolic pathways are mainly involved in the genes/transcripts in the gene set, including GO enrichment analysis.
Protein–Protein Interactions (PPIs) Network Construction
STRING Protein–Protein Interaction Networks Functional Enrichment Analysis (https://string-db.org/, v11.5) was employed to perform protein–protein interaction network model (PPI). Select “multiple proteins” and set the biological species to “Homo sapiens” to search. Set the score ≥ 0.9 to improve the credibility of the biological information and derive the PPI network graph through the processing of the above information.
Prediction of Drugs Targeting DEGs
TISIDB (http://cis.hku.hk/TISIDB/index. php) is an online website that focuses on the interactions between cancer and the immune system and contains multiple heterogeneous data types. In this study, TISIDB was employed to predict possible target drugs.
Statistical Analysis
Continuous variables in patient baseline data were presented as mean ± standard deviation. The significance of group comparisons was tested using paired or unpaired Student’s t-test (for two groups) or one-way ANOVA (for more than two groups). R v4.2.1 was used for statistical analysis, volcano and heatmap plots. P values of less than 0.05 were considered significant.
Results
Comparison of Transcription Characteristics of the Two Groups of Patients
Transcriptome Characteristics Between T2D, T2D + LEAOD and Normal Group
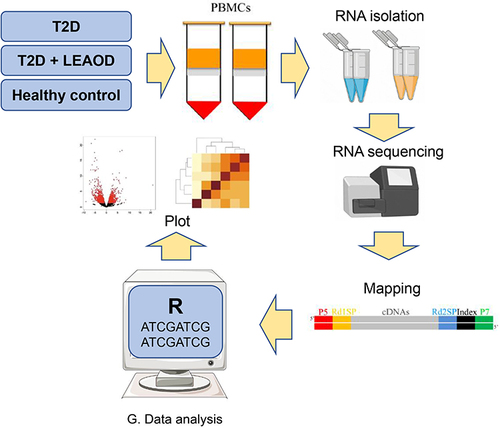
Totally nine patients and six healthy controls were involved in this study, and the clinical characteristics are shown in . There were no significant differences in sex, average age, and body mass index (BMI) in the healthy control group, T2D group, and the T2D + LEAOD group. Compared with the healthy control group, both the T2D group and the T2D + LEAOD group had significantly higher levels of total cholesterol, low-density lipoprotein (LDL)-cholesterol, and hemoglobinA1c (HbA1c). Blood samples were collected from T2D, T2D + LEAOD and normal donors, then peripheral blood mononuclear cells (PBMCs) are separated via centrifugation, red blood cells are lysed and removed, and samples from different individuals are processed for RNA extraction and cell transcriptomes are sequenced using NovaSeq 6000 sequencer, the raw data was trimmed and mapped to human genome, then differentially expressed genes are analysis with R and R packages, the results are displayed with different plot. The workflow for this study is summarized in .
Figure 1 The workflow of this study. The study strategy in this study was executed in a three-step manner. In the first step, PBMCs are isolated from the T2D, T2D + LEAOD, and healthy normal donors. Then followed by RNA extraction, purification, library construction and RNA sequencing with NovaSeq 6000 sequencer. After that, the data is subjected to read mapping and differential expression analysis. Gene set enrichment and Venn analyses were performed to identify the GO (Gene Ontology) terms were specifically enriched in different groups. Type 2 diabetes (T2D), lower extremity arteriosclerosis occlusion (LEAOD), peripheral blood mononuclear cells (PBMCs).
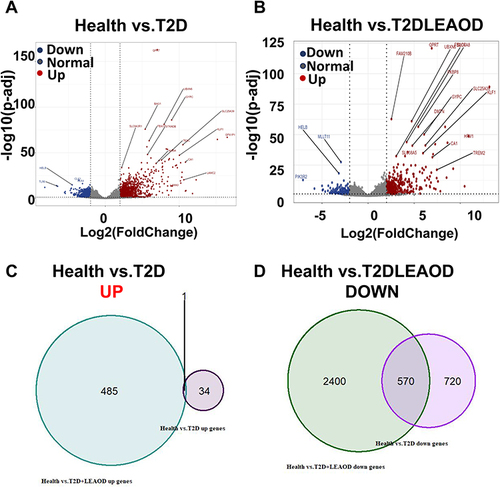
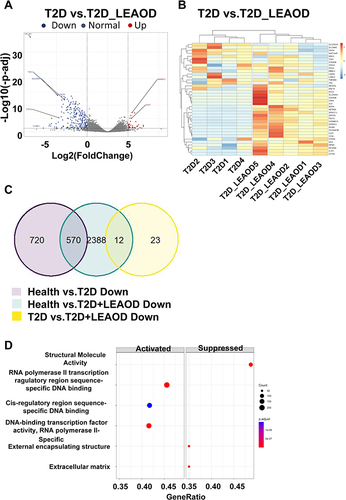
To characterize the pathologic response to T2D and (or) LEAOD patients, RNA-seq was performed on blood samples from nine patients (T2D = 4, T2D + LEAOD = 5) and six normal. We analyzed RNA-seq data from PBMCs of patients and healthy controls to profile the transcriptomic characteristics of T2D vs health and T2D + LEAOD vs health. With the threshold criteria of fold change > 2, p-value < 0.05, we conducted differentially expressed genes (DEGs) analysis of T2D vs normal, and T2D + LEAOD vs normal to determine whether any signature genes were enriched in specific groups. Overall, a total of 1325 differentially expressed genes (DEGs) were obtained in T2D vs normal, of which 35 were up-regulated and 1290 were down-regulated (). While in T2D + LEAOD vs normal, 3456 differentially expressed genes (DEGs) were identified, with 486 genes were up-regulated and 2970 genes were down-regulated (). To explore the common pathway or genes in T2D and (or) LEAOD vs normal, Venn diagram, was used to construct the Venn plot of the two groups of DEGs, among the up regulated DEGs in both T2D vs normal and T2D + LEAOD vs normal, only one gene was shared by these two comparation, DRICH1 gene is up regulated in both T2D and T2D + LEAOD compared to normal, which encode an Aspartate-Rich Protein 1 (). We also compare the down regulated DEGs, whereas 570 genes downregulated in T2D were also found to be down regulated in T2D + LEAOD. In addition, the top 10 significantly downregulated genes shared by T2D and LEAOD were WDR54, RHBDD2, PDK2, KDM7A, SPAG9, MPND, UQCRC1, ZNF200, LYPLA2, and APBA3, which indicate that these pathways are shared by T2D and (or) LEAOD compared to normal ().
Figure 2 Transcriptomic characteristics between T2D and T2D + LEAOD. (A and B). The volcano plots showed the differentially expressed genes in PBMCs samples between T2D (n = 4) vs normal (n = 6) (left), T2D + LEAOD (n = 5) vs normal (right). Cutoff: Fold change >2, p < 0.05. (C and D). Venn diagrams exhibited the overlap up- (left) or down- (right) regulated differentially expressed protein numbers between T2D vs normal, T2D + LEAOD vs normal.
Conserved and Differential Pathways in T2D and (or) LEAOD Patients
To explore the related functions and pathways of the differentially expressed genes in the two groups, we performed GO enrichment analysis on DEGs. Then, the biological processes of up- or down-regulated genes in T2D and (or) LEAOD compared with normal PBMC were enriched. Activated DEGs within T2D (vs normal) were significantly enriched in extracellular exosome, structure molecule activity, and external encapsulating structure targeting to membrane and response to external communication (, left panel). While the suppressed DEGs within T2D (vs normal) were significantly enriched with the transcription process, which included RNA polymerase II transcription regulatory region sequence-specific DNA binding, DNA-binding transcription factor activity, and cis-regulatory region sequence-specific DNA binding (, right panel). Within the comparison of T2D + LEAOD (vs normal), the activated DEGs were enriched in extracellular organelle, extracellular membrane-bounded organelle, and extracellular vesicle (, left panel). The suppressed DEGs are enriched with a similar transcription pathway, such as RNA polymerase II transcription regulatory region sequence-specific DNA binding, DNA-binding transcription factor activity, and transcription regulatory region nucleic acid binding (, right panel).
Figure 3 Conserved and differential pathways in T2D and LEAOD patients. (A and B). Dot plot showing significantly enriched activated and suppressed GO pathways. The vertical items are the names of GO terms, and the length of horizontal graph represents the gene ratio. The depth of the color represents the adjusted p-value (adjusted P < 0.05). The area of circle in the graph means gene counts. (C and D). Gene set enrichment analysis (GSEA) based GO enrichment plots of representative gene sets significantly enriched hallmarks between T2D vs normal (left), T2D + LEAOD vs normal (right). (E and F). Enrichment map for GO pathways and overlap with DEG gene-sets. The map indicated the specifically enriched GO pathways in T2D vs normal, T2D + LEAOD vs normal. The size of circle represents the gene counts, the thickness of color represents significance. GO and GSEA analysis was performed by using R package clusterProfiler (version 4.6.2); R package DOSE (version 3.24.2); and R package org. Hs.eg.db (version 3.16.0). The analysis results were visualized by using R package Enrichplot (version 1.18.3). Type 2 diabetes (T2D), lower extremity arteriosclerosis occlusion (LEAOD), Gene Ontology (GO).
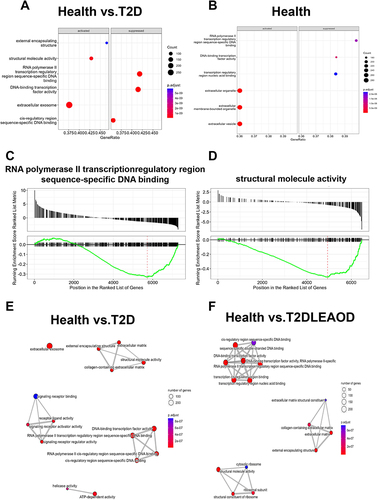
Among all the enriched pathways, RNA polymerase II transcription regulatory region sequence-specific DNA binding was the most significant pathway enriched by GSEA analysis between in T2D vs normal (). However, for the T2D + LEAOD (vs normal), GSEA analysis showed that the significant enriched pathway is structural molecular activity (). Then, the integrated biological process networks were summarized with the overlap down- and up-DEGs in T2D and T2D + LEAOD (vs normal), we can see in , more than 200 genes involved extracellular exosomes and transcription process with in T2D (vs normal). Within T2D + LEAOD (vs normal), the most significant pathways are DNA binding, structure associated activity, and external matrix associated process ().
Characterizing the sexual dimorphism gene expression profiles of T2D and LEAOD
It’s reported T2D has often been found to be more common in men,Citation29 but the prevalence is equal or higher among women in some populations, the sex difference risk factors for T2D is likely due to mixed effects, including insulin resistance, BMI “threshold” hormones regulating system, and life span.Citation30,Citation31 Moreover, the risk of cardiovascular disease is also elevated differently among men and women with T2D.Citation31 Studies suggest that T2D confers 25–50% greater excess risk of incident cardiovascular disease (CVD) in women compared with men.Citation32 These are the issues most often associated with T2D in female patients. However, little is known about which genes display a sexual pattern in T2D patients.
To investigate the gene expression characteristics of different genders, we also compared the differentially expressed mRNA of T2D, T2D + LEAOD and control groups (fold change > 2, p value < 0.05, ). There were 12 up-regulated genes and 14 down-regulated proteins in female vs male in controls (), while 2 up-regulated genes and 47 down-regulated genes were identified in T2D (), compared to T2D, 6 up-regulated genes and 1 down-regulated gene were identified in T2D + LEAOD ().
Figure 4 Sexual dimorphism gene expression profiles of T2D and LEAOD. (A–C). The volcano plots showed the differentially expressed proteins in PBMCs samples between female vs male in Health (A), T2D (B), and T2D + LEAOD (C) separately. Cutoff: Fold change > 2, p < 0.05. (D–E). Venn diagrams exhibited the overlap up- and down- regulated differentially expressed gene numbers in female vs male of normal, T2D, and T2D + LEAOD. (F). Heatmap plot showed the top 20 up- and down- regulated differentially expressed genes (female vs male) according to log2 (counts). Type 2 diabetes (T2D), lower extremity arteriosclerosis occlusion (LEAOD), peripheral blood mononuclear cells (PBMCs).
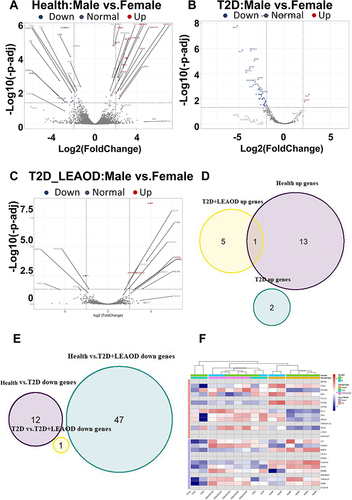
We also tried to compare the overlapped genes among these three groups; however, only one gene was shared by health control and T2D + LEAOD, MYOM2 (Myomesin 2) gene is associated with Rheumatic Fever and Blood Protein Disease (). We did not find any overlapped down regulated genes among these three groups (), which indicates that the sexually different gene expression pattern is distinct in T2D and LEAOD diseases. Although there are conflicting data on the sex chromosomes and sex hormone effect on the sexual dimorphism,Citation33,Citation34 we did not observe X or Y chromosomes located in increased or decreased genes. Furthermore, we compared DEGs of health controls with T2D and LEAOD groups with heatmap (). We found that the most up-regulated sex different expression genes in T2D are CLC (Charcot-Leyden Crystal Galectin) and ISG15 (ISG15 Ubiquitin Like Modifier), which involve multifunctional lysophospholipids and intracellular target protein ubiquitin modifications. While the down regulated sex different expression gene in T2D + LEAOD is KLRF1 (Killer Cell Lectin Like Receptor F1), an activating homodimeric C-type lectin-like receptor (CTLR), is expressed in nearly all natural killer (NK) cells and stimulates their cytotoxicity and cytokine release,Citation35 its related pathways are Innate Immune System and Class I MHC mediated antigen processing and presentation.
Transcriptomic Difference Between T2D and T2D + LEAOD
To gain further insight into the functional role of the different gene expression features of T2D and T2D + LEAOD, in this part, we identified the differentially expressed genes between them (fold change > 2, p-value < 0.05, ). We choose the top 20 up and down DEGs for a heatmap plot to get the differential gene distribution in T2D vs T2D + LEAOD (). We can find that the top 20 up and down DEGs also show a high variation within the individuals in each group. To further explore the common genes shared by these comparisons, the genes down-regulated in health control vs T2D vs T2D + LEAOD are shown in Venn diagram (). We found 570 down regulated DEGs that were overlapped in T2D (vs normal) and T2D + LEAOD (vs normal), but only 12 down regulated DEGs were shared by T2D + LEAOD (vs normal) and T2D vs T2D + LEAOD (). In order to further uncover the molecular mechanism of these DEGs in T2D vs T2D + LEAOD, GO enrichment analyses were conducted for these disease related DEGs (). The result showed that activated DEGs within T2D vs T2D + LEAOD were significantly enriched with RNA polymerase II transcription regulatory region sequence-specific DNA binding, DNA-binding transcription factor activity, and cis-regulatory region sequence-specific DNA binding (, left panel). While the suppressed DEGs within T2D vs T2D + LEAOD were significantly enriched with the structure molecule activity, external encapsulating structure, and extracellular matrix (, right panel).
Figure 5 Transcriptomic difference between T2D and T2D + LEAOD. (A)The volcano plots showed the differentially expressed proteins in PBMCs samples between T2D vs T2D + LEAOD. Cutoff: Fold change >2, p < 0.05. (B). Heatmap plot showed the top 20 up- and down- regulated differentially expressed genes according to log2 (counts). (C). Venn diagrams exhibited the overlap up- and down- regulated differentially expressed gene numbers in comparison of T2D (vs normal), T2D + LEAOD (vs normal), and T2D vs T2D + LEAOD. (D). Gene set enrichment analysis (GSEA) based GO-enrichment plots of representative gene sets significantly enriched hallmarks between T2D vs T2D + LEAOD. Type 2 diabetes (T2D), lower extremity arteriosclerosis occlusion (LEAOD), Gene Ontology (GO).
Protein–Protein Interaction Network (PPI) Analysis
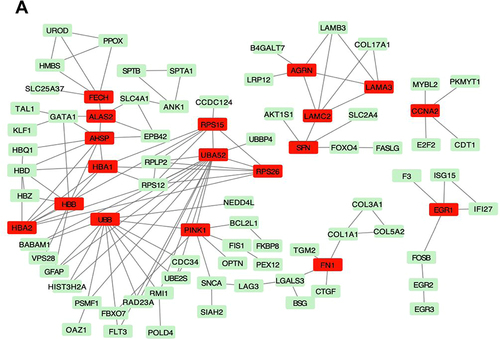
To determine the relationship between differential genes and lower extremity arterial occlusion, we identified genes associated with lower extremity arterial occlusion by searching the GeneCards database. The interaction score was set to high test confidence (0.9). The PPI network of DEGs was visualized using Cytoscape software. According to the topological score, UBA52, RPS15, AHSP, UBB, HBB, PINK1, HBA1, and HBA2 ranked significant hub genes, as shown in .
Figure 6 Protein–Protein Interaction Network in T2D vs T2D + LEAOD. (A). Topology of the backbone network. The backbone network consisted of 18 nodes with a high BC value and 67 edges. Nodes marked with red are the 18 nodes DEGs in T2D vs T2D + LEAOD. Type 2 diabetes (T2D), lower extremity arteriosclerosis occlusion (LEAOD), differentially expressed genes (DEGs), Protein-Protein Interaction Network (PPI).
Drug Target Prediction
To search for potential drugs that might interfere with the disease process of T2D + LEAOD, we used the TISIDB online tool to predict the drugs targeting top up and down regulated genes in both the T2D and T2D + LEAOD groups in . Finally, 1 up regulated and top 10 down regulated genes including DRICH1, WDR54, RHBDD2, PDK2, KDM7A, SPAG9, MPND, UQCRC1, ZNF200, LYPLA2, and APBA3 were loaded into the TISIDB database, and the result is shown in .
Table 2 The Top 10 Down Regulated Genes Shared by T2D and LEAOD
Discussion
The incidence of lower extremity arteriosclerotic occlusive disease in patients with type 2 diabetes is 2–4 times that of the general population.Citation36 Arteriosclerotic obliterans of the lower extremities usually occurs during the fifth decade of life, and the incidence increases exponentially after the age of 65 years. The occurrence of lower extremity arteriosclerotic occlusive disease involves many factors such as environment, metabolism, and genes. For decades, although research on lower extremity arteriosclerotic occlusive disease has gradually deepened, its pathogenesis has not been elucidated. The pathogenesis of lower extremity arteriosclerotic occlusive disease is complex, and multiple factors such as lipid metabolism disorder, chronic inflammation, abnormal proliferation of smooth muscle cells, oxidative stress, and hemodynamic changes are involved. Based on the results of our research analysis, the main differential genes include DRICH1, WDR54, RHBDD2, PDK2, KDM7A, SPAG9, MPND, UQCRC1, ZNF200, LYPLA2, and APBA3. The functions of these genes mainly include regulation of gene transcription, cell adhesion, and cell–cell communication.
The theoretical study of atherosclerosis has gone through many stages, including the classic lipid infiltration theory and the damage repair theory.Citation37 In 1999, Ross and other scholars put forward an inflammatory immune theory of atherosclerosis, arguing that inflammation runs through the entire process of the occurrence and development of atherosclerosis. Since then, more and more research results have suggested that atherosclerosis is essentially an inflammatory reaction that occurs after blood vessel damage. Macrophages are the most important inflammatory cells in atherosclerotic disease and are the main source of inflammation-related cytokines in plaques.Citation38 The inflammatory response is caused by inflammatory cells such as macrophages through the production and activation of chemokines such as interleukin (IL)-8 and monocyte chemoattractant protein-1.Citation39
In this study, we used RNA-seq to identify unique peripheral blood gene expression signatures of T2D and T2D LEAOD coexisting condition patients. Previous studies have revealed an intrinsic interplay between T2D and LEAOD, while the detailed mechanism remains unclear. Toward this end, our study also compared the gene expression profiles of T2D and LEAOD. We found that the expression of DRICH1 was up-regulated in both T2D and T2D LEAOD patients within PBMCs. In addition, we also found that down-regulated genes in patients with type 2 diabetes mellitus are complicated with LEAOD. In addition to gene transcription-related mechanisms, our findings also found that cell–cell communication pathways were up-regulated in patients with T2D complicated LEAOD. The mechanism behind this association may be that there was a reciprocal regulation between gene expression regulation and external cell signal transduction mediated communication.
Sex differences in disease prevalence, manifestation, and response to treatment are rooted in the genetic differences between men and women.Citation40 In the case of T2D and LEAOD, diversities in body anthropometry and patterns of storage of adipose tissue may impact differences between males and females, especially when sex hormones have a great impact on energy metabolism, body composition, vascular function, and inflammatory responses.Citation41 In this study, total cholesterol, LDL-cholesterol, and HbA1c levels were significantly elevated in patients with T2D and T2D + LEAOD, which is consistent with the reports above. In addition, there were evidence showing sex-specific genes and pathways cause sex differences in T2D.Citation42 However, our data did not find any sex chromosome associated gene.
In addition to the common signatures among T2D and T2D LEAOD patients, we also analyzed the gene sets PPI networks and target drugs with a database. Several possible therapeutics arose from this analysis to target T2D and LEAOD, including kinase inhibitors and gene-specific drugs. Therefore, this work provides a rationale for paying more attention to the deleterious effects of pathogenic gene activation and using these genes as effective treatment strategies for patients with T2D and LEAOD.
However, it should be mentioned that the present study has some limitations that should be kept in mind when interpreting the data. The number of samples for RNA-seq was relatively small; therefore, the conclusion from comparison was not ideal, so studies of large sample size need to be conducted to confirm the conclusion. We also have no chance to get information about circulating sex hormone levels (estrogen and testosterone) within these blood samples, which is another limitation of this study. Of note, the conclusion summarized from this study is just limited to the information and data currently; instead, the conclusion may change, even become controversial as more patients and data are collected in the future.
Conclusion
This study showed that the gene expression profile in patients with T2D and LEAOD. These diseases share both common and specific gene expression patterns compared to the control group. Note that gene transcription regulation and cell–cell communication processes coexist in these conditions. This study provides evidence at the transcript level to show the association of T2D, LEAOD, and coexisting conditions.
Data Sharing Statement
The data used to support the findings of this study are available from the corresponding author (Rong Huang) upon request.
Ethics Approval and Consent to Participate
The study was approved by the Ethics Committee of the Putuo Hospital Shanghai University of Traditional Chinese Medicine (No. PTEC-R-2021-13-1) and informed consent was obtained from all patients. The research complies with all relevant ethical principles.
Disclosure
The authors declare that they have no competing interests in this work.
Acknowledgments
Guang Zeng and Yong-Zhi Jin are co-first authors for this study.
Additional information
Funding
References
- Urlic H, Kumric M, Vrdoljak J., et al. Role of echocardiography in diabetic cardiomyopathy: from mechanisms to clinical practice. J Cardiovasc Dev Dis. 2023;10(2). doi:10.3390/jcdd10020046
- Bao X, Yang C, Fang K, Shi M, Yu G, Hu Y. Hospitalization costs and complications in hospitalized patients with type 2 diabetes mellitus in Beijing, China. J Diabetes. 2017;9(4):405–411. doi:10.1111/1753-0407.12428
- Kirwan JP, Heintz EC, Rebello CJ, Axelrod CL. Exercise in the prevention and treatment of type 2 diabetes. Compr Physiol. 2023;13(1):1–27. doi:10.1002/cphy.c220009
- Cho NH. Q&A: five questions on the 2015 IDF Diabetes Atlas. Diabet Res Clin Pract. 2016;115:157–159. doi:10.1016/j.diabres.2016.04.048
- Saeedi P, Petersohn I, Salpea P, et al. Global and regional diabetes prevalence estimates for 2019 and projections for 2030 and 2045: results from the international diabetes federation diabetes atlas, 9(th) edition. Diabet Res Clin Pract. 2019;157:107843. doi:10.1016/j.diabres.2019.107843
- Feng F, Chen Y, Wang G, Huang P, Zhu Q, Zhou B. Correlation of serum CysC, IMA, and LP-PLA2 levels with type 2 diabetes mellitus patients with lower extremity atherosclerotic occlusive disease. Front Surg. 2022;9:846470. doi:10.3389/fsurg.2022.846470
- Shen C, Li W. 美国血管外科学会无症状性和间歇性跛行下肢动脉硬化闭塞症诊治指南 [Interpretation and consideration of the Society for Vascular Surgery practice guidelines for atherosclerotic occlusive disease of the lower extremities management of asymptomatic disease and claudication]. Zhonghua Wai Ke Za Zhi. 2016;54(2):81–83. Chinese. doi:10.3760/cma.j.issn.0529-5815.2016.02.001
- Cai H, Fu F, Wang Y, et al. CT血管成像分析下肢动脉硬化闭塞症患者主-髂动脉和肠系膜上动脉狭窄的相关性 [Correlation between the stenosis degree of aorto-iliac artery and superior mesenteric artery in patients with lower extremity atherosclerotic occlusive disease by CT angiography]. Zhonghua wei Zhong Bing ji jiu yi xue. 2018;30(7):635–639. Chinese. doi:10.3760/cma.j.issn.2095-4352.2018.07.004
- Dionyssiou-Asteriou A, Papastamatiou M, Vatalas I, Bastounis E. Serum Lp(a) lipoprotein levels in patients with atherosclerotic occlusive disease of the lower extremities. Eur J Vasc Endovasc Surg. 2000;20(1):57–60. doi:10.1053/ejvs.2000.1100
- Wu WW, Jiang XY, Liu CW, Li YJ, Zeng R. Lower extremity arterial occlusive disease as a rare complication of Crohn’s disease. Chin Med Sci J. 2009;24(3):167–171. doi:10.1016/s1001-9294(09)60083-3
- Montesanto A, Bonfigli AR, Crocco P, et al. Genes associated with Type 2 Diabetes and vascular complications. Aging. 2018;10(2):178–196. doi:10.18632/aging.101375
- Murea M, Ma L, Freedman BI. Genetic and environmental factors associated with type 2 diabetes and diabetic vascular complications. Rev Diabet Stud. 2012;9(1):6–22. doi:10.1900/rds.2012.9.6
- Aziz H, Zaas A, Ginsburg GS. Peripheral blood gene expression profiling for cardiovascular disease assessment. Genomic Med. 2007;1(3–4):105–112. doi:10.1007/s11568-008-9017-x
- Xu Y, Xu Q, Yang L, et al. Gene expression analysis of peripheral blood cells reveals toll-like receptor pathway deregulation in colorectal cancer. PLoS One. 2013;8(5):e62870. doi:10.1371/journal.pone.0062870
- Qi S, Ngwa C, Morales Scheihing DA, et al. Sex differences in the immune response to acute COVID-19 respiratory tract infection. Biol Sex Differ. 2021;12(1):66. doi:10.1186/s13293-021-00410-2
- Kitajima S, Iwata Y, Furuichi K, et al. Messenger RNA expression profile of sleep-related genes in peripheral blood cells in patients with chronic kidney disease. Clin Exp Nephrol. 2016;20(2):218–225. doi:10.1007/s10157-015-1150-y
- Wingrove JA, Daniels SE, Sehnert AJ, et al. Correlation of peripheral-blood gene expression with the extent of coronary artery stenosis. Circ Cardiovasc Genet. 2008;1(1):31–38. doi:10.1161/circgenetics.108.782730
- Schadt EE. Molecular networks as sensors and drivers of common human diseases. Nature. 2009;461(7261):218–223. doi:10.1038/nature08454
- Turner AW, Wong D, Khan MD, Dreisbach CN, Palmore M, Miller CL. Multi-omics approaches to study long non-coding RNA function in atherosclerosis. Front Cardiovasc Med. 2019;6:9. doi:10.3389/fcvm.2019.00009
- Jia X, Yang Y, Chen Y, et al. Multivariate analysis of genome-wide data to identify potential pleiotropic genes for type 2 diabetes, obesity and coronary artery disease using MetaCCA. Int J Cardiol. 2019;283:144–150. doi:10.1016/j.ijcard.2018.10.102
- Döring Y, Noels H, Weber C. The use of high-throughput technologies to investigate vascular inflammation and atherosclerosis. Arterioscler Thromb Vasc Biol. 2012;32(2):182–195. doi:10.1161/atvbaha.111.232686
- Chatterjee S, Peters SA, Woodward M, et al. Type 2 diabetes as a risk factor for dementia in women compared with men: a pooled analysis of 2.3 million people comprising more than 100,000 cases of dementia. Diabetes Care. 2016;39(2):300–307. doi:10.2337/dc15-1588
- Shen Y, Cai R, Sun J, et al. Diabetes mellitus as a risk factor for incident chronic kidney disease and end-stage renal disease in women compared with men: a systematic review and meta-analysis. Endocrine. 2017;55(1):66–76. doi:10.1007/s12020-016-1014-6
- Tracey ML, McHugh SM, Buckley CM, Canavan RJ, Fitzgerald AP, Kearney PM. The prevalence of Type 2 diabetes and related complications in a nationally representative sample of adults aged 50 and over in the Republic of Ireland. Diabet Med. 2016;33(4):441–445. doi:10.1111/dme.12845
- Nordström A, Hadrévi J, Olsson T, Franks PW, Nordström P. Higher prevalence of type 2 diabetes in men than in women is associated with differences in visceral fat mass. J Clin Endocrinol Metab. 2016;101(10):3740–3746. doi:10.1210/jc.2016-1915
- Yang W, Lu J, Weng J, et al. Prevalence of diabetes among men and women in China. N Engl J Med. 2010;362(12):1090–1101. doi:10.1056/NEJMoa0908292
- Alberti KG, Zimmet PZ. Definition, diagnosis and classification of diabetes mellitus and its complications. Part 1: diagnosis and classification of diabetes mellitus provisional report of a WHO consultation. Diabet Med. 1998;15(7):539–553. doi:10.1002/(sici)1096-9136(199807)15:7<539::Aid-dia668>3.0.Co;2-s
- Yu G, Wang LG, Han Y, He QY. clusterProfiler: an R Package for Comparing Biological Themes Among Gene Clusters. Omics. 2012;165:284–287. doi:10.1089/omi.2011.0118
- Wild S, Roglic G, Green A, Sicree R, King H. Global prevalence of diabetes: estimates for the year 2000 and projections for 2030. Diabetes Care. 2004;27(5):1047–1053. doi:10.2337/diacare.27.5.1047
- Sattar N. Gender aspects in type 2 diabetes mellitus and cardiometabolic risk. Best Pract Res Clin Endocrinol Metab. 2013;27(4):501–507. doi:10.1016/j.beem.2013.05.006
- Arnetz L, Ekberg NR, Alvarsson M. Sex differences in type 2 diabetes: focus on disease course and outcomes. Diabetes Metab Syndr Obes. 2014;7:409–420. doi:10.2147/dmso.S51301
- Huebschmann AG, Huxley RR, Kohrt WM, Zeitler P, Regensteiner JG, Reusch JEB. Sex differences in the burden of type 2 diabetes and cardiovascular risk across the life course. Diabetologia. 2019;62(10):1761–1772. doi:10.1007/s00125-019-4939-5
- Deegan DF, Engel N. Sexual dimorphism in the age of genomics: how, when, where. Front Cell Dev Biol. 2019;7. doi:10.3389/fcell.2019.00186
- Bramble MS, Lipson A, Vashist N, Vilain E. Effects of chromosomal sex and hormonal influences on shaping sex differences in brain and behavior: lessons from cases of disorders of sex development. J Neurosci Res. 2017;95(1–2):65–74. doi:10.1002/jnr.23832
- Kuttruff S, Koch S, Kelp A, Pawelec G, Rammensee HG, Steinle A. NKp80 defines and stimulates a reactive subset of CD8 T cells. Blood. 2009;113(2):358–369. doi:10.1182/blood-2008-03-145615
- Firnhaber JM, Powell CS. Lower extremity peripheral artery disease: diagnosis and treatment. Am Fam Physician. 2019;99(6):362–369.
- Libby P. The changing landscape of atherosclerosis. Nature. 2021;592(7855):524–533. doi:10.1038/s41586-021-03392-8
- Sun X, Guo S, Yao J, et al. Rapid inhibition of atherosclerotic plaque progression by sonodynamic therapy. Cardiovasc Res. 2019;115(1):190–203. doi:10.1093/cvr/cvy139
- Kure K, Sato H, Aoyama N, Izumi Y. Accelerated inflammation in peripheral artery disease patients with periodontitis. J Periodontal Implant Sci. 2018;48(6):337–346. doi:10.5051/jpis.2018.48.6.337
- Mauvais-Jarvis F, Bairey Merz N, Barnes PJ, et al. Sex and gender: modifiers of health, disease, and medicine. Lancet. 2020;396(10250):565–582. doi:10.1016/S0140-6736(20)31561-0
- de Ritter R, de Jong M, Vos RC, et al. Sex differences in the risk of vascular disease associated with diabetes. Biol Sex Differ. 2020;11(1):1. doi:10.1186/s13293-019-0277-z
- He T, Zhong PS, Cui Y. A set-based association test identifies sex-specific gene sets associated with type 2 diabetes. Front Genet. 2014;5. doi:10.3389/fgene.2014.00395