
Abstract
Purpose
Hyperuricemia (HUA) is a recognized risk factor for non-alcoholic fatty liver disease (NAFLD). Early diagnosis and the identification of predictive factors are important for the HUA population. This study aimed to investigate the potential relationship between the metabolic score for insulin resistance (METS-IR) index and the triglyceride and glucose (TyG) index with NAFLD in individuals with HUA.
Patients and Methods
A total of 5537 HUA participants were included in the study. Hepatic ultrasonography was conducted following the latest diagnostic criteria to diagnose NAFLD. The relationship between the TyG and METS-IR index and NAFLD was evaluated by multivariable logistic regression analysis and restricted cubic spline model (RCS). In addition, the area under the curve (AUC), positive likelihood ratio, and negative likelihood ratio were explored to compare the predictive value of IR surrogates for NAFLD with HUA. The AUCs of the two indicators were compared using the DeLong test.
Results
Multivariable logistic regression analysis revealed that elevated TyG (OR = 2.285, 95% CI: 1.525, 3.428) and METS-IR (OR = 1.242, 95% CI: 1.219, 1.266) indices significantly increase the risk of NAFLD. Meanwhile, the RCS analysis revealed a -log-shaped nonlinear relationship between NAFLD risk and the METS-IR index (P non-linear < 0.001), contrasting with the linear association observed with the TyG index (P non-linear = 0.763). Notably, the risk of NAFLD demonstrated a significant escalation when the METS-IR index exceeded the threshold of 39.208 (OR=1). Compared to the TyG index (AUC = 0.734, 95% CI: 0.721~0.748), the METS-IR index (AUC = 0.821, 95% CI: 0.810~0.832) demonstrated superior predictive value for NAFLD in individuals with HUA according to the DeLong test.
Conclusion
In the HUA population, the METS-IR index has a higher predictive value for NAFLD than the TyG index, contributing to early diagnosis and disease prevention.
Introduction
Non-alcoholic fatty liver disease (NAFLD) is considered one of the primary public health problems in the world. It has been reported that the prevalence of NAFLD worldwide is approximately 25%.Citation1 In Western countries, the prevalence ranges from 24% to 42%,Citation2 and there is an increasing impact of NAFLD on populations in Asian countries. A meta-analysis conducted in China revealed a staggering prevalence of NAFLD at 29.5%,Citation3 highlighting the urgency of addressing this issue. Notably, NAFLD not only has the potential to progress into chronic liver diseaseCitation4 but also represents a metabolic disorder that increases the risk of developing other conditions such as diabetes, hyperuricemia (HUA),Citation5 and cardiovascular disease.Citation6 These comorbidities significantly impact individuals’ overall quality of life.
Purine nucleotides are catalyzed by xanthine oxidoreductase to produce uric acid (UA) in the intestine, liver, and muscle. The majority of UA is eliminated through renal excretion (70%), while a smaller portion is cleared through the gastrointestinal tract (30%).Citation7 Disturbances in purine metabolism or abnormal excretion of UACitation8 or certain drugsCitation9 could lead to elevated serum uric acid (SUA) levels. Elevated uric acid levels not only serve as the pathological basis for gout but are also closely related to insulin resistance (IR),Citation8 hypertension,Citation10 and carotid atherosclerosis.Citation11
In recent years, many scholars have explored the relationship between UA and NAFLD, consistently demonstrating a significant positive correlation between higher SUA levels and the incidence of NAFLD.Citation5,Citation12 Wan et alCitation13 demonstrated that elevated SUA levels can lead to hepatocyte steatosis via NLRP3 inflammatory vesicles. Furthermore, increased SUA levels can induce endoplasmic reticulum stress in hepatocytes, leading to a significant rise in GRP78/94 levels and activation of SREBP-1c, subsequently disrupting hepatocyte lipid metabolism.Citation14 Additionally, it has been observed that high SUA can activate the NF-κB inflammatory signaling pathway by upregulating reactive oxygen species expression in liver cells, thereby exacerbating inflammatory damage in the liver.Citation15 Notably, elevated UA levels may promote IRS1 phosphorylation, which inhibits downstream Akt phosphorylation,Citation16 leading to IR and further contributing to an increase in lipid peroxidation products in hepatocytes. Detecting individuals within the HUA population who are more susceptible to NAFLD at an early stage can greatly contribute to the prevention and reduction of adverse liver-related prognostic events.
Since NAFLD often presents asymptomatically in its early stages, patients are often detected during health check-ups.Citation17 While liver biopsy is considered the gold standard for diagnosing liver-related diseases, its invasive nature limits its widespread acceptance. In addition, large-scale liver ultrasound screening for NAFLD can lead to the inefficient utilization of public health care resources. Therefore, there is an urgency to discover biological markers (non-invasive and accurate) conducive to early detection of NAFLD. The metabolic score for insulin resistance (METS-IR) index and the triglyceride and glucose (TyG) index are newly proposed, non-invasive IR surrogates for the assessment of IR levels.Citation18,Citation19 The METS-IR index and TyG index are associated with metabolic and inflammatory diseases.Citation20,Citation21 In addition, NAFLD is characterized with increased chronic inflammation.Citation22 Moreover, high UA levels are also correlated with inflammatory conditions such as hypertension,Citation23 thyroiditis,Citation24 metabolic syndrome,Citation25 type 2 diabetes mellitus (T2DM),Citation26 including new-onset diabetes,Citation27 and diabetic kidney disease.Citation28 UA levels are also associated with hepatic steatosis.Citation29 Thus, studying these markers in NAFLD patients with hyperuricemia makes sense. Our study aimed to investigate the predictive capacity of the TyG index and METS-IR index for NAFLD in individuals with HUA.
Materials and Methods
Participants
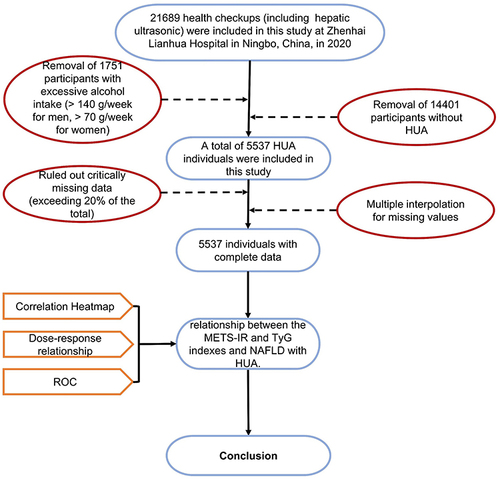
This study initially included 21,689 adults who had been checked up (including hepatic ultrasonic) at Zhenhai Lianhua Hospital, Ningbo, China, in 2020. The hospital’s electronic medical record system was employed to compile participant data. Based on predefined inclusion and exclusion criteria, 1751 participants with excessive alcohol consumption and 14,401 participants without HUA were excluded from the analysis. Indicators with missing data exceeding 20% of the total were excluded, while those with missing data less than 20% underwent multiple imputations to fill in the gapsCitation30 (). Ultimately, this study contained 5537 participants. shows the flowchart of the participants.
Figure 1 Missing values of variables.
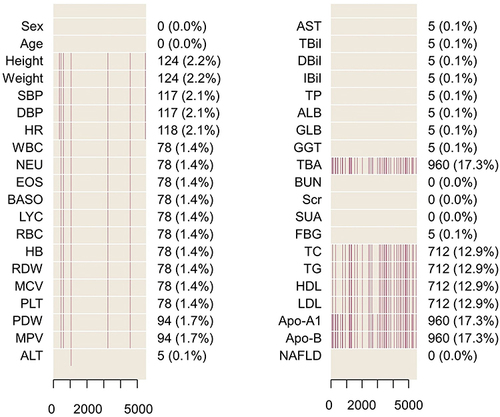
Figure 2 Flowchart of the participants.
Inclusion criteria: UA concentrations above 420 µmol/L for males and 360 µmol/L for females; age ≥ 18 years.
Exclusion criteria: Diagnosed with viral liver disease or autoimmune liver disease; alcohol consumption: male ≥140 g/w or female ≥70 g/w.
Clinical Baseline Data
Information on participants’ demographic information, vital signs, and laboratory tests was collected from the electronic medical record system. Clinical examinations were performed in the morning after an overnight fast, and participants avoided exercise the day before the examination. Standing height and weight were measured by the physician according to standard procedures. The seated blood pressure of the participants in a calm state was measured using an automatic sphygmomanometer. Fasting venous blood samples were collected for blood routine and biochemical analysis, including fasting blood glucose and lipid parameters.
Definitions
Using liver biopsy as a reference, ultrasound had high sensitivity and specificity in distinguishing moderate to severe fatty liver from no steatosis.Citation31 Therefore, NAFLD was diagnosed by abdominal ultrasound after ruling out significant alcohol consumption (male ≥140 g/w or female ≥70 g/w), viral or autoimmune liver disease. Ultrasonography was performed by a sonographer who was blinded to the study design and laboratory data. Hepatic steatosis was diagnosed by characteristic echo patterns according to conventional diagnostic criteria. Typical ultrasonographic features are hyper echogenicity as compared to the right renal parenchyma, indistinct visualization of intrahepatic ductal structures, and attenuation of echoes in the distal region.Citation2 Weight divided by height squared was used to determine the body mass index (BMI). IR surrogates are the TyG index and the METS-IR index. These were computed utilizing the formulas below:
Statistical Analysis
The analysis of statistics was executed utilizing R version 4.1.2 software. Firstly, the normality of the relevant data was tested using the Kolmogorov–Smirnov test. Continuous variables are presented as mean ± standard deviation for normally distributed variables. For variables that were not normally distributed, medians (interquartile range) are reported. The Mann–Whitney U-test or independent sample t-test was utilized for the analysis of continuous variables. The chi-square test was utilized to evaluate the categorical variables, which were quantified as counts (%).
Multivariable logistic regression analysis was performed after adjusting for baseline age, DBP, HR, EOS, BASO, HB, MCV, PLT, AST, ALT, TP, GLB, GGT, Scr, SUA, TG, HDL, Apo-B, TyG, and METS-IR to ascertain the independent connection between IR surrogates and NAFLD with HUA. Furthermore, a restricted cubic spline (RCS) analysis was performed to explore any potential non-linear relationship between IR surrogates and NAFLD in individuals with HUA. The potential for prediction of the TyG and the METS-IR indexes for NAFLD with HUA was evaluated using the area under the receiver operating characteristic (ROC) curves (AUC). RCS analysis and ROC curves were implemented using the “rms” and “pROC” packages in the R software, respectively. The DeLong test was used to compare the statistical difference between AUCs. The researchers computed the Youden index, positive likelihood ratio (PLR), and negative likelihood ratio (NLR) to conduct a comprehensive comparison of the predictive accuracy of the two IR surrogates. All statistical tests were two-tailed, and a significance level of P < 0.05 was considered statistically significant.
Results
Baseline Characteristics of the Study Population
A total of 5537 individuals underwent evaluation for this study, the median age of the participants was 47.00 (33.00, 61.00) years. Among them, there were 4483 (81.00%) males and 1054 (19.00%) females. Furthermore, 3167 (57.2%) of the participants were diagnosed with NAFLD. According to univariate analysis, patients with NAFLD exhibited a higher likelihood of advanced age, elevated BMI, and increased susceptibility to dysregulated lipid metabolism, characterized by elevated levels of total cholesterol (TC), triglycerides (TG), low-density lipoprotein (LDL), and apolipoprotein-B (Apo-B) as well as lower levels of high-density lipoprotein (HDL) (all P < 0.001). Additionally, the NAFLD group displayed higher values of white blood cell count (WBC), neutrophil count, eosinophil count, and lymphocyte count (LYC) than the non-NAFLD group. Notably, patients with NAFLD demonstrated markedly elevated values for both the METS-IR and TyG indices compared to those without the condition (all P < 0.001). provides more basic information for participants.
Table 1 Univariate Analysis of NAFLD in the HUA Population
Independent Risk Factors
We selected 35 variables with P < 0.05 in to screen for independent risk factors. Before building the multivariable logistic regression model, the researchers examined the collinearity among the candidate variables by analysis of covariance, in which variance inflation factors (VIF) >10 for WBC, NEU, METS-IR index, BMI, LDL, LYC, TC, TG, TyG index, red blood cell count, HDL. Ultimately, 20 variables (VIF < 10) were obtained by stepwise backward logistic regression analysis while retaining the IR surrogates. Furthermore, multivariable logistic regression analysis indicated that the TyG index (OR = 2.285, 95% CI: 1.525, 3.428) and METS-IR index (OR = 1.242, 95% CI: 1.219, 1.266) were all independent factors strongly associated with NAFLD (all P < 0.001), and the remaining independent risk factors were illustrated in .
Table 2 Multivariable Logistic Regression Analysis
Association Analysis of Independent Risk Factors
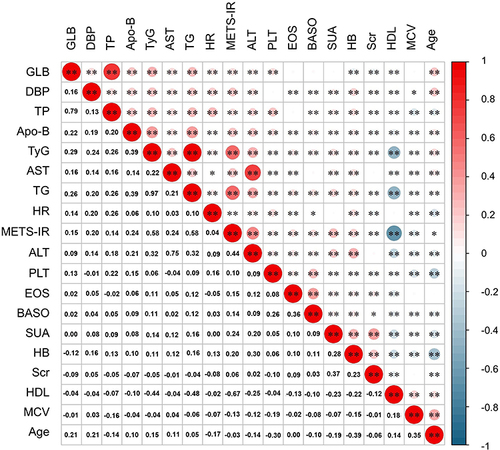
The correspondence of IR surrogates to other independent risk factors was visualized by heatmap (). The METS-IR index indicated a strong positive correlation with both TG (r = 0.58, P < 0.05) and ALT (r = 0.44, P < 0.05). Meanwhile, TG and the TyG index (r = 0.97, P < 0.05) also exhibited a substantial positive connection. On the contrary, HDL displayed a relatively substantial negative association with the METS-IR index (r = −0.67, P < 0.05) and the TyG index (r = −0.44, P < 0.05) compared to other independent factors.
Figure 3 Association of independent risk factors.
Dose-Response Relationship Between IR Surrogates and NAFLD
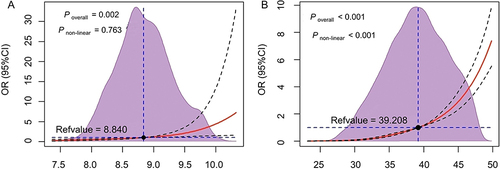
The RCS model was employed to simulate the nonlinear association between IR surrogates and the risk of NAFLD, and the results were visually presented (). The analysis revealed a -log-shaped dose-response relationship between the METS-IR index and the risk of NAFLD (P overall < 0.001, P non−liner = 0.002). In contrast, a linear relationship was observed for the TyG index (P overall < 0.001, P non−liner = 0.203) based on the RCS model. Moreover, there was a positive correlation between the risk of NAFLD and IR surrogates, with the strength of this association intensifying as the levels of IR surrogates increased. Notably, the risk of NAFLD exhibited a substantial increase when the METS-IR index surpassed the threshold of 39.208 (OR = 1).
Figure 4 Dose–response association between the TyG index (A), the METS-IR index (B) and the risk of NAFLD with HUA modeled by using RCS.
Predictive Value of Both IR Surrogates for NAFLD
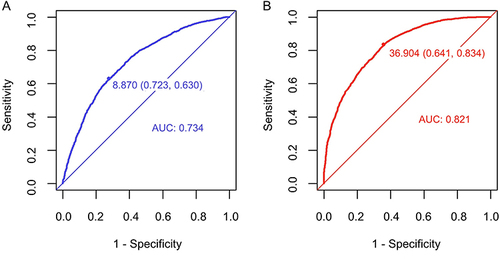
illustrates the AUC values of the TyG index and METS-IR index for forecasting the risk of NAFLD with HUA. Both IR surrogates demonstrated promising predictive values for NAFLD with HUA. Compared with the TyG index (AUC = 0.734, 95% CI: 0.721~0.748), the METS-IR index had an improved AUC of 0.821 (95% CI: 0.810~0.832). Notably, the DeLong test showed that the METS-IR index demonstrated superior predictive value for NAFLD in HUA individuals (P < 0.001). Furthermore, the Youden index, NLR, PLR, and accuracy of the METS-IR index were 36.904, 0.258, 2.326, and 0.752, respectively. For the TyG index, these values were 8.870, 0.512, 2.272, and 0.670, respectively. presents other indicators.
Table 3 Youden Index and Other Evaluation Measures of AUC
Figure 5 The ROC curves of the TyG index (A) and the METS-IR index (B) for prediction of NAFLD with HUA.
Discussion
In this study, the researchers analyzed the health check data of 5537 people with HUA from Ningbo, China. The findings revealed that the proportion of NAFLD within the HUA population was remarkably high at 57.20%, which surpassed the rate observed in the general population.Citation1,Citation3 In addition, the results showed that both IR surrogates were significantly associated with NAFLD and the RCS analysis showed a nonlinear relationship between METS-IR and the risk of NAFLD in the HUA population. Additionally, while both IR surrogates demonstrated good predictive values for NAFLD, with AUC values exceeding 0.7, the METS-IR index exhibited superior predictive performance. These findings provide strong support for the utilization of the METS-IR index as a viable alternative screening instrument for the early detection of NAFLD within the HUA population.
The TyG index, initially introduced as an IR surrogate by Luis E Simental-Mendia in 2008,Citation19 has been extensively investigated for its associations with diabetes, hypertension, and cardiovascular diseases in recent years. Moreover, triglyceride-based markers are also associated with NAFLD and other inflammatory and metabolic disorders such as hypertension,Citation32 cardiovascular conditions,Citation33 and T2DM.Citation34 However, there is limited research on the relationship between the TyG index and NAFLD. A study involving 10,761 healthy Chinese adults found that the TyG index could serve as a promising diagnostic tool for NAFLD in this population, with an optimal cut-off value of 8.5 (AUC = 0.782).Citation35 However, this study did not further analyze the dose-response relationship between the TyG index and NAFLD and only discussed the TyG index as a four-category variable. Moreover, Song et alCitation36 and Smiderle et alCitation37 demonstrated a significant association between the TyG index and NAFLD in youth and obese populations. However, our study provides a comprehensive assessment of the ability of the TyG index to screen and identify NAFLD in the HUA population to complement the existing literature on this topic.
The METS-IR index, originally proposed by Bello-Chavolla,Citation18 has been shown to outperform the TyG index in diagnosing incident T2DM in Mexican subjects. The METS-IR was also reported to be a better indicator of metabolic syndrome in obese subjects than HOMA-AD.Citation38 This superiority is attributed to the inclusion of anthropometric indicators in the calculation formula. Additionally, a study conducted in Korea with 15,798 participants demonstrated that the METS-IR index had better predictive capabilities for incident NAFLD compared to the HOMA-IR.Citation39 Similarly, our study observed that the METS-IR index (AUC = 0.821, 95% CI: 0.810~0.832) exhibited superior predictive value compared to the TyG index for the prevalence of NAFLD in the HUA population. There is a possible explanation for this. Prior research has demonstrated a temporal relationship wherein heightened UA levels antecede the onset of IR.Citation40 Furthermore, adiposity-related factors, including BMI, have been identified as potential mediators, capable of partially or entirely explaining the correlation between SUA and IR.Citation41 Moreover, peripheral IR enhances the uptake of FFA and TG in the liver.Citation42 Therefore, the METS-IR index incorporating BMI, FBG, HDL, and TG is more representative of metabolic disturbances associated with NAFLD in the context of HUA. Furthermore, researchers also discovered a non-linear relationship between the METS-IR index and NAFLD within the HUA population, with a significant increase in the risk of NAFLD when the METS-IR index exceeded 39.208 (OR = 1).
The latest research has found that the prevalence of HUA in the adult population of China was 11.1% in 2015–2016, increasing to 14.0% in 2018–2019, showing an alarming rise over the course of three years.Citation43 The prevalence of NAFLD has increased with the alteration in food and lifestyle behaviors. Studies have shown that compared to the general population, individuals with HUA have a considerably higher incidence of NAFLD. A 4-year retrospective cohort study found that individuals with HUA had a cumulative incidence of NAFLD that was significantly higher than those with normal UA levels (29.0% vs 12.9%, P<0.001).Citation2 It is important to note that a severe type of NAFLD known as nonalcoholic steatohepatitis (NASH) can rapidly progress to end-stage liver disease. According to research, the progression rate from NAFLD to NASH ranges from 9% to 25%.Citation44 Within 8 years, approximately 21% to 26% of NASH patients develop cirrhosis.Citation45 Prior investigation has unequivocally established that HUA substantially elevates the risk of liver fibrosis among individuals with NAFLD.Citation46 Therefore, accurate, timely, and large-scale screening of NAFLD in HUA patients can achieve early intervention, prevent disease progression, and improve prognosis.
Our study includes the following strengths. Firstly, the study had a large sample size, which improved the credibility of the study. Secondly, this study reveals a -log-shaped non-linear relationship between the METS-IR index and NAFLD, which is a novel finding not previously shown. Thirdly, since commonly conducted biochemical tests in clinical include the necessary components (TG, FBG, HDL) for calculating the METS-IR index, individuals can make their initial assessment of NAFLD in a more efficient and cost-effective manner. It provides new perspectives and tools for risk assessment of NAFLD, which can promote more individualized and effective health management strategies in clinical practice.
This study has several limitations. First, compared to liver biopsy, the researchers solely relied on ultrasonography to identify NAFLD, potentially leading to missed cases. Second, given that this is a single-center cross-sectional study, caution should be exercised when extrapolating the research findings to the general population. Third, possible potential confounders such as socio-demographic variables and lifestyle, which are not available in the dataset, may lead to bias. Surrogates. Fourth, we did not compare the efficacy of the two IR surrogates in identifying NAFLD in a population without HUA, limiting the generalizability of the results.
Conclusion
This study demonstrates a significant association between the TyG and METS-IR indices and the presence of NAFLD in the HUA population. The findings establish the diagnostic value of the TyG and METS-IR indices for identifying individuals with NAFLD and also reveal dose-response relationships between these indices and the risk of NAFLD in the HUA population. Importantly, this research provides a cost-effective and practical approach to the management and prevention of NAFLD.
Data Sharing Statement
The datasets used and/or analyzed during the current study are available from the corresponding author on reasonable request.
Ethics Approval and Consent to Participate
This study was approved by the Ethics Committee of the Affiliated Hospital of Medical School, Ningbo University, (In March 2023, renamed as The First Affiliated Hospital of Ningbo University), Ningbo, China (KY20191101). Written informed consent was obtained from all participants. The protocol of the study is compliant with the Declaration of Helsinki.
Author Contributions
All authors made a significant contribution to the work reported, whether that is in the conception, study design, execution, acquisition of data, analysis and interpretation, or in all these areas; took part in drafting, revising or critically reviewing the article; gave final approval of the version to be published; have agreed on the journal to which the article has been submitted; and agree to be accountable for all aspects of the work.
Disclosure
The authors report no conflicts of interest in this work.
Acknowledgments
The authors thank the participants for their contribution to the study. In addition, the authors are especially grateful to Dr Zhongwei Zhu of Ningbo Zhenhai Lianhua Hospital for the long-term support of this study.
Additional information
Funding
References
- Younossi Z, Tacke F, Arrese M, et al. Global Perspectives on Nonalcoholic Fatty Liver Disease and Nonalcoholic Steatohepatitis. Hepatology. 2019;69(6):2672–2682. doi:10.1002/hep.30251
- Yang C, Yang S, Xu W, Zhang J, Fu W, Feng C. Association between the hyperuricemia and nonalcoholic fatty liver disease risk in a Chinese population: a retrospective cohort study. PLoS One. 2017;12(5):e0177249. doi:10.1371/journal.pone.0177249
- Zhou F, Zhou J, Wang W, et al. Unexpected rapid increase in the burden of NAFLD in China from 2008 to 2018: a Systematic review and meta-analysis. Hepatology. 2019;70(4):1119–1133. doi:10.1002/hep.30702
- Chalasani N, Younossi Z, Lavine JE, et al. The diagnosis and management of non-alcoholic fatty liver disease: practice guideline by the American Association for the Study of Liver Diseases, American College of Gastroenterology, and the American Gastroenterological Association. Hepatology. 2012;55(6):2005–2023. doi:10.1002/hep.25762
- Yang C, He Q, Chen Z, et al. A bidirectional relationship between hyperuricemia and metabolic dysfunction-associated fatty liver disease. Front Endocrinol. 2022;13:821689. doi:10.3389/fendo.2022.821689
- Duell PB, Welty FK, Miller M, et al. Nonalcoholic fatty liver disease and cardiovascular risk: a scientific statement from the American Heart Association. Arterioscler Thromb Vasc Biol. 2022;42(6):e168–e185. doi:10.1161/ATV.0000000000000153
- Hediger MA, Johnson RJ, Miyazaki H, Endou H. Molecular physiology of urate transport. Physiology. 2005;20:125–133.
- Yanai H, Adachi H, Hakoshima M, Katsuyama H. Molecular biological and clinical understanding of the pathophysiology and treatments of hyperuricemia and its association with metabolic syndrome, cardiovascular diseases and chronic kidney disease. Int J Mol Sci. 2021;22(17):9221. doi:10.3390/ijms22179221
- Helget LN, Mikuls TR. Environmental triggers of hyperuricemia and gout. Rheum Dis Clin North Am. 2022;48(4):891–906. doi:10.1016/j.rdc.2022.06.009
- Wang J, Qin T, Chen J, et al. Hyperuricemia and risk of incident hypertension: a systematic review and meta-analysis of observational studies. PLoS One. 2014;9(12):e114259. doi:10.1371/journal.pone.0114259
- Peng L-H, He Y, Xu W-D, et al. Carotid intima-media thickness in patients with hyperuricemia: a systematic review and meta-analysis. Aging Clin Exp Res. 2021;33(11):2967–2977. doi:10.1007/s40520-021-01850-x
- Li Y, Xu C, Yu C, Xu L, Miao M. Association of serum uric acid level with non-alcoholic fatty liver disease: a cross-sectional study. J Hepatol. 2009;50(5):1029–1034. doi:10.1016/j.jhep.2008.11.021
- Wan X, Xu C, Lin Y, et al. Uric acid regulates hepatic steatosis and insulin resistance through the NLRP3 inflammasome-dependent mechanism. J Hepatol. 2016;64(4):925–932. doi:10.1016/j.jhep.2015.11.022
- Choi Y-J, Shin H-S, Choi HS, et al. Uric acid induces fat accumulation via generation of endoplasmic reticulum stress and SREBP-1c activation in hepatocytes. Lab Invest. 2014;94(10):1114–1125. doi:10.1038/labinvest.2014.98
- Li X, Huang W, Gu J, et al. SREBP-1c overactivates ROS-mediated hepatic NF-κB inflammatory pathway in dairy cows with fatty liver. Cell Signal. 2015;27(10):2099–2109. doi:10.1016/j.cellsig.2015.07.011
- Xu C. Hyperuricemia and nonalcoholic fatty liver disease: from bedside to bench and back. Hepatol Internat. 2016;10(2):286–293. doi:10.1007/s12072-015-9682-5
- Wang F-S, Fan J-G, Zhang Z, Gao B, Wang H-Y. The global burden of liver disease: the major impact of China. Hepatology. 2014;60(6):2099–2108. doi:10.1002/hep.27406
- Bello-Chavolla OY, Almeda-Valdes P, Gomez-Velasco D, et al. METS-IR, a novel score to evaluate insulin sensitivity, is predictive of visceral adiposity and incident type 2 diabetes. Eur J Endocrinol. 2018;178(5):533–544. doi:10.1530/EJE-17-0883
- Simental-Mendía LE, Rodríguez-Morán M, Guerrero-Romero F. The product of fasting glucose and triglycerides as surrogate for identifying insulin resistance in apparently healthy subjects. Metab Syndr Relat Disord. 2008;6(4):299–304. doi:10.1089/met.2008.0034
- Liu XZ, Fan J, Pan SJ. METS-IR, a novel simple insulin resistance indexes, is associated with hypertension in normal-weight Chinese adults. J Clin Hypertens. 2019;21(8):1075–1081. doi:10.1111/jch.13591
- Tao L-C, J-N X, Wang -T-T, Hua F, Li -J-J. Triglyceride-glucose index as a marker in cardiovascular diseases: landscape and limitations. Cardiovasc Diabetol. 2022;21(1):68. doi:10.1186/s12933-022-01511-x
- Petrescu M, Vlaicu SI, Ciumărnean L, et al. Chronic inflammation-a link between Nonalcoholic Fatty Liver Disease (NAFLD) and dysfunctional adipose tissue. Medicina. 2022;58(5):641. doi:10.3390/medicina58050641
- Aktas G, Khalid A, Kurtkulagi O, et al. Poorly controlled hypertension is associated with elevated serum uric acid to HDL-cholesterol ratio: a cross-sectional cohort study. Postgrad Med. 2022;134(3):297–302. doi:10.1080/00325481.2022.2039007
- Kurtkulagi O, Tel BMA, Kahveci G, et al. Hashimoto’s thyroiditis is associated with elevated serum uric acid to high density lipoprotein-cholesterol ratio. Rom J Intern Med. 2021;59(4):403–408. doi:10.2478/rjim-2021-0023
- Kocak MZ, Aktas G, Erkus E, Sincer I, Atak B, Duman T. Serum uric acid to HDL-cholesterol ratio is a strong predictor of metabolic syndrome in type 2 diabetes mellitus. Rev Assoc Med Bras. 2019;65(1). doi:10.1590/1806-9282.65.1.9
- Aktas G, Kocak MZ, Bilgin S, Atak BM, Duman TT, Kurtkulagi O. Uric acid to HDL cholesterol ratio is a strong predictor of diabetic control in men with type 2 diabetes mellitus. Aging Male. 2020;23(5):1098–1102. doi:10.1080/13685538.2019.1678126
- Zhou C, Liu M, Zhang Z, et al. Positive association of serum uric acid with new-onset diabetes in Chinese women with hypertension in a retrospective analysis of the China Stroke Primary Prevention Trial. Diabetes Obes Metab. 2020;22(9):1598–1606. doi:10.1111/dom.14072
- Aktas G, Yilmaz S, Kantarci DB, et al. Is serum uric acid-to-HDL cholesterol ratio elevation associated with diabetic kidney injury? Postgrad Med. 2023;135(5):519–523. doi:10.1080/00325481.2023.2214058
- Kosekli MA, Kurtkulagii O, Kahveci G, et al. The association between serum uric acid to high density lipoprotein-cholesterol ratio and non-alcoholic fatty liver disease: the abund study. Rev Assoc Med Bras. 2021;67(4):549–554. doi:10.1590/1806-9282.20201005
- van Buuren S, Groothuis-Oudshoorn K. Mice: multivariate Imputation by Chained Equations in R. Journal of Statistical Software. 2011;45(3):1–67. doi:10.18637/jss.v045.i03
- Castera L, Friedrich-Rust M, Loomba R. Noninvasive assessment of liver disease in patients with nonalcoholic fatty liver disease. Gastroenterology. 2019;156(5):1264–1281.e4.
- Huang X, He J, Wu G, Peng Z, Yang B, Ye L. TyG-BMI and hypertension in Normoglycemia subjects in Japan: a cross-sectional study. Diab Vasc Dis Res. 2023;20(3):14791641231173617. doi:10.1177/14791641231173617
- Akin F, Altun İ, Ayca B, Kose N, Altun İ. Associations of non-HDL-C and triglyceride/HDL-C ratio with coronary plaque burden and plaque characteristics in young adults. Bosn J Basic Med Sci. 2022;22(6):1025–1032. doi:10.17305/bjbms.2022.7142
- Al Akl NS, Haoudi EN, Bensmail H, Arredouani A. The triglyceride glucose-waist-to-height ratio outperforms obesity and other triglyceride-related parameters in detecting prediabetes in normal-weight Qatari adults: a cross-sectional study. Front Public Health. 2023;11:1086771. doi:10.3389/fpubh.2023.1086771
- Zhang S, Du T, Zhang J, et al. The triglyceride and glucose index (TyG) is an effective biomarker to identify nonalcoholic fatty liver disease. Lipids Health Dis. 2017;16(1):15. doi:10.1186/s12944-017-0409-6
- Song K, Lee HW, Choi HS, et al. Comparison of the modified TyG indices and other parameters to predict non-alcoholic fatty liver disease in youth. Biology. 2022;11(5):685. doi:10.3390/biology11050685
- Smiderle CA, Coral GP, De Carli LA, Mattos AAD, Mattos AZD, Tovo CV. Performace of triglyceride-glucose index on diagnosis and staging of nafld in obese patients. Arq Gastroenterol. 2021;58(2):139–144. doi:10.1590/S0004-2803.202100000-24
- Widjaja NA, Irawan R, Hanindita MH, Ugrasena I, Handajani R. METS-IR vs. HOMA-AD and metabolic syndrome in obese adolescents. J Med Invest. 2023;70(1.2):7–16.
- Lee J-H, Park K, Lee HS, Park H-K, Han JH, Ahn SB. The usefulness of metabolic score for insulin resistance for the prediction of incident non-alcoholic fatty liver disease in Korean adults. Clin Mol Hepatol. 2022;28(4):814–826. doi:10.3350/cmh.2022.0099
- Han T, Lan L, Qu R, et al. Temporal relationship between hyperuricemia and insulin resistance and its impact on future risk of hypertension. Hypertension. 2017;70(4):703–711. doi:10.1161/HYPERTENSIONAHA.117.09508
- Mazidi M, Katsiki N, Mikhailidis DP, Banach M. The link between insulin resistance parameters and serum uric acid is mediated by adiposity. Atherosclerosis. 2018;270:180–186. doi:10.1016/j.atherosclerosis.2017.12.033
- Gastaldelli A. Insulin resistance and reduced metabolic flexibility: cause or consequence of NAFLD? Clin Sci. 2017;131(22):2701–2704. doi:10.1042/CS20170987
- Zhang M, Zhu X, Wu J, et al. Prevalence of hyperuricemia among Chinese adults: findings from two nationally representative cross-sectional surveys in 2015–16 and 2018–19. Front Immunol. 2021;12:791983. doi:10.3389/fimmu.2021.791983
- Chen Z, Qin H, Qiu S, Chen G, Chen Y. Correlation of triglyceride to high-density lipoprotein cholesterol ratio with nonalcoholic fatty liver disease among the non-obese Chinese population with normal blood lipid levels: a retrospective cohort research. Lipids Health Dis. 2019;18(1):162. doi:10.1186/s12944-019-1104-6
- Perumpail BJ, Khan MA, Yoo ER, Cholankeril G, Kim D, Ahmed A. Clinical epidemiology and disease burden of nonalcoholic fatty liver disease. World J Gastroenterol. 2017;23(47):8263–8276. doi:10.3748/wjg.v23.i47.8263
- Yen P-C, Chou Y-T, Li C-H, et al. Hyperuricemia is associated with significant liver fibrosis in subjects with nonalcoholic fatty liver disease, but not in subjects without it. J Clin Med. 2022;11(5):1445. doi:10.3390/jcm11051445