
Abstract
Purpose
The association between traditional lipid parameters and non-alcoholic fatty liver disease (NAFLD) has been extensively discussed. This study aims to evaluate and compare the lipoprotein combine index (LCI) and traditional lipid parameters [total cholesterol (TC), triglycerides (TG), low-density lipoprotein cholesterol (LDL-C), and high-density lipoprotein cholesterol (HDL-C)] to identify NAFLD.
Patients and Methods
The analysis included 14,251 participants from the NAfld in the Gifu Area, Longitudinal Analysis (NAGALA). Logistic regression models were employed to calculate standardized odds ratios (ORs) and 95% confidence intervals (CIs) for assessing and comparing the association of LCI and traditional lipid parameters with NAFLD. Additionally, receiver operating characteristic (ROC) curves were used to calculate the area under the curve (AUC) for LCI and traditional lipid parameters in identifying NAFLD.
Results
After adjusting for various confounders, we found that LCI was positively associated with NAFLD (OR=2.25, 95% CI 1.92–2.63), and this association was stronger than that of traditional lipid parameters [OR: TC1.23, TG1.73 LDL-C1.10]. Further subgroup analyses revealed that the association of LCI with NAFLD was stronger than other traditional lipid parameters in all subgroups, including men and women, overweight/obese [body mass index (BMI)≥25 kg/m2] and non-obese (BMI<25 kg/m2), and older (age≥45 years) and younger (age<45 years) participants. Additionally, ROC analysis indicated that LCI (AUC=0.8118) had significantly higher accuracy (All DeLong P<0.05) in identifying NAFLD compared to traditional lipid parameters (AUC: TC0.6309; TG0.7969; LDL-C0.6941); HDL-C0.7587). Sensitivity analysis further confirmed the robustness of the study findings.
Conclusion
This study revealed for the first time a positive correlation between LCI and NAFLD. Compared to traditional lipid parameters, LCI has a higher correlation with NAFLD. Additionally, further ROC analysis demonstrated that LCI had higher accuracy in identifying NAFLD compared to traditional lipid parameters, suggesting that LCI may be a better marker for NAFLD identification than traditional lipid parameters.
Introduction
In recent years, with the global prevalence of obesity, NAFLD has evolved into the most common chronic liver disease.Citation1,Citation2 NAFLD is estimated to affect approximately 30% of the global population, with this figure continuing to rise.Citation3,Citation4 Currently, there are no clinically approved medications specifically for treating NAFLD; However, compelling evidence suggests that changes in diet and lifestyle can effectively prevent NAFLD.Citation5,Citation6 Therefore, in the current context, early identification of effective NAFLD screening tools and the implementation of prevention and treatment measures in high-risk populations is crucial in controlling the disease burden of NAFLD.Citation7
It is well-known that dyslipidemia is closely related to NAFLD and is a central driving factor in its development.Citation8,Citation9 Previous studies have shown that elevated levels of TC, TG, LDL-C, and a reduction in HDL-C are associated with NAFLD.Citation10–16 Importantly, a single lipid parameter cannot fully reflect the body’s lipid metabolism status,Citation17,Citation18 and utilizing a combination of various lipid parameters could provide a more comprehensive assessment of lipid status, thereby improving the accuracy of NAFLD identification. In recent years, researchers have focused on a composite lipid index, the LCI, calculated using traditional lipid parameters (LCI=TC*TG*LDL-C/HDL-C, unit: mmol/L). Completed studies have shown that LCI can effectively identify and predict the risk of atherosclerosis and cardiovascular diseases.Citation19–22 In fact, as a comprehensive indicator for lipid profile assessment, the various components of the LCI are highly correlated with NAFLD.Citation8,Citation23 Compared to traditional single lipid markers, the LCI may better reflect the multidimensional lipid metabolism abnormalities associated with the development of NAFLD.Citation24 However, no studies have evaluated the value of LCI in identifying NAFLD, and it remains unclear whether LCI is superior to traditional lipid parameters in identifying NAFLD. Therefore, the current study aims to evaluate and compare the ability of LCI and traditional lipid parameters to assess/identify NAFLD through a secondary analysis of data from 14,251 participants in the NAGALA project undergoing health screenings.
Materials and Methods
Data Source
This study analyzed data from the NAGALA project, involving a general population of 20,944 individuals who underwent health screenings between 1994 and 2016. Professor Okamura et al have previously detailed the study design and shared the raw data on the DRYAD database.Citation25 Funded by the American National Science Foundation since 2008, the DRYAD database contains a wealth of high-quality data resources, available for researchers to reuse upon citation for new scientific evidence exploration. The original data for this study were obtained from this online database.Citation25
Study Population
Participants in this study were from the NAGALA project. Briefly, the NAGALA project, initiated at the Murakami Memorial Hospital from 1994 to 2016, involved questionnaire surveys, general physical measurements, blood tests, and abdominal ultrasound among recruited participants, aiming to investigate the risk factors of common chronic diseases such as NAFLD and diabetes.
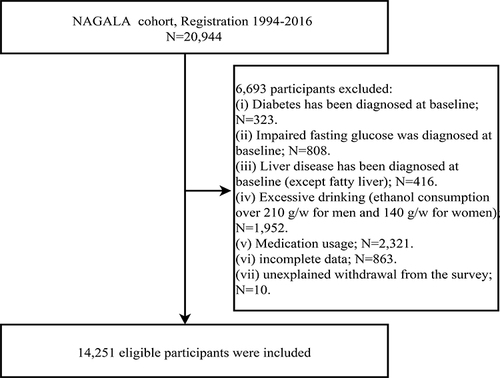
The original data extracted from the DRYAD online database included health examination data of 20,944 participants in the NAGALA project from 1994 to 2016. Among these participants, we excluded those with missing data and dropouts (n=873), diabetes (n=323), fasting plasma glucose (FPG) >6.1mmol/L (n=808), viral or alcoholic liver disease (n=416), excessive alcohol consumption (men: ≥210g/week; women: ≥140g/week)Citation26 (n=1952), and medication usage (n=2321). Finally, 14,251 participants were included in this study ().
Figure 1 Flow chart for inclusion and exclusion of study participants.
Ethical Approval and Consent to Participate
In previous studies, the Ethics Committee of Murakami Memorial Hospital in Gifu, Japan, approved the implementation of the NAGALA project and obtained informed consent for the use of participant data, adhering to the Declaration of Helsinki principles. The current study, a secondary analysis based on the NAGALA project data, received approval from the Ethics Committee of Jiangxi Provincial People’s Hospital, exempting the requirement for repeated informed consent from subjects (Institutional review number: 2021–066).
Baseline Data Collection
The detailed data collection and measurement specifics have been previously described.Citation25 All participants consented to the NAGALA project and underwent initial baseline information assessment. Baseline assessment and recording were conducted by trained physicians and nurses: (1) Participants’ demographics (sex and age), lifestyle (smoking and drinking status, and exercise habits), medical history, and medication use were recorded through standardized questionnaires; (2) The physical measurements of the participants (height, weight, and blood pressure) were obtained using standardized methods. Based on their height and weight, the BMI of the participants was calculated; (3) Overnight fasting venous blood samples were analyzed using automatic analyzers to obtain laboratory test data [alanine aminotransferase (ALT), aspartate aminotransferase (AST), gamma-glutamyl transferase (GGT), HDL-C, TC, TG, hemoglobin A1c (HBA1c), and FPG]; (4) The abdominal ultrasound images of the subjects were acquired and archived through ultrasonographic examination; (5) LDL-C was calculated using the Friedewald formula based on quantified TC, HDL-C, and TG.Citation27
Definitions
Participants were categorized into three groups based on smoking history: non-smokers, past smokers, and current smokers. Based on the average weekly alcohol intake in the past month, participants were divided into three groups: non/small-drinkers (<40g/week), moderate drinkers (40–139g/week), and heavy drinkers (140–209g/week).Citation26,Citation28 Physical activity was assessed based on questionnaire data,Citation29 categorizing participants into two groups: those with exercise habits (regular exercise more than once a week) and those without (regular exercise less than once a week).Citation30
Diagnosis of NAFLD
In this study, experienced gastroenterologists diagnosed NAFLD in participants. Specifically, NAFLD was diagnosed based on four ultrasonographic features without referring to the participants’ medical records: deep attenuation, hepatorenal echo contrast, liver brightness, and vascular blurring.Citation31
Statistical Analysis
Initially, baseline differences between the NAFLD and Non-NAFLD groups were described, with sample characteristics reported as mean (standard deviation) for normally distributed continuous variables, median (interquartile range) for non-normally distributed continuous variables, and frequency (%) for categorical variables. Before statistical analysis, continuous variables with skewed distribution underwent BOX-COX normal transformation.Citation32,Citation33 Marginal structural models were used to calculate standardized differences to quantify the size of differences between groups, with a standardized difference >10% considered statistically significant.Citation34,Citation35
Prior to multiple regression analysis, variance inflation factor was used to assess collinearity among variables,Citation36 with the detailed collinearity screening process shown in Supplementary Tables 1–5. Furthermore, Z scores were used for normalization of each parameter, facilitating comparison of OR for each standard deviation increase. According to the Strengthening the Reporting of OBservational studies in Epidemiology statement,Citation37 we fitted four progressively adjusted statistical models to examine the association of LCI and traditional lipid parameters with NAFLD. Model 1 adjusted for age and sex; Model 2 additionally adjusted for height, BMI, exercise habits, smoking status, drinking status, and other general physical and lifestyle-related factors; Model 3 further adjusted for liver function indicators such as ALT, AST, GGT; Model 4, the final model, further adjusted for all non-collinear variables including systolic blood pressure, FPG, HbA1c, and other lipid parameters. Restricted cubic splines were used to plot the dose-response relationship curve of LCI and NAFLD prevalence.
To test the robustness and potential variability of the analysis results in different subgroups, stratified analyses were conducted by baseline sex, age (<45 years and ≥45 years), and BMI (<25 kg/m2 and ≥25 kg/m2), in line with World Health Organization recommendations for categorizing middle-aged and elderlyCitation38 and overweight/obesity.Citation39 The corresponding interaction terms were tested using a likelihood ratio test. To reduce potential residual confounding due to effect modifiers, the adjusted models further adjusted for interaction terms between effect modifiers and covariates and calculated p for interaction to estimate the significance of the modifying effects.
Based on the association analysis, we further assessed the diagnostic value of LCI and traditional lipid parameters for NAFLD through ROC analysis, comparing the AUC values of LCI and traditional lipid parameters using the DeLong test.Citation40
Several sensitivity analyses were also conducted to test the robustness of the study findings. Firstly, considering the impact of alcohol on NAFLD, participants with a history of alcohol consumption (n=2446) were excluded. Secondly, participants with elevated blood pressure at baseline were excluded, considering the effect of hypertension on lipid parameters and NAFLD. Lastly, considering the potential non-linear relationship between age and NAFLD, a quadratic term for age was added in Model 4.Citation41,Citation42
All data processing and statistical analyses were completed using R language version 4.2.1 and Empower(R) version 2.0. A two-sided P-value <0.05 was considered statistically significant.
Results
Baseline Characteristics
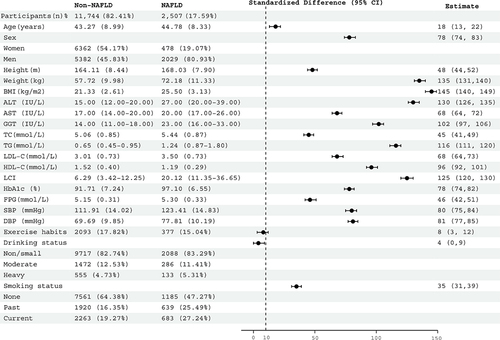
Among the 14,251 participants (average age 43.5 years; 48% female), 2507 individuals (17.59%) were diagnosed with NAFLD. The standardized difference forest plot in visually displays baseline characteristics of subjects in the NAFLD and non-NAFLD groups. Specifically, those with NAFLD tended to be older, taller, heavier, more likely to be obese, male, and smokers, and often had higher liver enzyme levels. Furthermore, these patients appeared to have higher blood sugar (FPG and HbA1c), blood pressure, and lipid levels (TC, TG, and LDL-C), while HDL-C levels were typically lower. It is noteworthy that there was a considerable difference in LCI between the two groups, with a standardized difference (125%) higher than that of traditional lipid parameters. This provided valuable information that LCI might be a more closely related marker to NAFLD compared to traditional lipid parameters.
Figure 2 Forest plot of standardized differences in baseline characteristics of subjects in the NAFLD group and non-NAFLD group.
Association of LCI and Traditional Lipid Parameters with NAFLD
The Results of the association analysis of LCI and traditional lipid parameters with NAFLD are shown in . In the age and sex-adjusted model (Model 1), LCI, TC, TG, and LDL-C were positively associated with NAFLD, while HDL-C was negatively associated with NAFLD. Further adjustment for demographics, general physical measurements, lifestyle, liver enzymes, blood sugar, blood pressure, and other lipid parameters did not alter these results (Models 2–4). Overall, LCI showed the highest association with NAFLD [Model 4: 2.25 (1.92, 2.63)], followed by TG [Model 4: 1.73 (1.60, 1.88)] and TC [Model 4: 1.23 (1.16, 1.31)], with LDL-C being the lowest [Model 4: 1.10 (1.04, 1.18)]. Additionally, an increase in HDL-C was negatively correlated with NAFLD [Model 4: 0.75 (0.69, 0.82)].
Table 1 Logistic Regression Analyses for the Association Between LCI, TC, TG, LDL-C, HDL-C and NAFLD in Different Models
Dose-Response Relationship Between LCI and NAFLD Prevalence
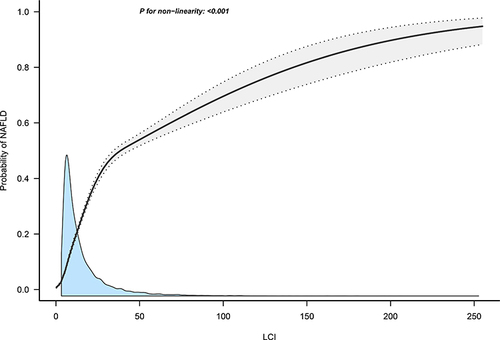
shows the dose-response relationship curve between LCI and NAFLD prevalence; there was a non-linear positive correlation, with NAFLD prevalence gradually increasing as LCI rises. This finding further validated the results of the association analysis.
Figure 3 Apply the 4-knots RCS model to fit the dose-response curve of LCI with NAFLD.
Subgroup Analysis
The results of subgroup analysis, stratified by sex, age, and BMI, were presented in and . The results indicated that in all subgroups, the association of LCI with NAFLD was stronger than that of other traditional lipid parameters (TC, TG, and LDL-C).
Table 2 Logistic Regression Analyses for the Association Between LCI, TC, TG, LDL-C, HDL-C and Incident NAFLD Grouped by Sex, Age and BMI
Figure 4 Association of LCI, TC, TG, LDL-C, HDL-C with NAFLD grouped by sex, age and BMI.
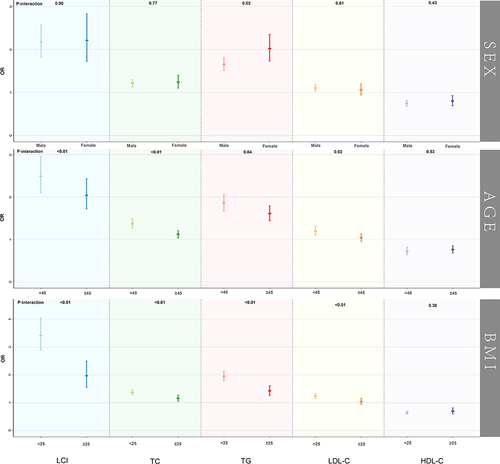
We also found that the correlation between TG and NAFLD was higher in female participants than in males in the subgroups by sex (P for interaction=0.02). However, there were no significant sex differences in the association of LCI and other lipid parameters with NAFLD (All P for interaction >0.05). Moreover, in stratified analyses by age and BMI, significant differences in the association of LCI and other lipid parameters with NAFLD were observed in different age and BMI groups (All P for interaction <0.05), except for HDL-C. Specifically, the associations of LCI, TC, TG, and LDL-C with NAFLD were more significant in younger (<45 years) and non-obese (<25 kg/m2) participants compared to older (≥45 years) and overweight/obese (≥25 kg/m2) participants.
ROC Analysis
The ROC analysis of LCI and traditional lipid parameters for identifying NAFLD, including the best threshold, sensitivity, and specificity, is shown in . The results demonstrated that LCI had the highest accuracy in identifying NAFLD (AUC=0.8118), followed by TG (AUC=0.7969), HDL-C (AUC=0.7587), and LDL-C (AUC=0.6941), with TC having the lowest accuracy (AUC=0.6309). Further Delong tests confirmed the significance of these differences (All Delong P<0.05).
Table 3 Areas Under the Receiver Operating Characteristic Curves, 95% CI, Best Threshold, Sensitivity and Specificity for LCI, TC, TG, LDL-C and HDL-C Identifies NAFLD
Sensitivity Analysis
In the sensitivity analyses (), the associations of LCI and traditional lipid parameters with NAFLD remained unchanged when participants with a history of drinking were excluded. Additionally, the results remained essentially the same after excluding participants with elevated blood pressure at baseline. Lastly, when adjusting for the quadratic term of age, the results were still similar.
Table 4 Adjusted Odd Ratios and 95% Confidence Intervals for NAFLD Risk Associated with the Lipid Parameters in Different Test Populations: Sensitivity Analysis
Discussion
To our knowledge, this is the first study to report the association between the LCI and NAFLD. In this cross-sectional survey of a healthy screening population, we found that a higher LCI was associated with NAFLD, and this association was stronger than that with traditional lipid parameters. Further stratification and sensitivity analyses also confirm the robustness of our study results. Moreover, the results of the ROC analysis showed that LCI had higher accuracy in identifying NAFLD than traditional lipid parameters (All Delong P-value < 0.05). These findings suggested that LCI might be a better marker for NAFLD identification than traditional lipid parameters.
NAFLD, due to its high prevalence and wide-ranging health impacts, is of significant concern. The pathogenesis of NAFLD is complex, and there are currently no effective treatment drugs available.Citation43 Actively seeking simple and effective risk screening tools and early intervention is central to the prevention of NAFLD. It is well-known that dyslipidemia is an independent risk factor for NAFLD. As a modifiable risk factor closely related to the development of NAFLD, the role of dyslipidemia in NAFLD has attracted wide attention. Numerous studies have indicated that lipid parameters (including TC, TG, LDL-C, and HDL-C) participate in the onset and development of NAFLD through various mechanisms.Citation17,Citation18,Citation44–46 It has been reported that about 20–80% of NAFLD patients have dyslipidemia,Citation47 mainly characterized by low HDL-C and high TG, TC, and LDL-C.Citation12,Citation13 Several observational studies have also confirmed the association of traditional lipid parameters with NAFLD, most of which supported a significant correlation between higher levels of TC, TG, LDL-C, and lower levels of HDL-C with increased NAFLD risk.Citation10,Citation14,Citation48–51 However, some studies have presented different views, such as a study in the REACTION cohort in Shandong, China,Citation52 where Cox regression analysis indicated that TG was positively correlated and HDL-C negatively correlated with NAFLD, while TC and LDL-C showed no significant association. Another study from Shanghai, China, suggested that TG and LDL-C were risk factors for NAFLD, while TC and HDL-C were protective.Citation53 The differences in study results could be due to variations in study population characteristics (race and region), study design (longitudinal and cross-sectional), data collection methods (questionnaires and different measuring instruments), and statistical methods (such as covariate adjustment). In our study, using health examination data from a general population, we arrived at results consistent with most previous studies, confirming the association between traditional lipid parameters and NAFLD. Furthermore, the ROC analysis results also confirmed the diagnostic value of TC, TG, LDL-C, and HDL-C for NAFLD. However, given that a single lipid parameter does not fully reflect the body’s lipid metabolism, the LCI, calculated based on traditional lipid parameters, might perform better in identifying NAFLD.
LCI, as a comprehensive lipid parameter, has received widespread attention in recent years. Several studies have demonstrated its value in identifying and predicting cardiovascular and cerebrovascular diseases. Previous observational studies have indicated that LCI was an independent predictor of coronary artery disease severity and progression;Citation20–22,Citation54,Citation55 additionally, in recent reports by Yu et al, LCI was also found to effectively predict atherosclerotic stenosis in both intracranial and extracranial arteries.Citation19 However, no studies have yet evaluated the association between LCI and NAFLD. In our current study, using health examination data from a general population, we compared the association of LCI and traditional lipid parameters with NAFLD and assessed their diagnostic abilities using ROC curves. The results showed that, apart from HDL-C, which was negatively correlated with NAFLD, LCI and other lipid parameters (TC, TG, and LDL-C) were positively correlated with NAFLD. The normalized OR values indicated a stronger association of LCI with NAFLD compared to other traditional lipid parameters. The results of the ROC analysis and Delong test provided further evidence that LCI was superior in identifying NAFLD compared to traditional lipid parameters. These results collectively suggested that LCI might be a better screening tool for NAFLD than traditional lipid parameters.
The mechanisms underlying the association between LCI and NAFLD are not yet clear. In fact, LCI is calculated using traditional lipid parameters, and some possible biological mechanisms can be explained through lipid metabolism abnormalities represented by these parameters. The liver, as the most important lipid metabolism organ, is the central regulator of lipid homeostasisCitation17 and plays a crucial role in lipoprotein and cholesterol metabolism, participating in the production and clearance of all classes of lipoprotein particles and being the primary site of cholesterol metabolism.Citation56 Previous studies have shown that de novo lipogenesis is considered a key driver of NAFLD, a process that can increase TG synthesis and reduce fatty acid breakdown metabolism, favoring the accumulation of fat in the liver and also driving the production of very LDL-TG, leading to abnormal lipid levels in the blood.Citation57 Furthermore, low-density lipoprotein receptor-related protein 1 helps the liver remove low-density lipoprotein particles from circulation, and evidence from animal models shows that mice deficient in low-density lipoprotein receptor-related protein 1 exhibited significantly elevated liver cholesterol and an accelerated trend in NAFLD development.Citation58
Recent years have seen rapid advancements in NAFLD research, with significant progress in understanding its pathogenesis, treatment drugs, and risk screening. However, significant and unresolved challenges remain.Citation43 Currently, liver biopsy remains the gold standard for diagnosing NAFLD, but its invasive nature limits its application, while non-invasive diagnostic methods are widely accepted for clinical practice due to their simplicity and convenience.Citation59 Considering the widespread impact of NAFLD globally, early screening and intervention in high-risk populations should be emphasized. Exploring more accurate and convenient tools for NAFLD screening is of great importance in the current context. In our current study, we validated the identification ability of traditional lipid parameters and the composite parameter LCI for NAFLD, and the study results also confirmed its higher accuracy in identifying NAFLD compared to traditional lipid parameters. Therefore, we believe that LCI might be an ideal screening tool. Compared to traditional lipid parameters, LCI is a more accurate, accessible, and cost-effective tool, as it significantly increases diagnostic accuracy without additional medical costs. For economically and medically underdeveloped countries and regions, these findings may have particular importance.
The main strength of this study is the first-time assessment of the association between LCI and NAFLD and the diagnostic capability of LCI for NAFLD in a large sample size, further validated by subgroup analysis and multiple sensitivity analyses. However, our study has some limitations. Firstly, this is a cross-sectional study, and due to data limitations, we cannot assess the predictive ability of LCI for future NAFLD. Secondly, the current study is a secondary analysis based on the Japanese population, and the applicability of research evidence to other races needs further investigation. Thirdly, in the current study, NAFLD was assessed based on ultrasound results, which compared to liver biopsy may miss some patients with mild hepatic steatosis; In addition, the association between LCI and NAFLD severity could not be further assessed in the current study because we were unable to update the publicly available data. Lastly, although we adjusted for all possible confounders in the current dataset, there might still be some residual confounding due to the inherent limitations of observational studies.
Conclusion
In this study, we evaluated for the first time the association between LCI and NAFLD, and this association was stronger than with traditional lipid parameters. Furthermore, LCI demonstrated higher accuracy in identifying NAFLD compared to traditional lipid parameters; these findings suggested that LCI might be a better marker for NAFLD identification than traditional lipid parameters.
Abbreviations
NAFLD, non-alcoholic fatty liver disease; LCI, lipoprotein combine index; ALT, alanine aminotransferase; AST, aspartate aminotransferase; GGT, gamma-glutamyl transferase; HDL-C, high-density lipoprotein cholesterol; TC, total cholesterol; TG, triglyceride; LDL-C, low-density lipoprotein cholesterol; HbA1c, glycated hemoglobin A1c; FPG, fasting plasma glucose; ROC, receiver operating characteristic; CI, confidence interval; AUC, area under the curves; OR, odds ratios; BMI, body mass index.
Ethics Approval and Informed Consent
In previous studies, the Ethics Committee of Murakami Memorial Hospital in Gifu, Japan, approved the implementation of the NAGALA project and obtained informed consent for the use of participant data, adhering to the Declaration of Helsinki principles. The current study, a secondary analysis based on the NAGALA project data, received approval from the Ethics Committee of Jiangxi Provincial People’s Hospital, exempting the requirement for repeated informed consent from subjects.
Author Contributions
All authors made a significant contribution to the work reported, whether that is in the conception, study design, execution, acquisition of data, analysis and interpretation, or in all these areas; all authors took part in drafting, revising or critically reviewing the article, gave final approval of the version to be published, have agreed on the Diabetes, Metabolic Syndrome and Obesity journal to which the article has been submitted, and agree to be accountable for all aspects of the work.
Disclosure
The authors report no conflicts of interest in this work.
Acknowledgments
We would like to thank Professor Okamura and his team members for their great efforts in collecting and organizing research data.
Data Sharing Statement
The data used in this study have been uploaded to the “Dryad” database (https://datadryad.org/stash/dataset/doi:10.5061/dryad.8q0p192).
Additional information
Funding
References
- Powell EE, Wong VW, Rinella M. Non-alcoholic fatty liver disease. Lancet. 2021;397:2212–2224. doi:10.1016/S0140-6736(20)32511-3
- Maurice J, Manousou P. Non-alcoholic fatty liver disease. Clin Med Lond. 2018;18:245–250. doi:10.7861/clinmedicine.18-3-245
- Le MH, Le DM, Baez TC, et al. Global incidence of non-alcoholic fatty liver disease: a systematic review and meta-analysis of 63 studies and 1,201,807 persons. J Hepatol. 2023;79:287–295. doi:10.1016/j.jhep.2023.03.040
- Younossi ZM. Non-alcoholic fatty liver disease – a global public health perspective. J Hepatol. 2019;70(3):531–544. doi:10.1016/j.jhep.2018.10.033
- Romero-Gómez M, Zelber-Sagi S, Trenell M. Treatment of NAFLD with diet, physical activity and exercise. J Hepatol. 2017;67:829–846. doi:10.1016/j.jhep.2017.05.016
- Nseir W, Hellou E, Assy N. Role of diet and lifestyle changes in nonalcoholic fatty liver disease. World J Gastroenterol. 2014;20:9338–9344. doi:10.3748/wjg.v20.i28.9338
- Rinella ME. Nonalcoholic fatty liver disease: a systematic review. JAMA. 2015;313:2263–2273. doi:10.1001/jama.2015.5370
- Katsiki N, Mikhailidis DP, Mantzoros CS. Non-alcoholic fatty liver disease and dyslipidemia: an update. Metabolism. 2016;65:1109–1123. doi:10.1016/j.metabol.2016.05.003
- Eslam M, Sanyal AJ, George J, et al. MAFLD: a consensus-driven proposed nomenclature for metabolic associated fatty liver disease. Gastroenterology. 2020;158:1999–2014.e1. doi:10.1053/j.gastro.2019.11.312
- Speliotes EK, Massaro JM, Hoffmann U, et al. Fatty liver is associated with dyslipidemia and dysglycemia independent of visceral fat: the Framingham heart study. Hepatology. 2010;51:1979–1987. doi:10.1002/hep.23593
- Sheng G, Liu D, Kuang M, et al. Utility of non-high-density lipoprotein cholesterol to high-density lipoprotein cholesterol ratio in evaluating incident diabetes risk. Diabetes Metab Syndr Obes. 2022;15:1677–1686. doi:10.2147/DMSO.S355980
- Chatrath H, Vuppalanchi R, Chalasani N. Dyslipidemia in patients with nonalcoholic fatty liver disease. Semin Liver Dis. 2012;32:22–29. doi:10.1055/s-0032-1306423
- Cohen DE, Fisher EA. Lipoprotein metabolism, dyslipidemia, and nonalcoholic fatty liver disease. Semin Liver Dis. 2013;33:380–388. doi:10.1055/s-0033-1358519
- Peng K, Mo Z, Tian G. Serum lipid abnormalities and nonalcoholic fatty liver disease in adult males. Am J Med Sci. 2017;353:236–241. doi:10.1016/j.amjms.2017.01.002
- Zhang QQ, Lu LG. Nonalcoholic fatty liver disease: dyslipidemia, risk for cardiovascular complications, and treatment strategy. J Clin Transl Hepatol. 2015;3:78–84. doi:10.14218/JCTH.2014.00037
- Gaggini M, Morelli M, Buzzigoli E, et al. Non-alcoholic fatty liver disease (NAFLD) and its connection with insulin resistance, dyslipidemia, atherosclerosis and coronary heart disease. Nutrients. 2013;5:1544–1560. doi:10.3390/nu5051544
- Ipsen DH, Lykkesfeldt J, Tveden-Nyborg P. Molecular mechanisms of hepatic lipid accumulation in non-alcoholic fatty liver disease. Cell Mol Life Sci. 2018;75:3313–3327. doi:10.1007/s00018-018-2860-6
- Jones JG. Hepatic glucose and lipid metabolism. Diabetologia. 2016;59:1098–1103. doi:10.1007/s00125-016-3940-5
- Yu S, Yan L, Yan J, et al. The predictive value of nontraditional lipid parameters for intracranial and extracranial atherosclerotic stenosis: a hospital-based observational study in China. Lipids Health Dis. 2023;22:16. doi:10.1186/s12944-022-01761-4
- Li Y, Feng Y, Li S, et al. The atherogenic index of plasma (AIP) is a predictor for the severity of coronary artery disease. Front Cardiovasc Med. 2023;10:1140215. doi:10.3389/fcvm.2023.1140215
- Çelik E, Çora AR, Karadem KB. The effect of untraditional lipid parameters in the development of coronary artery disease: atherogenic index of plasma, atherogenic coefficient and lipoprotein combined index. J Saudi Heart Assoc. 2021;33:244–250. doi:10.37616/2212-5043.1266
- Cai G, Shi G, Xue S, et al. The atherogenic index of plasma is a strong and independent predictor for coronary artery disease in the Chinese Han population. Medicine. 2017;96:e8058. doi:10.1097/MD.0000000000008058
- Svegliati-Baroni G, Pierantonelli I, Torquato P, et al. Lipidomic biomarkers and mechanisms of lipotoxicity in non-alcoholic fatty liver disease. Free Radic Biol Med. 2019;144:293–309. doi:10.1016/j.freeradbiomed.2019.05.029
- Musso G, Cassader M, Paschetta E, et al. Bioactive lipid species and metabolic pathways in progression and resolution of nonalcoholic steatohepatitis. Gastroenterology. 2018;155:282–302.e8. doi:10.1053/j.gastro.2018.06.031
- Okamura T, Hashimoto Y, Hamaguchi M, et al. Ectopic fat obesity presents the greatest risk for incident type 2 diabetes: a population-based longitudinal study. Int J Obes Lond. 2019;43:139–148. doi:10.1038/s41366-018-0076-3
- Choi JH, Sohn W, Cho YK. The effect of moderate alcohol drinking in nonalcoholic fatty liver disease. Clin Mol Hepatol. 2020;26:662–669. doi:10.3350/cmh.2020.0163
- Friedewald WT, Levy RI, Fredrickson DS. Estimation of the concentration of low-density lipoprotein cholesterol in plasma, without use of the preparative ultracentrifuge. Clin Chem. 1972;18:499–502. doi:10.1093/clinchem/18.6.499
- Hashimoto Y, Hamaguchi M, Kojima T, et al. Modest alcohol consumption reduces the incidence of fatty liver in men: a population-based large-scale cohort study. J Gastroenterol Hepatol. 2015;30:546–552. doi:10.1111/jgh.12786
- Aaron DJ, Kriska AM, Dearwater SR, et al. Reproducibility and validity of an epidemiologic questionnaire to assess past year physical activity in adolescents. Am J Epidemiol. 1995;142:191–201. doi:10.1093/oxfordjournals.aje.a117618
- Ryu S, Chang Y, Kim DI, et al. gamma-Glutamyltransferase as a predictor of chronic kidney disease in nonhypertensive and nondiabetic Korean men. Clin Chem. 2007;53:71–77. doi:10.1373/clinchem.2006.078980
- Hamaguchi M, Kojima T, Itoh Y, et al. The severity of ultrasonographic findings in nonalcoholic fatty liver disease reflects the metabolic syndrome and visceral fat accumulation. Am J Gastroenterol. 2007;102:2708–2715. doi:10.1111/j.1572-0241.2007.01526.x
- Box GEP, Cox DR. An analysis of transformations. J Royal Statist Soc Seri. 1964;26:211–243. doi:10.1111/j.2517-6161.1964.tb00553.x
- Yu H, Sang P, Huan T. Adaptive box-cox transformation: a highly flexible feature-specific data transformation to improve metabolomic data normality for better statistical analysis. Anal Chem. 2022;94:8267–8276. doi:10.1021/acs.analchem.2c00503
- Sato T, Matsuyama Y. Marginal structural models as a tool for standardization. Epidemiology. 2003;14:680–686. doi:10.1097/01.EDE.0000081989.82616.7d
- Muanda FT, Weir MA, Bathini L, et al. Association of baclofen with encephalopathy in patients with chronic kidney disease. JAMA. 2019;322:1987–1995. doi:10.1001/jama.2019.17725
- Kim JH. Multicollinearity and misleading statistical results. Korean J Anesthesiol. 2019;72:558–569. doi:10.4097/kja.19087
- Fitchett EJA, Seale AC, Vergnano S, et al. Strengthening the reporting of observational studies in epidemiology for newborn infection (STROBE-NI): an extension of the STROBE statement for neonatal infection research. Lancet Infect Dis. 2016;16:e202–e213. doi:10.1016/S1473-3099(16)30082-2
- Dyussenbayev A. Age periods of human life. Adv Social Sci Res J. 2017;4. doi:10.14738/assrj.46.2924
- WHO Expert Consultation. Appropriate body-mass index for Asian populations and its implications for policy and intervention strategies. Lancet. 2004;363:157–163. doi:10.1016/S0140-6736(03)15268-3
- DeLong ER, DeLong DM, Clarke-Pearson DL. Comparing the areas under two or more correlated receiver operating characteristic curves: a nonparametric approach. Biometrics. 1988;44:837–845. doi:10.2307/2531595
- Yeh TS, Yuan C, Ascherio A, et al. Long-term dietary flavonoid intake and subjective cognitive decline in US men and women. Neurology. 2021;97:e1041–e1056. doi:10.1212/WNL.0000000000012454
- Zhang YB, Chen C, Pan XF, et al. Associations of healthy lifestyle and socioeconomic status with mortality and incident cardiovascular disease: two prospective cohort studies. BMJ. 2021;373:n604. doi:10.1136/bmj.n604
- Friedman SL, Neuschwander-Tetri BA, Rinella M, et al. Mechanisms of NAFLD development and therapeutic strategies. Nat Med. 2018;24:908–922. doi:10.1038/s41591-018-0104-9
- Östlund C, Hernandez-Ono A, Shin JY. The nuclear envelope in lipid metabolism and pathogenesis of NAFLD. Biology. 2020;9:338. doi:10.3390/biology9100338
- Mungamuri SK, Sinha SN, Javvadi Y. Understanding the alterations in lipid metabolism in NAFLD progression: current trends and future directions. Crit Rev Oncog. 2021;26:35–49. doi:10.1615/CritRevOncog.2020035839
- Martin A, Lang S, Goeser T, et al. Management of dyslipidemia in patients with non-alcoholic fatty liver disease. Curr Atheroscler Rep. 2022;24:533–546. doi:10.1007/s11883-022-01028-4
- Souza MR, Diniz Mde F, Medeiros-Filho JE, et al. Metabolic syndrome and risk factors for non-alcoholic fatty liver disease. Arq Gastroenterol. 2012;49:89–96. doi:10.1590/s0004-28032012000100015
- Cho HC. Prevalence and factors associated with nonalcoholic fatty liver disease in a nonobese Korean population. Gut Liver. 2016;10:117–125. doi:10.5009/gnl14444
- Tang Z, Pham M, Hao Y, et al. Sex, Age, and BMI modulate the association of physical examinations and blood biochemistry parameters and NAFLD: a retrospective study on 1994 cases observed at Shuguang hospital, China. Biomed Res Int. 2019;2019:1246518. doi:10.1155/2019/1246518
- Li Q, Zhang X, Zhang C, et al. Risk factors and prediction models for nonalcoholic fatty liver disease based on random forest. Comput Math Methods Med. 2022;2022:8793659. doi:10.1155/2022/8793659
- Ren XY, Shi D, Ding J, et al. Total cholesterol to high-density lipoprotein cholesterol ratio is a significant predictor of nonalcoholic fatty liver: jinchang cohort study. Lipids Health Dis. 2019;18:47. doi:10.1186/s12944-019-0984-9
- Cheng Y, Zhang Q, Li H, et al. Remnant cholesterol, stronger than triglycerides, is associated with incident non-alcoholic fatty liver disease. Front Endocrinol. 2023;14:1098078. doi:10.3389/fendo.2023.1098078
- Wang G, Shen X, Wang Y, et al. Analysis of risk factors related to nonalcoholic fatty liver disease: a retrospective study based on 31,718 adult Chinese individuals. Front Med Lausanne. 2023;10:1168499. doi:10.3389/fmed.2023.1168499
- Mahdavi-Roshan M, Mozafarihashjin M, Shoaibinobarian N, et al. Evaluating the use of novel atherogenicity indices and insulin resistance surrogate markers in predicting the risk of coronary artery disease: a case‒control investigation with comparison to traditional biomarkers. Lipids Health Dis. 2022;21:126. doi:10.1186/s12944-022-01732-9
- Wu TT, Gao Y, Zheng YY, et al. Atherogenic index of plasma (AIP): a novel predictive indicator for the coronary artery disease in postmenopausal women. Lipids Health Dis. 2018;17:197. doi:10.1186/s12944-018-0828-z
- Deprince A, Haas JT, Staels B. Dysregulated lipid metabolism links NAFLD to cardiovascular disease. Mol Metab. 2020;42:101092. doi:10.1016/j.molmet.2020.101092
- Lambert JE, Ramos-Roman MA, Browning JD, et al. Increased de novo lipogenesis is a distinct characteristic of individuals with nonalcoholic fatty liver disease. Gastroenterology. 2014;146:726–735. doi:10.1053/j.gastro.2013.11.049
- Hamlin AN, Chinnarasu S, Ding Y, et al. Low-density lipoprotein receptor-related protein-1 dysfunction synergizes with dietary cholesterol to accelerate steatohepatitis progression. J Biol Chem. 2018;293:9674–9684. doi:10.1074/jbc.RA118.001952
- Zhou JH, Cai JJ, She ZG, et al. Noninvasive evaluation of nonalcoholic fatty liver disease: current evidence and practice. World J Gastroenterol. 2019;25:1307–1326. doi:10.3748/wjg.v25.i11.1307