
Abstract
Background
Metabolic syndrome in childhood predicts the development of cardiovascular disease and type 2 diabetes (T2D) in adulthood. Testing for features of metabolic syndrome, such as fasting plasma glucose concentration, requires blood sampling which can be difficult in children. Here we evaluated salivary glucose concentration as a surrogate measurement for plasma glucose concentration in 11-year-old US children.
Methods
Children from Portland, Maine, and Cambridge, Massachusetts, with a mean age of 10.6±0.2 years provided 6-hour fasting samples of both blood and whole saliva. Salivary glucose levels were measured with a high-sensitivity assay (sensitivity =0.002 mg/dL). Plasma glucose levels were determined by a commercial clinical laboratory. Blood pressure, salivary flow rate, height, and weight were also measured.
Results
Of the 65 children enrolled, there were two underweight children (3.1%), 30 normal-weight children (46.2%), 12 overweight children (18.4%), and 21 obese children (32.3%). The mean overall glucose concentrations were 0.11±0.02 mg/dL in saliva and 86.3±0.8 mg/dL in plasma, and these did not differ significantly by body–weight groups. By regression analysis, the plasma concentration equaled 13.5 times the saliva concentration, with a threshold level of 84.8 mg/dL. Salivary glucose values less than threshold plasma concentration were essentially zero. Diagnostic analysis indicated a positive predictive value of 50%, a negative predictive value of 90%, and a sensitivity and specificity both of approximately 75%. The salivary glucose concentration did not vary with saliva flow rate.
Conclusion
Taking into account the threshold response characteristics of the salivary glucose concentration response, these results suggest that testing salivary glucose levels may be useful as a screening assay for high fasting plasma glucose levels. The low false positive value is important to assure a low fraction of missed diagnoses.
Introduction
In adults, metabolic syndrome is defined as a cluster of cardiovascular risk factors, including hypertension, altered glucose metabolism, dyslipidemia, and abdominal obesity, that are associated with an increased risk of atherosclerotic cardiovascular disease and type 2 diabetes (T2D). Metabolic syndrome has also been associated with the development of other chronic diseases, including hyperandrogenism, polycystic ovary syndrome, hepatic steatosis, and nonalcoholic fatty liver disease, among others.Citation1 Although, historically, metabolic syndrome was not considered a pediatric disorder, the alarming rise of obesity among children and adolescents worldwideCitation2 has been met with a corresponding rise in the prevalence of metabolic syndrome in these age groups.Citation3 As with adults, several longitudinal studies have demonstrated that metabolic syndrome in childhood predicts the development of cardiovascular disease and T2D in adulthood,Citation4–Citation6 with an increased risk of early mortality.Citation7
There has been much disagreement in the field about how to define metabolic syndrome in children, and several definitions have been proposed by various research groups and expert consensus panels. Notably, all contain some common features, including an obesity variable (waist circumference or body mass index [BMI]), dyslipidemia variables (elevated triglycerides and low high-density lipoprotein cholesterol), elevated blood pressure, and a variable representing glucose metabolism (impaired fasting glucose or impaired glucose tolerance).Citation8–Citation10 As some of these variables require the collection of blood samples for testing, which can be difficult in children, there has been interest in the development of non-invasive methods for assessing metabolic disease risk factors.Citation11 Because many molecules found in plasma are also found in saliva, the ease and noninvasive nature of saliva sampling is attractive.
One factor that has been considered for salivary analysis is fasting glucose, assuming that the level of salivary glucose might be used as a surrogate measurement for the level in plasma.Citation12 This approach has been tested in patients with T2D, with several studies reporting a significant correlation between fasting blood glucose and fasting salivary glucose levels.Citation13–Citation16 Considerable controversy has surrounded this approach when applied to patients without T2D, however, since some studies have found measureable salivary glucose levels in healthy controlsCitation13,Citation14 while others have not.Citation15,Citation16 To our knowledge, no studies have been performed evaluating the utility of salivary glucose levels as a surrogate marker for plasma glucose levels in children and adolescents at risk for metabolic syndrome. Therefore, we evaluated the utility of salivary glucose analysis as a possible screening test for fasting hyperglycemia in children by comparing the glucose levels in salivary and blood samples given by 11-year-old US children who were either normal weight, overweight, or obese.
Patients and methods
Patients
Children of both sexes between the ages of 10 and 11 years were recruited by advertisement in the Cambridge, Massachusetts, and Portland, Maine, areas from February 2011 to September 2011 using a protocol reviewed and approved by the Forsyth Institutional Review Board. Only children with extreme disease conditions, such as immuno-deficiencies, cancer, or serious behavioral disorders, were excluded. The target study size was set at 75 children based on obtaining approximately 25 children in each of the body weight categories of normal, overweight, and obese. Both informed consent and participant assent were obtained from the parents/guardians of each child and from the child.
Assessments
All assessments were conducted by trained examiners. Height was measured by stadiometer and weight was measured by a calibrated bathroom scale. Blood pressure and heart rate were measured after the children had sat quietly for 10 minutes with both feet on the floor, and the measurements were performed using an automated wrist monitor sized appropriately for children. Fitness was measured by a standardized 3-minute step testCitation17 where the change in heart rate was measured by a pulse oximetry probe (RAD-57, Masimo Corporation, Irvine, CA, USA) applied to the finger.
Saliva collection
Saliva was collected under 6-hour fasting conditions by dental hygienists. Each child was given a wrist label with a printed number and a dated, labeled, sterile, 15 mL plastic screw-top centrifuge tube (Product #430791, Corning Incorporated Life Sciences, Tewksbury, MA, USA) with the same number as the wrist band. Before saliva collection, each child rinsed with and swallowed 15 mL of water. Whole saliva (approximately 3 mL) was collected by having the child drool, not spit, into the screw-top tube. Tubes were kept on ice while saliva was allowed to accumulate in the child’s mouth. A monitor recorded the start time of the saliva collection, verified that 3 mL was collected from each child, recorded the stop time for each child, assured that the screw-cap was securely applied to the tube, and transferred the labeled tube to an ice bath for temporary storage. The average collection time was 7.68±4.8 minutes (mean ± standard error of the mean).
Salivary glucose analysis
Saliva samples were weighed and then centrifuged at 2,800 rpm at 4°C for 20 minutes. Two 1 mL aliquots of the supernatants were transferred to screw-cap storage tubes and maintained frozen at −80°C until assayed. For the glucose analysis, the glucose oxidase method using fluorescent emission of the dye (Glucose Colorimetric/Fluorometric Assay Kit #K606-100, BioVision, Inc., Mountain View, CA, USA) measured at Ex/Em -535/590 nm was adapted to work on a Tecan Freedom EVO® 150 robotic processor with an 8-channel liquid handling arm (Tecan Group Ltd, Männedorf, Switzerland). The fluorescence was measured by a spectrophotometer (Infinite® 200 Pro, Tecan Group Ltd) using reverse 96-well plate reading mode. The 3-sigma detection limit of the glucose assay was 0.002 mg/dL. Thirty microliters of saliva supernatant were assayed for each sample. Standards of 0.12, 0.24, 0.48, and 0.96 mg/dL were assayed in triplicate on each run. Coefficient of variation measurements on the same day and over a period of 98 days are found in . These data indicate that variation is increased for more dilute samples and ranges from 23 to 101 depending on glucose concentration. Coefficient of variation values reported for saliva sample analysis are often higher than those reported for serum analysis of the same biochemical,Citation18 possibly due to characteristics unique to saliva that increase measurement variability (viscosity, propensity to form bubbles, etc).
Table 1 Within- and between-day CV measurements of glucose in saliva samples
Plasma glucose analysis
Two milliliters of blood were obtained by venipuncture from the antecubital fossa under 6-hour fasting conditions and were collected into potassium oxalate/sodium fluoride (grey top) tubes. Collected blood samples were centrifuged at 2,800 rpm for 20 minutes. Two 0.5 mL plasma aliquots were dispensed into labeled, sterile, 1.8 mL screw-cap vials (Nunc® CryoTubes® #363401, Thermo Fisher Scientific Inc., Asheville, NC, USA) which were stored at −80°C until assayed. Plasma glucose levels were measured by a commercial clinical laboratory (test code 484, Quest Diagnostics Inc., Cambridge, MA, USA).
Statistical and analytical
BMI was calculated by dividing body weight in kilograms by height in meters squared. Body weight categories were determined from BMI percentile using The Centers for Disease Control software as follows: underweight, <5th percentile; normal weight, 5th–84th percentile; overweight, 85th–94th percentile; obese ≥95th percentile.Citation19 The saliva flow rate was computed by dividing the tarred weight of the saliva collection tube by the difference in the start and stop collection times in hours. The salivary glucose excretion rate was calculated by multiplying the salivary flow rate by the saliva glucose concentration. Associations between saliva glucose values and plasma values were investigated through linear regression analyses. The analysis of significant differences between parameters related to population characteristics was by analysis of variance. Significant pairwise differences were determined by post hoc analysis using Tukey’s test.
Results
Patients and demographics
A total of 65 children were enrolled, of which 63% were male (). The mean overall age of the children was 10.6±0.2 years old, with obese and overweight children being slightly older. There were two underweight children (3.1%), 30 normal-weight children (46.2%), 12 overweight children (18.4%), and 21 obese children (32.3%). The number of underweight children in the group was too small to be meaningful for statistical analyses. Both diastolic and systolic blood pressure tended to be higher in obese children relative to normal-weight children (124/69 mmHg versus 116/67 mmHg), but neither value varied significantly. The mean overall fasting plasma glucose level was 86.3 mg/dL, and did not differ significantly between body-weight groups.
Table 2 Population characteristics of the enrolled children
Salivary glucose concentration is not functionally related to saliva flow rate
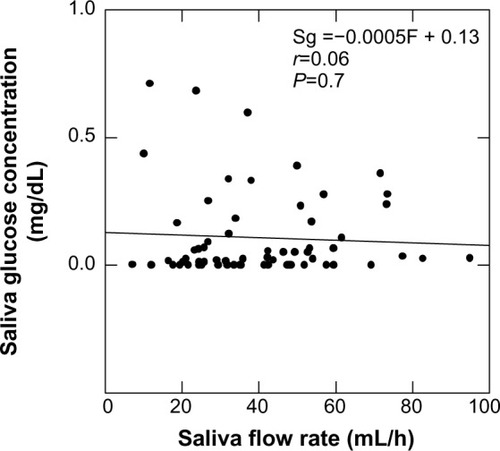
The mean saliva collection time was 7.68±4.8 min (range, 2–28 min). The average volume collected was 3.93±0.92 mL (range, 3–8 mL). The mean overall fasting salivary glucose level was 0.11±0.02 mg/dL, and the mean salivary glucose excretion rate was 41.2±8 μg/h, with no statistically significant differences seen between children in the different body weight categories. The salivary flow rate was 40.1±19.3 mL/h (range 7–95 mL/h), which was again not statistically significantly different between body weight categories. By regression analysis, the saliva glucose concentration did not appear to be functionally related to saliva flow rate ().
Figure 1 Saliva glucose concentration (Sg) as a function of salivary flow rate (F) by regression analysis.
Salivary glucose levels exhibit threshold kinetics
There was a significant association between plasma and salivary glucose levels, although there was considerable variability (). The functional relationship between the plasma and salivary glucose concentrations clearly exhibited a threshold. Plasma glucose concentrations less than the threshold value of 84.8 mg/dL produced unmeasurable salivary glucose levels. At plasma concentrations greater than 84.8 mg/dL, the plasma glucose concentration increased at a rate of 13.5 times the saliva glucose concentration. If positive salivary glucose values occur only at plasma values greater than zero, a threshold is implied. Mathematically, this occurs when the y-intercept assumes a large value rather than zero.
Figure 2 Plasma glucose concentration as a function of salivary glucose concentration.
Abbreviations: TP, true positive (red); FP, false positive (green); TN, true negative (black), FN, false negative (blue); PPV, positive predictive value; NPV, negative predictive value; AUC, area under the curve.
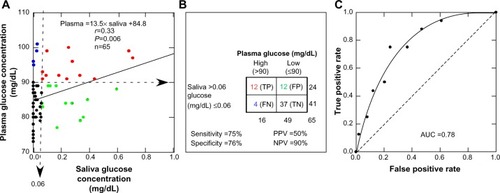
Salivary glucose levels have a high negative predictive value
The diagnostic potential of salivary glucose to predict plasma glucose is illustrated in . Diagnostic sensitivity and specificity were 75% and 76% respectively, but the false-positive rate was much higher than the false-negative rate, and the false-positive rate was equal to the true-positive rate. As such, salivary glucose levels would correctly identify only 50% of children with high plasma glucose levels. Conversely, the false-negative rate was small relative to the true-negative rate, so the probability of a child having a high plasma glucose level with a low salivary glucose level (≤0.06 mg/dL) is very low, and the negative predictive value is high (90%). illustrates the receiver operating curve with an area under the curve measurement of 0.78, an indication of good but not excellent accuracy of the salivary glucose method.
Discussion
Our investigation into the correlation between salivary and plasma glucose levels in children has been prompted by the need for a non-invasive method to determine the occurrence of hyperglycemia as part of the syndrome describing metabolic disease.Citation9 In this study, we compared fasting plasma and salivary glucose concentrations in a sample of 65 US children with a mean age of 10.6±0.2 years and found that salivary glucose levels exhibit threshold kinetics. While plasma glucose concentrations less than the threshold value of 84.8 mg/dL produced unmeasurable salivary glucose levels, plasma concentrations over the threshold appeared to produce a linear rise in salivary glucose levels. It is well-known that hyperglycemia (fasting blood glucose ≥100 mg/dL) occurs in children at a frequency of up to 10%,Citation20,Citation21 and the development of hyperglycemia is clearly an important step in the progression of metabolic syndrome to T2D.Citation22 Our data suggest that salivary glucose testing may be a potentially useful screening tool for metabolic syndrome in children. While salivary glucose testing may miss up to 50% of children with high plasma glucose levels, it would almost certainly identify those children who do not have high plasma glucose levels, sparing these children from further invasive testing. This method also has the advantage of being free of adverse reactions, compared to an adverse reaction incidence of 2% and a loss-of-consciousness incidence of 0.3% reported in a study involving venous sampling in children.Citation23
The identification of a threshold response in human salivary glucose concentration is intriguing. The phenomenon of a salivary glucose concentration threshold was first reported by investigators studying canine saliva.Citation24 As early as 1891, these investigators reported that glucose does not normally appear in the saliva of dogs, but when the blood glucose concentration was elevated by intravenous infusion to approximately 512 mg/dL, glucose began to appear in saliva at a level proportional to blood levels. Our data, as well as those of others, indicate that salivary glucose in humans also exhibits a threshold response ().Citation14,Citation15,Citation25,Citation26 The data suggest that the human salivary glucose threshold is in the range of 84.8 to 136.8 mg/dL and that the slope is in the range of 6.4 to 55.3. It is clear that these values may vary depending on the glandular source of saliva, the method of collection, the population characteristics, and even the individual subject. This latter point was made elegantly in a study that continuously measured salivary and blood glucose levels in six normal-weight adult subjects following the oral administration of 75 g of glucose.Citation26 Considerable variability existed between individuals in both the salivary threshold and the slope of the blood: saliva concentration response function. Therefore, if salivary glucose testing were to be adopted clinically, a standardized protocol for fasting, collection, and analysis would need to be established.
Table 3 Representative studies that provide analytical data for evaluating the relationship between salivary glucose and blood glucose concentrations as a threshold response
A threshold plasma level for the appearance of glucose in saliva evokes the relationship between plasma and renal glucose concentrations. The data in include an estimated threshold response in urine of 152.7 mg/dL,Citation27 suggesting that salivary glands exhibit a lower glucose threshold than does the kidney. There are several similarities between the kidney and salivary glands. Morphologic and immunologic similarities between the striated ducts of the salivary gland and the kidney have been demonstrated. For example, in animal models, the Na(+)-dependent glucose co-transporter SGLT1 is found in both the kidney and in the acinar and ductal cells of salivary glands.Citation28–Citation31 As with urine in the kidney, the formation of saliva has been proposed to be a two-stage process.Citation32,Citation33 In this model, saliva is initially formed by salivary acinar cells as a primary fluid with a small-molecule composition similar to that of plasma. The primary fluid is then modified by the salivary gland system that reabsorbs sodium and glucose until the resulting hypotonic glucose-depleted (relative to plasma) oral saliva is secreted into the mouth. It seems possible that the salivary glucose threshold could occur by a mechanism similar to that found in the kidney.
Recognition that salivary glucose exhibits a threshold response can aid in the interpretation of the diagnostic potential of salivary glucose. First, it means that salivary glucose levels are likely to be useful only for diagnosis of high glucose conditions. As such, salivary glucose could still prove a useful indicator of pathological status – a lack of salivary glucose would be good news for the patient with diabetes! Yet, we must contend with the issue of false-negatives. In our study, we found many readings along the axis of zero for salivary glucose concentration (), which may represent children with a higher-than-average salivary glucose concentration threshold which had not yet been exceeded. It is commonly reported in the salivary glucose literature that there is a significant correlation between plasma and salivary glucose levels under conditions in which hyperglycemia is expected, such as in subjects with uncontrolled diabetes,Citation34 but that there is little or no correlation under conditions where hyperglycemia may not be expected, such as in healthy subjects and in patients with controlled diabetes.Citation16 This fact becomes understandable if blood glucose levels are at or below the value of the salivary glucose concentration threshold. Secondly, we do not know what parameters modulate the salivary glucose concentration threshold in humans. The original research in dogs has shown that an intravenous infusion of insulin increases the threshold level for the salivary glucose concentration.Citation24 Whatever mechanisms control the salivary glucose concentration threshold, it seems likely that salivary glucose concentration does result from simple passive diffusion from plasma. Further studies will be needed to clarify these issues.
Conclusion
The recognition of threshold kinetics in salivary glucose concentration measurements suggests that if children have measurable salivary glucose levels ≥0.06 mg/dL, there is a significant probability that they have high plasma glucose levels. If they have salivary glucose levels above 1 mg/dL, then they are likely to be hyperglycemic (plasma levels >100 mg/dL), although this criterion could be greatly modified in certain defined clinical conditions and carries a low positive predictive value (positive predictive value =50%). As a screening diagnostic, however, low positive predictive value is acceptable, since the test would ultimately be used as a trigger to seek professional confirmation. Indeed, a high false-negative rate, which is not the case here, would be the worst case scenario, since it would inappropriately assure the absence of high plasma glucose levels. In our study, the probability that a child would not have a high plasma glucose level if the saliva glucose is low (≤0.06 mg/dL), the negative predictive value is 90%. Although our methods are designed for research purposes, by this analysis, saliva glucose appears to have reasonable characteristics to serve as a screening diagnostic for high plasma glucose in children.
Acknowledgments
We acknowledge the help of T Yaskell and C Floros in the collection of samples and J Vargas for saliva assays. We acknowledge the aid of M Tavares, M Cugini, and H Hasturk in the conduct of the clinical examinations and conduct of the clinical study. We also acknowledge the assistance of New England Survey Systems of Brookline Massachusetts for aid in database preparation. We thank Jillian Lokere, MS, for editorial assistance in preparing the manuscript.
Disclosure
The authors report no conflicts of interest.
References
- WeissRBremerAALustigRHWhat is metabolic syndrome, and why are children getting it?Ann N Y Acad Sci20131281123 14023356701
- Guidelines for the acceptance of peroxide-containing oral hygiene products. American Dental Association Council on Dental TherapeuticsJ Am Dent Assoc199412581140 11428064059
- CamhiSMKatzmarzykPTPrevalence of cardiometabolic risk factor clustering and body mass index in adolescentsJ Pediatr20111592303 30721429506
- FranksPWHansonRLKnowlerWCChildhood predictors of young-onset type 2 diabetesDiabetes200756122964 297217720898
- SchubertCMSunSSBurnsTLMorrisonJAHuangTTPredictive ability of childhood metabolic components for adult metabolic syndrome and type 2 diabetesJ Pediatr20091553S6. e1 e7
- MagnussenCGKoskinenJChenWPediatric metabolic syndrome predicts adulthood metabolic syndrome, subclinical atherosclerosis, and type 2 diabetes mellitus but is no better than body mass index alone: the Bogalusa Heart Study and the Cardiovascular Risk in Young Finns StudyCirculation2010122161604 161120921439
- FranksPWHansonRLKnowlerWCSieversMLBennettPHLookerHCChildhood obesity, other cardiovascular risk factors, and premature deathN Engl J Med20103626485 49320147714
- CookMDWeitzmanMAuingerPNguyenMDietzWHPrevalence of a metabolic syndrome phenotype in adolescents: findings from the third National Health and Nutrition Examination Survey, 1988–1994Arch Pediatr Adolesc Med20031578821 82712912790
- ZimmetPAlbertiKGKaufmanFThe metabolic syndrome in children and adolescents – an IDF consensus reportPediatr Diabetes200785299 30617850473
- GoodmanEDanielsSRMorrisonJAHuangBDolanLMContrasting prevalence of and demographic disparities in the World Health Organization and National Cholesterol Education Program Adult Treatment Panel III definitions of metabolic syndrome among adolescentsJ Pediatr20041454445 45115480365
- MorandiAMaffeisCPredictors of metabolic risk in childhood obesityHorm Res Paediatr20148213 1124923289
- ShannonILPrigmoreJRBrooksRAGlucose concentrations in parotid fluid and blood serum following intravenous glucose loadingOral Surg Oral Med Oral Pathol1960131010 101214445483
- SatishBNSrikalaPMaharudrappaBAwantiSMKumarPHugarDSaliva: A tool in assessing glucose levels in Diabetes MellitusJ Int Oral Health201462114 11724876711
- AbikshyeetPRameshVOzaNGlucose estimation in the salivary secretion of diabetes mellitus patientsDiabetes Metab Syndr Obes20125149 15422923999
- AmerSYousufMSiddqiuiPQAlamJSalivary glucose concentrations in patients with diabetes mellitus – a minimally invasive technique for monitoring blood glucose levelsPak J Pharm Sci200114133 3716414850
- PanchbhaiASCorrelation of salivary glucose level with blood glucose level in diabetes mellitusJ Oral Maxillofac Res201233e324422015
- SurianoKCurranJByrneSMJonesTWDavisEAFatness, fitness, and increased cardiovascular risk in young childrenJ Pediatr20101574552 55820542285
- BrowneRWKantarciALaMonteMJPerformance of multiplex cytokine assays in serum and saliva among community-dwelling postmenopausal womenPloS One201384e5949823577067
- cdc.gov [homepage on the Internet]Child and teen BMI calculatorCenters for Disease Control and Prevention2012 Available from: http://nccd.cdc.gov/dnpabmi/Accessed September 22, 2014
- ParkJHilmersDCMendozaJAStuffJELiuYNicklasTAPrevalence of metabolic syndrome and obesity in adolescents aged 12 to 19 years: comparison between the United States and KoreaJ Korean Med Sci201025175 8220052351
- KranzSMahoodLJWagstaffDADiagnostic criteria patterns of US children with Metabolic Syndrome: NHANES 1999–2002Nutr J200763817986354
- KuzuyaMAndoFIguchiAShimokataHAge-specific change of prevalence of metabolic syndrome: longitudinal observation of large Japanese cohortAtherosclerosis20071912305 31216828779
- HEALTHY Study GroupFosterGDLinderBA school-based intervention for diabetes risk reductionN Engl J Med20103635443 45320581420
- LangleyLLGunthorpeCHBeallWASalivary glucose thresholdAm J Physiol19581923482 48413520939
- ForbatLNCollinsREMaskellGKSönksenPHGlucose concentrations in parotid fluid and venous blood of patients attending a diabetic clinicJ R Soc Med19817410725 7287288781
- YamaguchiMMitsumoriMKanoYNoninvasively measuring blood glucose using salivaIEEE Eng Med Biol Mag199817359 639604702
- HayfordJTWeydertJAThompsonRGValidity of urine glucose measurements for estimating plasma glucose concentrationDiabetes Care19836140 446341014
- CetikSHupkensEMalaisseWJSenerAPopescuIRExpression and localization of glucose transporters in rodent submandibular salivary glandsCell Physiol Biochem20143341149 116124731998
- WrightEMLooDDHirayamaBABiology of human sodium glucose transportersPhysiol Rev2011912733 79421527736
- JurystaCNicaiseCCetikSLouchamiKMalaisseWJSenerAGlucose transport by acinar cells in rat parotid glandsCell Physiol Biochem2012293–4325 33022508040
- HussarPSuurojaTHussarUHavikoTTransport proteins in rats’ renal corpuscle and tubulesMedicina (Kaunas)2004407650 65615252230
- ThaysenJHThornNASchwartzILExcretion of sodium, potassium, chloride and carbon dioxide in human parotid salivaAm J Physiol19541781155 15913180731
- Sabino-SilvaROkamotoMMDavid-SilvaAMoriRCFreitasHSMachadoUFIncreased SGLT1 expression in salivary gland ductal cells correlates with hyposalivation in diabetic and hypertensive ratsDiabetol Metab Syndr2013516424499577
- EnglanderHRJeffayAIFullerJBChaunceyHHGlucose Concentrations in Blood Plasma and Parotid Saliva of Individuals with and without Diabetes MellitusJ Dent Res196342124614061947