
Abstract
Background
Mannose-binding lectin (MBL) or mannose-binding protein (MBP), encoded by MBL2 gene and secreted by the liver, activates complement system through lectin pathway in innate immunity against the host’s infection. Conflictingly, a number of MBL2 variants, rs1800450 (A>B), rs1800451 (A>C), rs5030737 (A>D), rs7096206 (Y>X), rs11003125 (H>L), and rs7095891 (P>Q) allele, have been found to be associated with compromised serum levels and pulmonary tuberculosis (PTB) susceptibility. The present meta-analysis study was performed to evaluate the potential association of these MBL2 gene variants with PTB susceptibility.
Materials and methods
A quantitative synthesis was performed on PubMed (Medline), EMBASE, and Google Scholar web database searches. A meta-analysis was performed to calculate the pooled odds ratios and 95% CIs for all the genetic models.
Results
A total of 14 eligible studies were included to analyze their pooled data for associations between alleles, genotypes, and minor allele carriers. The statistical analysis revealed the significant reduced PTB risk with homozygous variant genotype of rs1800451 polymorphism (CC vs AA: P=0.043; OR =0.828, 95% CI =0.689–0.994). Contrary to this, the variant allele of rs5030737 polymorphism showed association with increased PTB risk (D vs A: P=0.026; OR =1.563, 95% CI =1.054–2.317). However, the other genetic models of rs1800450 (A>B), rs7096206 (Y>X), and rs11003125 (H>L) MBL2 gene polymorphisms did not divulge any association with PTB susceptibility.
Conclusion
The current meta-analysis concludes that rs1800451 (A>C) and rs5030737 (A>D) polymorphisms of MBL2 gene play a significant role in PTB susceptibility. Further, well-designed epidemiological studies with larger sample size including consideration of environmental factors are warranted for the future.
Introduction
Tuberculosis (TB), caused by Mycobacterium tuberculosis, is one of the most prevalent contagious airborne disease/infection, which is very harmful to the body tissues. In spite of good advancements in the treatment strategies, it is still a major health problem among the public. Lately, many reputed health reports reveal 10.4 million new cases and about 1.4 million deaths caused by TB, globally, in the year 2015. Among the two commonly found TB types, pulmonary tuberculosis (PTB) is one of the most devastating form and remains a leading cause of morbidity and mortality, globally.Citation1 PTB is a two-stage process including infection of M. tuberculosis and progression to the disease. It is a complex disease where both environmental and genetic factors play a role in infection and spread of the disease. The bacteria M. tuberculosis affects approximately one-third of the world’s population but only 5%–10% of those infected/affected develop clinical TB during their lifetime.Citation2 It is suggestive of how host genetic factors largely influence the development of clinical disease following infection with M. tuberculosis,Citation3 which is consistent with animal models of TB as well.Citation4 Identifying the important susceptibility and resistance genes and their variations in the host will lead to better understanding of PTB pathogenesis and newer approaches for the treatment and prophylaxis. The ability of the host to prevent the proliferation of the dormant M. tuberculosis pathogen into a full-fledged disease depends on the competence of the immune system. Thus, understanding the molecular mechanism responsible for protective immunity is a necessary step for the development of improved therapies and PTB control.Citation5
The first line of protective immunity to control the initial infection of M. tuberculosis is the innate immunity. Variation at genetic level in components of innate immunity, influenced by a variety of factors, leads to PTB susceptibility.Citation6,Citation7 The human mannose-binding lectin (MBL), or mannose-binding protein (MBP), encoded by the MBL2 gene is mapped on 10q11.2-q21 chromosome. It is a polypeptide of 248 amino acids with 32 kDa sizeCitation8 and considered to be an important part of human innate immunity.Citation9 MBL is a liver-derived collagen-like serum protein. It plays an important role in recognizing the pathogen by its carbohydrate domain present on the surface of a variety of pathogens including M. tuberculosis.Citation10,Citation11 MBL targets the invading microorganisms for phagocytosis and complement-mediated killing. It binds to surface carbohydrates and activate the complement cascade via the lectin pathway.Citation12 The role of MBL in preventing and controlling infectious diseases has been widely investigated recently.Citation13
A lot of variability exists in MBL serum levels in different individuals. Low serum levels of MBL2 or individuals producing low MBL2 genotypes have higher infectious disease risk including PTB.Citation14,Citation15 Alteration in MBL serum levels in different individuals is attributed to MBL2 gene polymorphisms, which result in the creation of MBL2 genotypes responsible for producing low MBL in ~5% population worldwide.Citation16 The three commonly known MBL2 gene polymorphisms are present in the structural gene-coding region. They are found at codons: 52 (rs5030737, C>T transition, resulting Arg52Cys substitution, variant allele is known as “D”); 54 (rs1800450, G>A transition, resulting Gly54Asp substitution, variant allele is known as “B”); and 57 (rs1800451, G>A transition, resulting in Gly57Glu substitution, variant allele is known as “C”). The above said mutations lead to the structural changes in MBL protein, which cause a functional deficiency and a significant reduction in the circulating MBL.Citation17 These polymorphisms are collectively known as “AO” and reveal the alteration in MBL serum levels. The allele “A” designates the wild-type allele, whereas the allele “O” is indicative of the presence of mutant allele(s) in either of the three polymorphisms.Citation13 In addition, two other relevant single nucleotide polymorphisms (SNPs) at positions −550 (rs11003125, C>G, “HL” variant, where L is the wild-type allele) and −221 (rs7096206, G>C, “XY” variant, where Y is the wild-type allele) in the promoter region have been identified as protein expression regulators.Citation18 These polymorphisms may change the transcription rate, which can further lead to change in the concentration of serum MBL. Genotypes containing structural polymorphisms and promoter variants have shown variations in MBL concentrations in different individuals which can be up to 1,000 folds.Citation13 These polymorphisms affect MBL2 gene which reduces MBL protein level leading to decrease in innate immunity against pathogens. Analysis of the genetic variants of MBL2 gene in PTB appears to be helpful in identifying individuals at higher risk of PTB susceptibility.
A plethora of studies have been conducted in the past to evaluate the effect of MBL2 gene polymorphisms on the progress of infection in PTB.Citation15,Citation19–Citation31 The results of these studies are contradictory. The reason for their contradiction is probably their small sample size which lacks adequate power to detect the effects of MBL2 gene polymorphisms on PTB. This weakness can be overcome by the use of meta-analysis, a statistical tool that explores the risk factors associated with different genetic diseases. A meta-analysis employs a quantitative method to combine the data drawn from individual studies with small sample sizes to provide a reliable conclusion. We, therefore, performed the current meta-analysis to identify the effect of the abovementioned MBL2 polymorphisms on overall PTB risk.
Materials and methods
Study search and online databases
A systematic search was performed on various scholarly databases like PubMed, Medline, EMBASE, and Google Scholar. The combination of the keywords used for the search was “MBL OR MBL2 OR MBP OR mannose-binding protein OR mannose-binding lectin” gene (polymorphism OR mutation OR variant) AND tuberculosis OR PTB Susceptibility/Risk (last updated on December 2017). The titles and abstracts of the hits obtained by the above search criteria were evaluated. The most relevant publications were obtained after applying the eligibility criteria for thorough examination. In addition to the online database search, the reference lists of the selected research articles were also screened to find any missed relevant article during the initial search.
Criteria for inclusion and exclusion of the studies
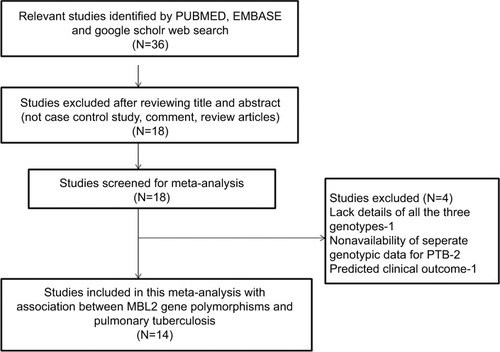
To facilitate the proper interpretation of this study, heterogeneity was minimized. The following criteria were applied to select and include the published studies in this meta-analysis: 1) the study must have a case–control design investigating MBL2 gene polymorphism and PTB risk, 2) the patients included in the study should be confirmed PTB cases and controls should be TB free, 3) the study should have genotypic frequency available for both cases and controls, 4) the study should be published in English language only, and 5) the study should have used statistically acceptable data collection and analysis strategy. In addition to these criteria, in cases where the same case series was included in multiple articles, the most recent study with highest number of cases was included in this study. The main reasons followed for exclusion of the studies from this meta-analysis were as follow: 1) duplicate studies or overlapping publications, 2) the study designs based only on PTB cases, 3) the articles with no genotype frequency reported, and 4) the data of reviews and abstracts. The information related to the identification and selection of the pertinent studies, by following the inclusion/exclusion criteria mentioned above, for the present meta-analysis has been given as PRISMA 2009 flow diagram ().
Figure 1 PRISMA 2009 flow diagram depicting identification and selection process (inclusion/exclusion) of the relevant published articles dealing with MBL2 gene polymorphisms and pulmonary tuberculosis risk for the present meta-analysis.
Strategy for literature search
Two researchers (RKM and SK) individually examined all the titles and abstracts of the retrieved published articles using the designated online web database search in a sequential order. The full texts of all the articles, possibly qualified, were also retrieved. To evaluate the appropriateness of the study for the inclusion in this pooled analysis, one researcher (RKM) systematically examined all the full-text retrieved publications. Afterward, the second researcher (SK) performed the same procedure of text evaluation independently by selecting randomly 10% of the full-text articles. During the selection process, full agreement was found between the two researchers regarding study exclusion and selection criteria. After the selection of the final set of the eligible studies, another researcher (SAD) extrapolated the pertinent data from all the included studies. This step of data extrapolation was cross-checked by another researcher (MAK), independently, by collecting the information from all the selected articles. Discrepancies and discords occurred during the study selection were resolved amicably with thorough discussion in the presence of an adjudicator (SH).
Screening of the studies
The electronic searches performed on PubMed (Medline), EMBASE, and Google Scholar web databases resulted in short-listing of 36 research articles in the preliminary stage. All the articles were examined thoroughly for their relevance by checking their titles, abstracts, and full texts for this meta-analysis. The research articles predicting survival in MBL2 polymorphic PTB patients or considering MBL2 variants as indicators for therapeutic response were excluded from this study. Also excluded were studies reporting expression of MBL2 at mRNA or protein level, and the review articles. Only studies with a case–control or cohort design with genotypic frequencies available for all the three genotypes were included in this meta-analysis. Beside the selected database search, the reference articles cited in the potential retrieved studies were also checked carefully for other potentially relevant articles, but no germane study was found. After many rounds of careful screening (using the sequential approach) by applying the pre-set inclusion and exclusion criteria as shown in PRISMA 2009 flow diagram (), 14 eligible original studies were considered worth to be included for this meta-analysis. These studies dealt with MBL2 rs1800450 (A>B), rs1800451 (A>C), rs5030737 (A>D), rs7096206 (Y>X), rs11003125 (H>L), and rs7095891 (P>Q) gene polymorphisms and PTB risk ().
Table 1 Main characteristics of all the studies included in this meta-analysis
Newcastle–Ottawa Scale (NOS) criteria for quality evaluation
For NOS evaluation, two independent investigators (RKM and SAD) separately performed the methodological quality assessment of the retrieved studies. The established NOS criteria for quality score analysis was used for the methodological quality assessment of the included studies.Citation32 The NOS criteria focuses on three main aspects: 1) subject selection: 0–4 points/star; 2) comparability of subject: 0–2 points/star; 3) and clinical outcome: 0–3 points/star. The studies scoring five or more stars were considered of medium to high quality.Citation32,Citation33 In case of difference in the number of stars assigned to a particular study by the two investigators, the issue was fully debated and resolved by a thorough discussion with a third investigator, SH.
Extraction and evaluation of the data quality
Two investigators (RKM and SK) independently summarized the methodological quality assessment and data extracted from all the eligible and retrieved articles by following the standard procedure. To confirm the accuracy of the summarized data, a data-collection form was used while strictly following the criteria stated above. The major summarized characteristics from the retrieved studies were as follows: the first author, the year of publication, the country of origin, the ethnicity of cases and controls and their number, the type of study, and the genotypic frequencies. The disagreements/discrepancies, on any data item of the selected studies, between RKM and SK were resolved by open scientific discussion with the third arbitrator (SH) in order to reach a final consensus.
Statistical analyses
The pooled ORs and their corresponding 95% CIs were estimated in order to assess the association between MBL2 gene polymorphism and PTB risk. The chi-square-based Q-test was used to examine heterogeneity assumption.Citation34 A P-value <0.05 was the threshold for heterogeneity significance. In case of no heterogeneity, the data from single comparison was combined using a fixed-effects model;Citation35 otherwise, a random-effects model was used for pooling the data.Citation36 Additionally, for inter-study variability quantification, I2 statistics was used. Higher values suggested an increasing degree of heterogeneity.Citation37 The chi-squared test was used to calculate the Hardy–Weinberg equilibrium (HWE) among the controls. The funnel plot asymmetry was calculated using Egger’s regression test (linear regression approach) on the natural logarithm scale of the OR. The significance of the intercept was measured by t-test, wherein the P-value <0.05 was the representation of statistically significant publication bias. A uniform resource locator http://www.meta-analysis.com/pages/comparisons.html was used for comparative evaluation of the “meta-analysis” programs. The Comprehensive Meta-Analysis V2 software program (Biostat, Englewood, NJ, USA) was used to analyze all the statistical parameters in this meta-analysis.
Trial sequential analysis
According to the Cochrane handbook, the best meta-analysis includes all the eligible trials in the analysis. Though it may not be sufficient evidence, there are chances that sometimes meta-analysis may lead to bias (systematic errors) or chance (random errors). In order to reduce these errors, Trial sequential analysis (TSA) tool from Copenhagen Trial Unit, Center for Clinical Intervention Research, Denmark, was used. TSA helps in calculating the required information size, adjusts threshold for statistical significance, and estimates the power of current conclusion.Citation32,Citation38–Citation40 When the TSA monitoring boundary crosses with the Z-curve before the required information size is reached, it confirms the robust evidence indicating the need for no further trials. When the case is reverse, further trials are necessarily required to be done in order to cross the monitoring boundaries. The Trial Sequential Analysis software (version 0.9, http://www.ctu.dk/tsa/) was used for this analysis. We performed two-sided hypothesis testing for the analysis and fixed type I error rate (α) at 5%. The results were combined by a DerSimonian–Laird random effects model. Sequential efficacy and harm monitoring boundaries that control type I error were constructed using Lan–DeMets version of the O’Brien–Fleming α-spending function, and the futility monitoring boundaries (for type II error) were constructed with an O’Brien–Fleming β-spending function.
Results
Quality assessment and characteristics of the selected studies
The major characteristics like genotypic distribution, minor allele frequency (MAF) in the controls/cases, and PTB susceptibility for all the 14 studies included in the present meta-analysis have been presented in and . All the 14 studies were evaluated for their quality according to the scoring system of NOS, and the majority of the studies (approximately 80%) were found to score five stars or more. The quality NOS scoring revealed moderate to good quality of all the studies included in this pooled analysis ().
Table 2 Genotypic distribution of MBL2 gene polymorphism included in meta-analysis: first
Table 3 Genotypic distribution of MBL2 gene polymorphisms included in this meta-analysis: second
Table 4 Quality assessment conducted according to the NOS for all the included studies
Publication bias diagnosis, heterogeneity evaluation, and quantitative synthesis
The presence or absence of the publication bias in the included studies was checked by funnel plot asymmetry and Egger’s regression statistics (P-value <0.05 considered as significant publication bias level). The shape of the funnel plots obtained and the outcomes of Egger’s test showed absence/presence of publication bias in all the five comparative genetic models of MBL2 gene polymorphisms. Likewise, the presence/absence of heterogeneity in the included MBL2 gene polymorphism studies for all the five genetic models of this meta-analysis was evaluated by using Q-test and I2 statistics. For each MBL2 polymorphism, random-effects model was applied to synthesize the data in the presence of heterogeneity, whereas fixed-effects model was adopted in the absence of heterogeneity. The outcomes of publication bias and heterogeneity evaluation and quantitative synthesis for each MBL2 polymorphism have been given in the following sections.
MBL2 rs1800450 polymorphism
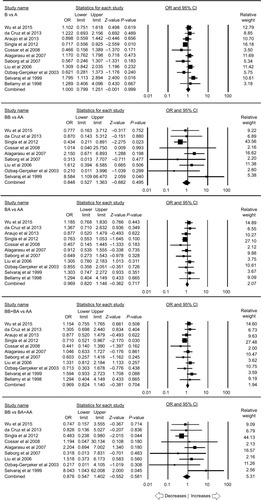
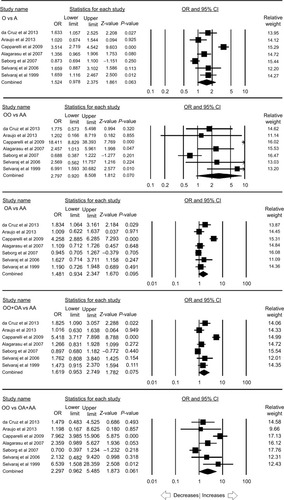
A total of eleven case–control studies provided the sufficient data (including 2,258 controls and 1,789 PTB cases) to calculate the ORs. Publication bias did not exist and heterogeneity was found in one genetic model (; Figure SI1). The pooled ORs revealed that MBL2 A>B gene polymorphism demonstrated no association with PTB risk in allelic contrast (B vs A: P=0.999; OR =1.000, 95% CI =0.799–1.251), homozygous (BB vs AA: P=0.495; OR =0.848, 95% CI =0.527–1.363), heterozygous (BA vs AA: P=0.717; OR =0.969, 95% CI =0.820–1.146), dominant (BB+ BA vs AA: P=0.704; OR =0.969, 95% CI =0.824–1.140), and recessive (BB vs BA+ AA: P=0.581; OR =0.876, 95% CI =0.547–1.402) genetic models, respectively ().
Table 5 Statistics to test the publication bias and heterogeneity (rs1800450 Overall)
Figure 2 Forest plot of ORs with 95% CI of PTB risk associated with the MBL2 rs1800450 (A>B) gene polymorphism for the overall population.
Notes: Black squares represent the value of OR and the size of the square indicates the inverse proportion relative to its variance. Horizontal lines represent the 95% CI of OR.
Abbreviation: PTB, pulmonary tuberculosis.
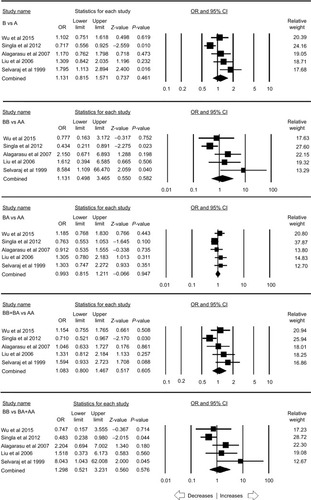
In the stratification analysis based on the ethnicity, five studies were included for the analysis in the Asian population. No publication bias existed and heterogeneity was found in four genetic models (; Figure SI2). No significant relationship was observed with PTB in allelic contrast (B vs A: P=0.461; OR =1.131, 95% CI =0.815–1.571), homozygous (BB vs AA: P=0.582; OR =1.313, 95% CI =0.498–3.465), heterozygous (BA vs AA: P=0.947; OR =0.993, 95% CI =0.815–1.211), dominant (BB+ BA vs AA: P=0.605; OR =1.083, 95% CI =0.800–1.467), and recessive (BB vs BA+ AA: P=0.576; OR =1.298, 95% CI =0.521–3.231), respectively ().
Table 6 Statistics to test the publication bias and heterogeneity (rs1800450 Asian)
Figure 3 Forest plot of ORs with 95% CI of PTB risk associated with the MBL2 rs1800450 (A>B) gene polymorphism for the Asian population.
Notes: Black squares represent the value of OR and the size of the square indicates the inverse proportion relative to its variance. Horizontal lines represent the 95% CI of OR.
Abbreviation: PTB, pulmonary tuberculosis.
MBL2 rs1800451 polymorphism
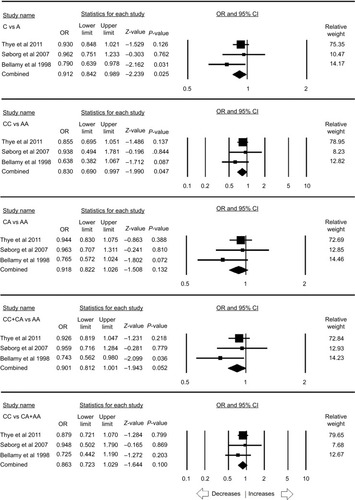
A total of seven case–control studies were included for this analysis accumulating 3,515 controls and 3,281 PTB cases. No publication bias was observed, whereas heterogeneity was found in three genetic models (; Figure SI3). The pooled ORs revealed that homozygous (CC vs AA: P=0.043; OR =0.828, 95% CI =0.689–0.994) genetic model was associated with reduced risk to PTB. However, other genetic models, allelic contrast (C vs A: P=0.921; OR =0.990, 95% CI =0.804–1.217), heterozygous (CA vs AA: P=0.724; OR =1.050, 95% CI =0.800–1.378), dominant (CC+ CA vs AA: P=0.856; OR =1.025, 95% CI =0.788–1.332), and recessive (CC vs CA + AA: P=0.093; OR =0.861, 95% CI =0.722–1.026), did not show any association with PTB ().
Table 7 Statistics to test the publication bias and heterogeneity (rs1800451 overall)
Figure 4 Forest plot of ORs with 95% CI of PTB risk associated with the rs1800451 (A>C) gene polymorphism for the overall population.
Notes: Black squares represent the value of OR and the size of the square indicates the inverse proportion relative to its variance. Horizontal lines represent the 95% CI of OR.
Abbreviation: PTB, pulmonary tuberculosis.
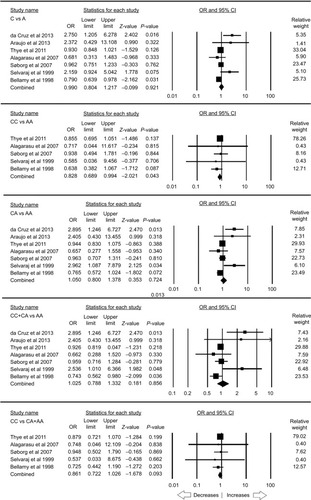
The stratification analysis based on the ethnicity included three studies for the analysis of the African population. Publication bias and heterogeneity were absent (; Figure SI4). A reduced risk was observed with allelic (C vs A: P=0.025; OR =0.912, 95% CI =0.842–0.989) and homozygous (CC vs AA: P=0.047; OR =0.830, 95% CI =0.690–0.997) genetic models. On the other hand, heterozygous (CA vs AA: P=0.132; OR =0.918, 95% CI =0.822–1.026), dominant (CC+ CA vs AA: P=0.052; OR =0.901, 95% CI =0.812–1.001), and recessive (CC vs CA + AA: P=0.100; OR =0.863, 95% CI =0.723–1.029) genetic models did not show any risk with PTB ().
Table 8 Statistics to test the publication bias and heterogeneity (rs1800451 African)
Figure 5 Forest plot of ORs with 95% CI of PTB risk associated with the rs1800451 (A>C) gene polymorphism for the African population.
Notes: Black squares represent the value of OR and the size of the square indicates the inverse proportion relative to its variance. Horizontal lines represent the 95% CI of OR.
Abbreviation: PTB, pulmonary tuberculosis.
MBL2 rs5030737 polymorphism
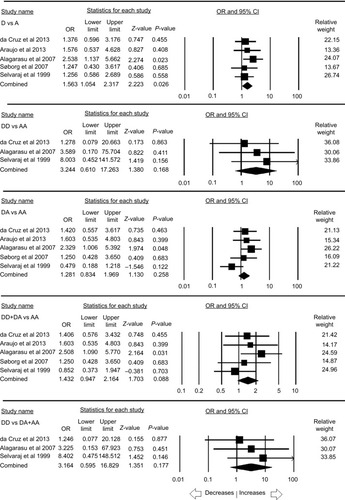
A total of five case–control studies were included, which comprises a sum of 735 controls and 876 confirmed PTB cases. There was no publication bias and heterogeneity (; Figure SI5). The pooled ORs revealed that variant allele was found to be associated with the increased risk (D vs A: P=0.026; OR =1.563, 95% CI =1.054–2.317) of PTB in comparison to wild allele A. Other genetic models, homozygous (DD vs AA: P=0.168; OR =3.244, 95% CI =0.610–17.263), heterozygous (DA vs AA: P=0.258; OR =1.281, 95% CI =0.834–1.969), dominant (DD+ DA vs AA: P=0.088; OR =1.432, 95% CI =0.947–2.164), and recessive (DD vs DA + AA: P=0.177; OR =3.164, 95% CI =0.595–16.829), were not associated with any risk to PTB ().
Table 9 Statistics to test the publication bias and heterogeneity (rs5030737 overall)
Figure 6 Forest plot of ORs with 95% CI of PTB risk associated with the rs5030737 (A>D) gene polymorphism for the overall population.
Notes: Black squares represent the value of OR and the size of the square indicates the inverse proportion relative to its variance. Horizontal lines represent the 95% CI of OR.
Abbreviation: PTB, pulmonary tuberculosis.
MBL2 combined rs1800450, rs1800451, rs5030737 polymorphism
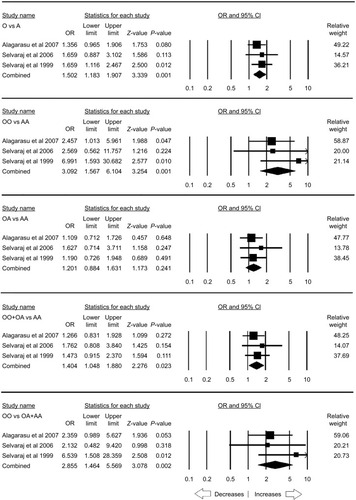
A total of seven case–control studies provided enough data to calculate ORs, including 1,340 controls and 1,445 PTB cases. Publication bias was not found, but heterogeneity was present in all the genetic models (; Figure SI6). The pooled ORs revealed that combined gene polymorphism was not associated with PTB in allelic contrast (O vs A: P=0.063; OR =1.524, 95% CI =0.978–2.375), homozygous (OO vs AA: P=0.070; OR =2.797, 95% CI =0.920–8.508), heterozygous (OA vs AA: P=0.095; OR =1.481, 95% CI =0.934–2.347), dominant (OO+ OA vs AA: P=0.075; OR =1.619, 95% CI =0.953–2.749), and recessive (OO vs OA+ AA: P=0.061; OR =2.297, 95% CI =0.962–5.485) genetic models ().
Table 10 Statistics to test the publication bias and heterogeneity (combined overall)
Figure 7 Forest plot of ORs with 95% CI of PTB risk associated with MBL2 combined rs1800450, rs1800451, rs5030737 (A>O) gene polymorphism for the overall population.
Notes: Black squares represent the value of OR and the size of the square indicates the inverse proportion relative to its variance. Horizontal lines represent the 95% CI of OR.
Abbreviation: PTB, pulmonary tuberculosis.
The stratification analysis based on the ethnicity included three studies from the Asian population. There was no publication bias and heterogeneity (; Figure SI7). Increased risk was observed with allelic (O vs A: P=0.001; OR =1.502, 95% CI =1.183–1.907), homozygous (OO vs AA: P=0.001; OR =3.092, 95% CI =1.567–6.104) and recessive (OO vs OA+ AA: P=0.002; OR =2.855, 95% CI =1.464–5.569) genetic models. Other genetic models, heterozygous (OA vs AA: P=0.241; OR =1.201, 95% CI =0.884–1.631) and dominant (OO+ OA vs AA: P=0.023; OR =1.404, 95% CI =1.048–1.880), did not reveal any risk with PTB ().
Table 11 Statistics to test the publication bias and heterogeneity (combined Asian)
Figure 8 Forest plot of ORs with 95% CI of PTB risk associated with MBL2 combined rs1800450, rs1800451, rs5030737 (A>O) gene polymorphism for the Asian population.
Notes: Black squares represent the value of OR and the size of the square indicates the inverse proportion relative to its variance. Horizontal lines represent the 95% CI of OR.
Abbreviation: PTB, pulmonary tuberculosis.
MBL2 rs7096206 polymorphism
A total of five case–control studies were included which provided 3,139 controls and 1,201 PTB cases. There was no publication bias, but heterogeneity was found in three genetic models (; Figure SI8). The pooled ORs revealed that Y>X polymorphism was not associated with PTB in allelic contrast (X vs Y: P=0.657; OR =1.056, 95% CI =0.830–1.344), homozygous (XX vs YY: P=0.707; OR =0.932, 95% CI =0.647–1.344), heterozygous (XY vs YY: P=0.476; OR =1.107, 95% CI =0.838–1.462), dominant (XX+ YX vs YY: P=0.548; OR =1.091, 95% CI =0.821–1.449), and recessive (XX vs XY+ YY: P=0.685; OR =0.928, 95% CI =0.646–1.333) genetic models ().
Table 12 Statistics to test the publication bias and heterogeneity (rs7096206 overall)
Figure 9 Forest plot of ORs with 95% CI of PTB risk associated with MBL2 rs7096206 (Y>X) gene polymorphism for the overall population.
Notes: Black squares represent the value of OR and the size of the square indicates the inverse proportion relative to its variance. Horizontal lines represent the 95% CI of OR.
Abbreviation: PTB, pulmonary tuberculosis.
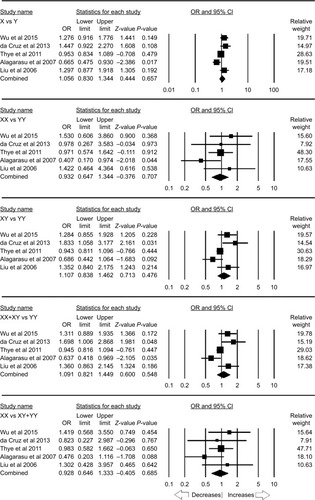
The ethnicity-based stratification analysis included three studies from the Asian population. Publication bias was not found, whereas heterogeneity was detected in two genetic models (; Figure SI9). Likewise, no risk was observed with allelic (X vs Y: P=0.905; OR =1.027, 95% CI =0.661–1.598), homozygous (XX vs YY: P=0.662; OR =0.884, 95% CI =0.509–1.536), heterozygous (XY vs YY: P=0.659; OR =1.059, 95% CI =0.822–1.363), dominant (XX+ YX vs YY: P=0.866; OR =1.042, 95% CI =0.642–1.691), and recessive (XX vs XY+ YY: P=0.676; OR =0.890, 95% CI =0.517–1.534) genetic models ().
Table 13 Statistics to test the publication bias and heterogeneity (rs7096206 Asian)
Figure 10 Forest plot of ORs with 95% CI of PTB risk associated with MBL2 rs7096206 (Y>X) gene polymorphism for the Asian population.
Notes: Black squares represent the value of OR and the size of the square indicates the inverse proportion relative to its variance. Horizontal lines represent the 95% CI of OR.
Abbreviation: PTB, pulmonary tuberculosis.
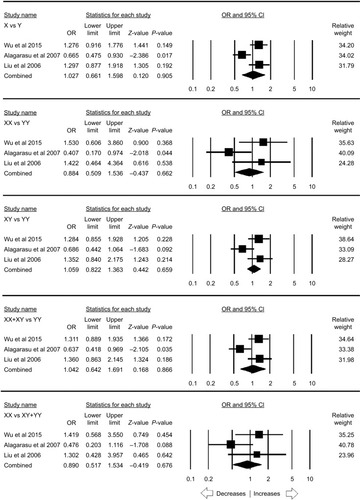
MBL2 rs11003125 polymorphism
Four case–control studies were included to calculate the pooled ORs, including 2,685 controls and 2,556 PTB cases, wherein no publication bias was found but three genetic models showed heterogeneity (; Figure SI10). The pooled ORs did not demonstrate any risk with PTB in allelic contrast (L vs H: P=0.995; OR =0.999, 95% CI =0.805–1.241), homozygous (LL vs HH: P=0.878; OR =1.026, 95% CI =0.736–1.431), heterozygous (LH vs HH: P=0.430; OR =1.240, 95% CI =0.727–2.113), dominant (LL+ LH vs HH: P=0.537; OR =1.182, 95% CI =0.695–2.012), and recessive (LL vs LH+ HH: P=0.256; OR =0.918, 95% CI =0.791–1.064) genetic models ().
Table 14 Statistics to test the publication bias and heterogeneity (rs11003125 overall)
Figure 11 Forest plot of ORs with 95% CI of PTB risk associated with MBL2 rs11003125 (H>L) gene polymorphism for the overall population.
Notes: Black squares represent the value of OR and the size of the square indicates the inverse proportion relative to its variance. Horizontal lines represent the 95% CI of OR.
Abbreviation: PTB, pulmonary tuberculosis.
The results of meta-analysis of MBL2 gene polymorphisms, ie, rs1800450 A>B, rs1800451 A>C, rs5030737 A>D, combined rs1800450, rs1800451, rs5030737 A>O, rs7096206 Y>X, and rs11003125 H>L and their association with PTB susceptibility have been summarized in .
Table 15 Summary of the results of association of MBL2 gene polymorphisms and PTB risk (overall and ethnicity-wise analysis)
Sensitivity analysis
To examine the influence of each individual study on the overall risk of PTB, sensitivity analysis was accomplished. Leave-one-out sensitivity analysis (excluding single case– control study at a time) was performed and the pooled ORs recomputed for each genetic variant of MBL2. The same was tested during the subgroup analysis by the ethnicity. The ORs estimated for each polymorphism of MBL2 gene after excluding a single study did not show any major difference from the primary values (rs1800450 [A>B] [Overall: Figure SI11, Asian: Figure SI12]; rs1800451 [A>C] [Overall: Figure SI13, African: Figure SI14]; rs5030737 [A>D] [Overall: Figure SI15]; combined rs1800450, rs1800451, rs5030737 [A>O] [Overall: Figure SI16, Asian: Figure SI17]; rs7096206 [Y>X] [Overall: Figure SI18, Asian: Figure SI19], rs11003125 [H>L] [Overall: Figure SI20]) of these genetic variants. This analysis guaranteed the stability of the overall results of this meta-analysis.
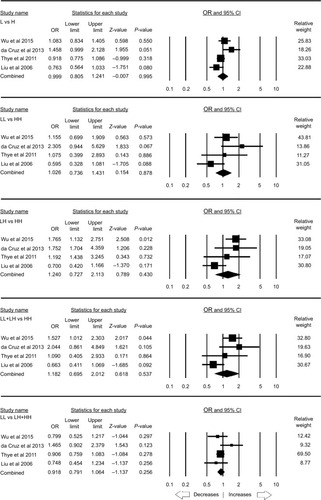
Trial sequential analysis
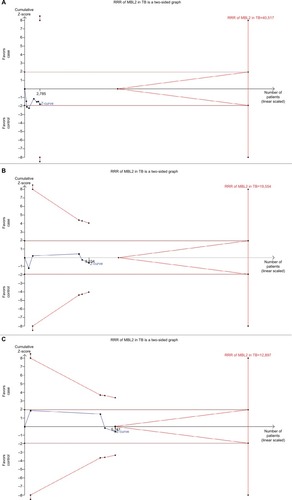
TSA was used to investigate the relevance of MBL2 rs1800450 A>B, rs1800451 A>C, rs5030737 A>D, combined rs1800450, rs1800451, rs5030737 A>O, rs7096206 Y>X, and rs11003125 H>L gene polymorphisms with PTB susceptibility. The dominant model was used to study all these polymorphisms. As shown in , the required information size for MBL2 rs1800450, rs1800451, and rs5030737 polymorphisms was 5,876, 24,257 and 3,611 patients, respectively. However, the accrued information size remained 4,047, 6,796, and 1,611. Similarly, for the promoter variants rs7096206, rs11003125, and combined structural polymorphism (A>O) of MBL2, the accrued information size was 4,340, 5,241 and 2,785, but the required information size was 19,554, 12,897, and 40,517, respectively (). As depicted in and , the cumulative Z-curve of all the studied polymorphisms did not cross the trial monitoring boundary before reaching the required information size, indicating the cumulative evidence was not sufficient and further trials are needed ( and ).
Figure 12 Trial sequence analysis of all the included studies dealing with MBL2 gene polymorphisms, based on dominant genetic model, and PTB risk: (A) rs1800450 (A>B), (B) rs1800451 (A>C), and (C) rs5030737 (A>D).
Abbreviations: PTB, pulmonary tuberculosis; RRR, relative risk reduction.
Figure 13 Trial sequence analysis of all the included studies dealing with MBL2 gene polymorphisms, based on dominant genetic model, and PTB risk: (A) combined rs1800450, rs1800451, rs5030737 (A>O), (B) rs7096206 (Y>X), and (C) rs11003125 (H>L).
Abbreviation: PTB, pulmonary tuberculosis.
Discussion
The passing years have proved the worth of SNPs as the most common and effective type of genetic variations studied in correlation with susceptibility to various diseases and have the potential to be considered as the markers for many complex diseases.Citation41 The differences in susceptibility to infections are determined by the host genetic factors and the first line of the host defense is innate immunity. Therefore, genetic variations in components of innate immunity may influence susceptibility to infections.Citation6
The humoral immunity against PTB is mediated by the innate immune components with the help of interference by many complement proteins. The diverse pattern-recognizing receptors or soluble pathogen-recognizing molecules (PRMs) enable innate immune system to recognize molecular motifs on pathogenic surfaces.Citation6 One of the C-type soluble PRMs is MBL, which is secreted as a part of the acute-phase response by the liver. The MBL plays an important role in recognizing, initiating, regulating, and amplifying the innate immune defense.Citation42
The MBL triggers the lectin complement pathway after it recognizes the target microorganisms. The multiple opsonin C3b fragments are developed by this activation of complement cascade, which eventually causes phagocytosis of the pathogen primarily by receptors of CR1 (CD35). The MBL is also believed to promote opsonophagocytosis of organisms directly and the clearance of apoptotic cells through various putative receptors.Citation43
Since MBL plays an important role in microorganism recognition during different stages of immunity, it possibly plays a significant role in the interaction of M. tuberculosis with the host. The MBL/MBP, a product of MBL2 gene, binds to the mannose groups present on several types of bacteria. MBP forms complexes with Mycobacteria and during diffusion in the blood enables their enhanced macrophage uptake. Thus, MBP binds and opsonizes Mycobacteria in order to boost their phagocytosis.Citation44 Earlier studies suggest that it is the phosphatidylinositol mannoside present on M. tuberculosis that binds with human MBP.Citation45 Lipoarabinomannan present in M. tuberculosis cell wall acts as a binding protein, thereby enabling their uptake by the host macrophages. The variations in MBL protein serum levels have been reported to be influenced by SNPs located within the MBL2 gene promoter region and exon 1 by several studies.Citation19–Citation31 Inherited deficiency of MBL may impair the innate immune function, which may further lead to increased risk for the development of various infectious diseases including PTB.Citation18
Previously, several case–control studies have reported the association of MBL2 gene polymorphisms and PTB susceptibility with inconsistency and lack of clarity. This may be because of their small sample sizes and ethnic variations leading to inadequate statistical power. Therefore, the current study was conducted to solve this conflict to provide a strong statistical basis and evidence for association of MBL2 gene polymorphisms and PTB susceptibility. The cumulative large sample size generates pooled ORs with sufficient statistical power and reduced random errors advantage.Citation46
This is the first dedicated meta-analytic study to evaluate the association between MBL2 gene polymorphisms and overall PTB susceptibility. This analysis included 14 studies considering all the eligible criteria. Most of the included studies have clearly described sample sizes, genotypes, case and healthy control descriptions. We found a significant reduced PTB risk associated with variant allele and homozygous genotype of rs1800451 (A>C) polymorphism. This suggests that individuals carrying homozygous genotype for MBL2 polymorphism may have a reduced risk for PTB in general. The homozygous variant may have a protective effect and helps the host in resisting infection and thereby PTB susceptibility. The enhanced resistance to mycobacte-rial infection might lead to high frequency of MBP variant alleles in diverse populations.Citation47 Conversely, variant allele of rs5030737 (A>D) showed increased risk to PTB. This indicates the dual role played by MBL2 polymorphism as a modifying gene in PTB development. Our data reiterate the support to the findings reporting involvement of the effects of combined host gene polymorphisms in the progression of M. tuberculosis infection. However, further large sample studies involving diverse populations are required for the confirmation.
Other MBL2 genetic polymorphisms, rs1800450 (A>B); combined polymorphisms rs1800450, rs1800451, rs5030737 (A>O); rs7096206 (Y>X); rs11003125 (H>L) did not show association with any increased or decreased risk of PTB in this analysis. Further investigations based on subgroup ethnicity found that rs1800451 (A>C) was associated with decreased PTB risk in the African population. Also, the combined polymorphisms (A>O) showed an increased PTB risk in the Asian population. However, the conclusions for the subgroup ethnicity analysis were suffered by the small sample size limitation which further warrants the studies to be conducted on a larger scale.
PTB is a multifactorial disease, which suggests that its susceptibility depends not only on the host genetic factors but also on the characteristics of infecting Mycobacteria and its interactions with other environmental factors.Citation48 The host and M. tuberculosis have evolved simultaneously over time, and the individual strains have adapted to their respective populations.Citation49 Hence, MBL2 gene polymorphisms alone could not be attributed for PTB predisposition.
As this study showed significant heterogeneity, we tried to minimize the likelihood of heterogeneity problem by performing the data analysis using random-effects model to obtain wider 95% CI. In addition, when studies were stratified by ethnicity, low heterogeneity was found in both, Asian and African population. Hence, we considered that the racial differences and ethnic origin of the study population, inadequate selection criteria of the subjects, and small sample size of each included study might be responsible for the foremost source of heterogeneity. Though, there are some limitations warranting to be addressed: firstly, the studies published in the English language and available from the selected electronic databases were included for this analysis, which makes it probable that some studies published in other languages or indexed in other electronic databases may have been missed; secondly, our results are based on unadjusted ORs; thirdly, our study is deficient in testing of gene–environment interactions because of insufficiency of the data available in the primary selected studies.
In opposition to the above stated limitations, the current study was complemented with several advantages as well including the testing of the publication bias and sensitivity analysis. No obvious publication bias was observed, and the results were robust as no single study yielded an obvious effect on the pooled ORs and the corresponding CIs during sensitivity analysis.
Conclusion
A meta-analysis is a powerful technique that provides a consensus using available data from different individual studies. The results of this study demonstrated that MBL2 rs1800451 (A>C) and rs5030737 (A>D) gene polymorphisms play a significant role in the risk of PTB disease. PTB has a significant public health impact. Hence, studies with a definite concept and character for MBL2 gene and infection or replication of M. tuberculosis are needed. The findings of this pooled study will help in augmenting the understanding associated with the role of MBL2 rs1800451 (A>C) and rs5030737 (A>D) gene polymorphisms and also aid in identifying the individuals prone to PTB infection. This eventually could be advantageous in achieving optimal therapeutic interventions to individual PTB patients. This study will also prove helpful for complete genotype profiling of MBL2 gene for PTB susceptibility and thereby would greatly assist in global control and outcome of this infectious disease. Moreover, this study also instigates the execution of studies with large sample sizes to decipher the potential molecular mechanism underlying PTB infection, ultimately aiding in development of molecular approaches for the detection of susceptible genotypes.
Author contributions
Conceived and designed the study and experiments: RKM, MAK, AH, SAD, AJ, MW, AKP, ML, NA, SK, BNM, and SH. Performed the experiments: RKM, MAK, AH, SAD, AJ, AKP, SK, and SH. Analyzed the data: RKM, SAD, AKP, SK, and SH. Contributed reagents/materials/analysis tools: MAK, AH, MW, ML, NA, and BNM. Wrote the paper: RKM, SAD, AJ, SK, and SH. All authors reviewed the manuscript. All authors contributed toward data analysis, drafting and revising the paper, gave final approval of the version to be published and agree to be accountable for all aspects of the work.
Acknowledgments
The authors are grateful to the Deanship of Scientific Research, Jazan University, Jazan-45142, Saudi Arabia, for the infrastructural (especially the Saudi Digital Library facility) and software related help for this research study.
Disclosure
The authors report no conflicts of interest in this work.
References
- World Health Organization (WHO)Global Tuberculosis Report2016 Available from: https://www.who.int/tb/publications/global_report/gtbr2016_executive_summary.pdfAccessed August 1, 2018
- FriedenTRSterlingTRMunsiffSSWattCJDyeCTuberculosisLancet2003362938788789913678977
- SchlugerNWChanging approaches to the diagnosis of tuberculosisAm J Respir Crit Care Med2001164112020202411739129
- BrownDHMilesBAZwillingBSGrowth of Mycobacterium tuberculosis in BCG-resistant and -susceptible mice: establishment of latency and reactivationInfect Immun1995636224322477768604
- MalikSSchurrEGenetic susceptibility to tuberculosisClin Chem Lab Med200240986386812435101
- ThielSFrederiksenPDJenseniusJCClinical manifestations of mannan-binding lectin deficiencyMol Immunol2006431–2869616023210
- MöllerMde WitEHoalEGPast, present and future directions in human genetic susceptibility to tuberculosisFEMS Immunol Med Microbiol201058132619780822
- EzekowitzRAStahlPDThe structure and function of vertebrate man-nose lectin-like proteinsJ Cell Sci Suppl198891211333077136
- MedzhitovRJanewayCJrInnate immunityN Engl J Med2000343533834410922424
- PetersenSVThielSJenseniusJCThe mannan-binding lectin pathway of complement activation: biology and disease associationMol Immunol2001382–313314911532276
- JenseniusJCThe mannan-binding lectin (MBL) pathway of complement activation: biochemistry, biology and clinical implicationsAdv Exp Med Biol2005564212216400802
- NethOJackDLDoddsAWHolzelHKleinNJTurnerMWMannose-binding lectin binds to a range of clinically relevant microorganisms and promotes complement depositionInfect Immun200068268869310639434
- GarredPLarsenFMadsenHOKochCMannose-binding lectin deficiency--revisitedMol Immunol2003402–4738412914814
- RantalaALajunenTJuvonenRMannose-binding lectin concentrations, MBL2 polymorphisms, and susceptibility to respiratory tract infections in young menJ Infect Dis200819881247125318729778
- CapparelliRIannacconeMPalumboDRole played by human mannose-binding lectin polymorphisms in pulmonary tuberculosisJ Infect Dis2009199566667219199550
- GarredPLarsenFSeyfarthJFujitaRMadsenHOMannose-binding lectin and its genetic variantsGenes Immun200672859416395391
- JenseniusHKleinDCvan HeckeMOosterkampTHSchmidtTJenseniusJCMannan-binding lectin: structure, oligomerization, and flexibility studied by atomic force microscopyJ Mol Biol2009391124625919501100
- EisenDPMinchintonRMImpact of mannose-binding lectin on susceptibility to infectious diseasesClin Infect Dis200337111496150514614673
- WuLDengHZhengYAn association study of NRAMP1, VDR, MBL and their interaction with the susceptibility to tuberculosis in a Chinese populationInt J Infect Dis20153812913526261060
- da CruzHLda SilvaRCSegatLMBL2 gene polymorphisms and susceptibility to tuberculosis in a northeastern Brazilian populationInfect Genet Evol20131932332923524205
- AraújoMSGraçaESAzevedoVNNo evidence of association between MBL2A/O polymorphisms and Mycobacterium tuberculosis infection in populations from the Brazilian Amazon regionHum Immunol2013741828423000376
- SinglaNGuptaDJoshiABatraNSinghJBirbianNAssociation of mannose-binding lectin gene polymorphism with tuberculosis susceptibility and sputum conversion timeInt J Immunogenet2012391101422050925
- CosarHOzkinayFOnayHLow levels of mannose-binding lectin confers protection against tuberculosis in Turkish childrenEur J Clin Microbiol Infect Dis200827121165116918612667
- AlagarasuKSelvarajPSwaminathanSRaghavanSNarendranGNarayananPRMannose binding lectin gene variants and susceptibility to tuberculosis in HIV-1 infected patients of South IndiaTuberculosis200787653554317855170
- SøborgCAndersenABRangeNInfluence of candidate susceptibility genes on tuberculosis in a high endemic regionMol Immunol20074492213222017157384
- LiuWZhangFXinZTSequence variations in the MBL gene and their relationship to pulmonary tuberculosis in the Chinese Han populationInt J Tuberc Lung Dis200610101098110317044201
- SelvarajPJawaharMSRajeswariDNAlagarasuKVidyaraniMNarayananPRRole of mannose binding lectin gene variants on its protein levels and macrophage phagocytosis with live Mycobacterium tuberculosis in pulmonary tuberculosisFEMS Immunol Med Microbiol200646343343716553818
- Ozbaş-GerçekerFTezcanIBerkelAIThe effect of mannose-binding protein gene polymorphisms in recurrent respiratory system infections in children and lung tuberculosisTurk J Pediatr2003452959812921293
- SelvarajPNarayananPRReethaAMAssociation of functional mutant homozygotes of the mannose binding protein gene with susceptibility to pulmonary tuberculosis in IndiaTuber Lung Dis199979422122710692990
- BellamyRRuwendeCMcAdamKPMannose binding protein deficiency is not associated with malaria, hepatitis B carriage nor tuberculosis in AfricansQJM199891113189519208
- ThyeTNiemannSWalterKVariant G57E of mannose binding lectin associated with protection against tuberculosis caused by Mycobacterium africanum but not by M. tuberculosisPLoS One201166e2090821695215
- StangACritical evaluation of the Newcastle-Ottawa scale for the assessment of the quality of nonrandomized studies in meta-analysesEur J Epidemiol201025960360520652370
- HuPHuangMYHuXYMeta-analysis of C242T polymorphism in CYBA genes: risk of acute coronary syndrome is lower in Asians but not in CaucasiansJ Zhejiang Univ Sci B201516537037925990054
- WuRLiBA multiplicative-epistatic model for analyzing interspecific differences in outcrossing speciesBiometrics199955235536511318188
- MantelNHaenszelWStatistical aspects of the analysis of data from retrospective studies of diseaseJ Natl Cancer Inst195922471974813655060
- DersimonianRLairdNMeta-analysis in clinical trialsControl Clin Trials1986731771883802833
- HigginsJPThompsonSGDeeksJJAltmanDGMeasuring inconsistency in meta-analysesBMJ2003327741455756012958120
- WetterslevJThorlundKBrokJGluudCTrial sequential analysis may establish when firm evidence is reached in cumulative meta-analysisJ Clin Epidemiol2008611647518083463
- TurnerRMBirdSMHigginsJPThe impact of study size on meta-analyses: examination of underpowered studies in Cochrane reviewsPLoS One201383e5920223544056
- BrokJThorlundKWetterslevJGluudCApparently conclusive meta-analyses may be inconclusive--trial sequential analysis adjustment of random error risk due to repetitive testing of accumulating data in apparently conclusive neonatal meta-analysesInt J Epidemiol200938128729818824466
- ShastryBSSNP alleles in human disease and evolutionJ Hum Genet2002471156156612436191
- BoldtABLutyAGrobuschMPAssociation of a new mannose-binding lectin variant with severe malaria in Gabonese childrenGenes Immun20067539340016738667
- OgdenCADecathelineauAHoffmannPRC1q and mannose binding lectin engagement of cell surface calreticulin and CD91 initiates macropinocytosis and uptake of apoptotic cellsJ Exp Med2001194678179511560994
- PolotskyVYBelisleJTMikusovaKEzekowitzRAJoinerKAInteraction of human mannose-binding protein with Mycobacterium aviumJ Infect Dis19971755115911689129080
- HoppeHCde WetBJCywesCDafféMEhlersMRIdentification of phosphatidylinositol mannoside as a mycobacterial adhesin mediating both direct and opsonic binding to nonphagocytic mammalian cellsInfect Immun1997659389639059284169
- IoannidisJPBoffettaPLittleJAssessment of cumulative evidence on genetic associations: interim guidelinesInt J Epidemiol200837112013217898028
- GarredPHarboeMOettingerTKochCSvejgaardADual role of mannan-binding protein in infections: another case of heterosis?Eur J Immunogenet19942121251319098426
- KramnikIDietrichWFDemantPBloomBRGenetic control of resistance to experimental infection with virulent Mycobacterium tuberculosisProc Natl Acad Sci U S A200097158560856510890913
- CawsMThwaitesGDunstanSThe influence of host and bacterial genotype on the development of disseminated disease with Mycobacterium tuberculosisPLoS Pathog200843e100003418369480