
Abstract
Background
Gut microbiota (GM) has recently been described as a functional reservoir of antimicrobial resistant genes (ARGs). However, the ARG-carrying bacterial species in the human gut has been poorly studied. This study, for the first time, is reporting bacterial communities' composition and antimicrobial resistome in the stool samples of pregnant and non-pregnant (NP) Saudi females.
Methods
Gut bacterial community composition was analyzed by 16S amplicon sequencing and culturomics. High throughput MALDI-TOF technique was used for identification of the isolates from stool samples and evaluated for resistance against 13 antibiotics using the agar dilution method. Clinically important ARGs were PCR amplified from genomic DNA of the stool samples using gene-specific primers.
Results
16S amplicon sequencing revealed that GM of pregnant and NP women were predominantly comprised of phyla Firmicutes, Bacteroidetes, Proteobacteria, and Actinobacteria. Bacterial diversity decreased in pregnant groups, whereas phylum Bacteroidetes declined significantly (p<0.05) in the first trimester. We noticed a relatively high abundance of butyrate-producing bacteria (eg, Faecalibacterium spp. and Eubacterium spp.) in the gut of pregnant women, whereas Prevotella copri was found at significantly (p<0.01) higher abundance in NP women. Moreover, about 14,694 isolates were identified and classified into 132 distinct species. The majority of the species belonged to phyla Firmicutes and Proteobacteria. About 8,125 isolates exhibited resistance against antibiotics. Out of 73 resistant-species, Enterococcus was the most diverse genus and Escherichia coli was the highly prevalent bacterium. The majority of the isolates were resistant to antibiotics; trimethoprim/sulfamethoxazole, cycloserine, and cefixime. ARGs encoding resistance against aminoglycoside, macrolide, quinolone, β-lactam, and tetracycline antibiotics were predominantly found in genomic DNA of the stool samples.
Conclusion
We conclude that pregnancy-associated GM modulations may help to sustain a healthy pregnancy, but a higher proportion of antibiotic resistance could be deleterious for both maternal and fetal health.
Introduction
During pregnancy, women undergo complex physiological changes that are accompanied by changes in the diversity and composition of gut microbiota (GM).Citation1,Citation2 Any change in GM composition and diversity may eventually affect host immunity, digestion, and metabolism.Citation3–Citation5 Pregnancy-associated GM modulations, especially an enriched abundance of the phyla Proteobacteria and Actinobacteria, have been associated with the increased energy uptake that occurs during pregnancy.Citation2,Citation6
The health implications of pregnancy-associated GM modulation are still unclear; first, because GM diversity and composition are plastic in nature and vary significantly with geography and diet,Citation7 and secondly, because the pregnancy–GM association has been studied in only a few geographical locations.Citation1,Citation2,Citation8–Citation10 In addition, unprecedented use of antibiotics could substantially affect GM diversity.Citation11 Increased prescription of antibiotics during pregnancy, which has been reported in several countries,Citation12–Citation14 could decrease GM diversity during pregnancy and may be deleterious for both maternal and fetal health. Furthermore, unnecessary and inappropriate use of antibiotics could induce teratogenicity, modulate GM composition, and contribute to the emergence of antimicrobial-resistant pathogens.Citation15,Citation16
Human GM has become a functional reservoir of antimicrobial resistance genes (ARGs)Citation17 that could potentially be acquired by opportunistic pathogens.Citation17,Citation18 These pathogens could translocate from the gut to various body sites through fecal contamination, gut barrier penetration, and medical services (such as catheter replacement).Citation19,Citation20 Such pathogens could further complicate infections, especially in immune-compromised individuals (including pregnant women and infants),Citation21,Citation22 and stress health care resources. Bacterial pathogens carrying ARGs could affect ovum implantation, pregnancy sustention, and delivery, and they could be life-threatening for both the mother and fetus.Citation23,Citation24 To deal with emerging infectious diseases, a top priority is an effective strategy for profiling the GM resistome and documenting the abundance of antibiotic-resistant bacteria in the human gut.
So far, the GM resistome has been poorly profiled and never been comprehensively analyzed during pregnancy. Therefore, we aimed to profile gut microbial resistome in pregnant and non-pregnant (NP) women and to determine the resistant genes behind the resistance. The samples collected from pregnant and NP women were comprehensively evaluated through culturomics and metagenomics using Illumina MiSeq, 16S RNA sequencing, and MALDI-TOF techniques. Purified bacterial isolates were then tested for antimicrobial resistance against 13 antibiotics. Moreover, the samples were also evaluated for the presence of 47 antimicrobial resistant genes.
Materials and methods
This study was approved by ethical research committee of the Faculty of Medicine at King Abdulaziz University (HA-02-J-008), under the reference number 114–14. All the participants provided written informed consent to participate in this study, and all methods were performed in accordance with the approved guidelines. The exclusion criteria included gastrointestinal infection, antibiotics intake in previous 3 months, and age above 50 years old. In total, 24 stool samples were collected, including eight samples from the control NP women and eight samples from each first and third trimester group of pregnant women. Age and body mass index (BMI) information of the participants are mentioned in .
Table 1 Average age and body mass index information of the participants in each group
16S rRNA gene amplicon sequencing and data processing
Genomic DNA was extracted from the 24 stool samples (eight samples per group) using QIAamp Fast DNA Stool Mini Kit (Qiagen NV, Venlo, the Netherlands). The samples were gel-purified and sequenced for 16S rRNA genes using V3–V4 universal primers. DNA concentrations were checked using the Qubit system (Invitrogen, Thermo Fisher Scientific, Waltham, MA, USA). Then, Illumina sequencing adapters and dual-index barcodes were joined to the sequence-reads using a limited PCR cycle. The product was cleaned with Agencourt AMPure beads (Agencourt, USA) and libraries were normalized using the Nextera XT protocol. Samples were loaded into a single flow cell for sequencing on the MiSeq sequencing platform (Illumina, USA) following the manufacturer’s protocol.
Raw FASTQ files were collected from the Illumina MiSeq, and paired-end reads were joined using PANDAseq.Citation25 Sequences were filtered; cleaned of primers and barcodes and all reads with “N” and those with sequences <200 bp were deleted, and high-quality sequences were dereplicated.Citation26 The filtered sequences reads were clustered at k=10 (97% similarity) and chimaeras and singleton reads were deleted. Finally, curated database derived from GreenGenes, RDPII, and NCBI were targeted using BLASTn for operational taxonomic units (OTUs). Sequence data of this study was submitted in the NCBI under project no. PRJNA355357.
Culturomics
A total of 12 stool samples (cross-sectionally collected) were processed for culturomics; six samples from NP group and six samples equally collected from women in first trimester and third trimister of pregnancy. The samples were cultured at 37°C for 48 hours on modified medium containing ascorbic acid to support the growth of anaerobic bacteria along with aerobic bacteria at aerobic environment as previously described (Table S1).Citation27,Citation28 Colonies were sub-cultured on the same media composition, and purified isolates were identified through MALDI-TOF MS (Bruker Daltonics, Billerica, MA, USA).Citation29 Each isolate was smeared as a thin-layer on separate spots of MALDI-Biotyper plate and covered with a matrix solution (5 mg of α-cyano acid 4-hydroxycinnamic acid diluted in 500 µL of acetonitrile, 25 µL trifluoroacetic acid, and 475 µL of HPLC-grade water). The automatic acquisition of bacterial spectra was performed with the flexControl 3.0 software, and spectra analysis was done with Biotyper 2.0 software. The spectrum with a score ≥1.9 was considered correct identification, otherwise the isolate was re-processed for identification. The unidentified isolates from MALDI-TOF were identified through 16S RNA gene sequencing as described previously.Citation30
Antimicrobial susceptibility screening
Antimicrobial susceptibility testing was performed according to the agar dilution method as described previously.Citation31 Briefly, agar media plates were prepared by adding antibiotics at 50°C after autoclaving and mixed well before pouring into 90 mm petri dishes. Control plates were prepared without antibiotics. A suspension of 0.5 McFarland turbidity, measured with a densitometer (BioMérieux, Craponne, France), was prepared for each isolate. Then, 2 µL of the suspension was spotted onto the agar surface. The plates were incubated for 48 hours at 37°C. We confirmed isolates' growth on the antibiotic-free control plates. Results were interpreted as resistant or susceptible to each antibiotic, based on the growth observed on the antibiotic-supplemented and control plates. Isolates were considered susceptible when growth was inhibited on the antibiotic-supplemented plates.Citation31,Citation32 We used a relatively high level of 20 µg/mL concentration of each antibiotic to select robust resistance, as previously reported in several studies for environmental and gut resistome screening.Citation17,Citation33,Citation34 We tested resistance against 13 antibiotics that belonged to 9 different antimicrobial classes ().
Table 2 List of antibiotics tested in this study
Antimicrobial resistant genes profiling in stool samples
A total of 47 clinically relevant ARGs including genes encoding ESBLs, aminoglycosides, carbapenemases, and vancomycin resistance were analyzed from the genomic DNA of the 24 stool samples using specific primer sets as mentioned in Table S2. PCR reactions were performed in a volume of 25 µL containing 5 ng DNA templet, 1x GoTaq® Green Master Mix (Promega Corporation, Fitchburg, WI, USA), 0.2 µM concentration of each primer. The cycling parameters were followed as previously described in the references of Table S2.
Statistical analysis
SPSS version 22 was used for statistical analysis. One-way ANOVA (for parametric data) and non-parametric Kruskal–Wallis (two-sided) were employed for non-normal data. The Kolmogorov-Smirnov D test was used to ascertain the normality of the data. Bonferroni and Dunn-Bonferroni tests were respectively performed for parametric and non-parametric multiple comparison p-values correction. Culturomics count data were transformed with Hellinger transformation method for ordination analysis using Vegan R (package analog) as previously suggested by Paliy and ShankarCitation35 to avoid false outputs and distribution. Data for 16S amplicon were analyzed for diversity indices and compositional variation using phyloseq (1.22.3), ggplot2 (3.1.0), scales (1.0.0), and VEGAN (2.2–1).Citation36,Citation37 The 16S amplicon data were analyzed with MDS-PCoA method for group clustering. First, complete OTUs table was rarefied to even-depth and then subset for most abundant 100 OTUs. Multivariate principal coordinate species analysis employed with type-1 scaling was performed using GUSTA-ME.Citation37
Results
GM and pregnancy-induced modulation
Pregnancy-associated changes in GM using 16S amplicon sequencing
After assigning 2.971 million high quality trimmed (>250 bp) sequences to bacterial domains, we detected a total of 15 phyla (), 98 families, 230 genera, and 454 species in the gut of 24 Saudi females. We noticed a relative decrease in species' diversity in the pregnant group samples. The lowest diversity (Shannon =3.7, Chao1=1141) was observed in the third trimester group, whereas the NP group had the highest diversity (Shannon =3.9, Chao1=1234) (). To assess pregnancy-induced changes in GM composition, we used a weighted UniFrac distance metric with a multivariate correspondence that clustered the studied groups ().
Figure 1 (A) Graphical presentation of average relative densities of detected phyla in percentage. The x-axis shows group name and y-axis indicates average abundance in percentage. Others indicate minor phyla. *Significant at p<0.05. **Highly significant at p≤0.01. (B) Alpha diversity analysis of 16S amplicon data. The first trimester group (1st-Trim) exhibited greater diversity and richness (shown by observed and Chao1 indices), and higher Shannon index compared to third trimester (3rd-Trim) and non-pregnant (NP) groups. (C) Weighted UniFrac analysis of 100 most abundant operational taxonomic units. The variation percentage explained by the correspondence coordinates is indicated on the axes. Dots represent sample relative positions and respective group samples are interlinked. Groups are respectively colored.
Abbreviations: NP, non-pregnant group; 1st-Trim, first trimester; 3rd-Trim, third trimester.
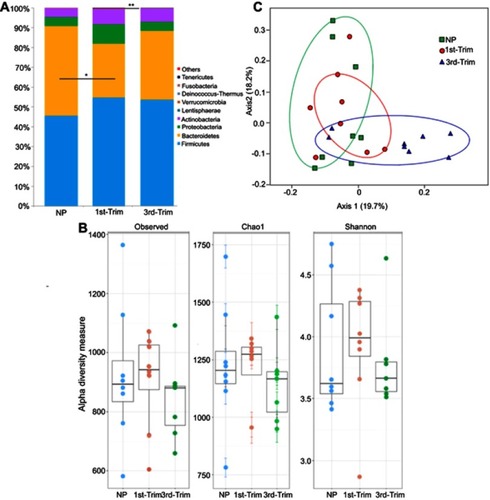
The GM of NP women was predominantly populated by the phyla Firmicutes (45.57±15%), Bacteroidetes (45.27±16%), Proteobacteria (4.65±2.37%), and Actinobacteria (4.32±2.1%). In addition to variations in other phyla relative abundance and diversity, Bacteroidetes declined significantly (p=0.036) in the first trimester (). In addition, Prevotellaceae (31.98±14%) was the most abundant bacterial family in NP Saudi women that was significantly (p=0.001) affected by pregnancy (first and third trimesters). Other dominantly detected families included Ruminococcaceae (24.03±9.5%), Bacteroidaceae (16.89±9.5%), Lachnospiraceae (10.2±3.4%), Eubacteriaceae (6.7±3.3%), and Rikenellaceae (3.73±1.2%) (Figure S1). Third trimester samples were distinguished by having a higher relative abundance of Ruminococcaceae (33.91±13.11) compared with the samples from the NP and first trimester groups Figure S1).
Most of the genera that declined in abundance during the third trimester were related to the phylum Firmicutes (especially from Clostridia class); for example, Oribacterium and Pseudobutyrivibrio were significantly (p<0.05) reduced in the third trimester group compared to the NP control group. In addition, the other relatively dominant genera that were significantly (p<0.05) reduced during the third trimester were Prevotella and Sutterella (Figure S2). Moreover, the dominantly detected species in the NP group including Prevotella copri (13.15±9.8%), Tannerella spp. (3.74±2.2%), and Prevotella stercorea (3.38±2.21%), were profoundly reduced during the first and third trimesters (Figure S3). Species Faecalibacterium prausnitzii, Faecalibacterium spp., and Bacteroides vulgatus were particularly enriched during pregnancy (first and third trimesters).
Evaluation of pregnancy-induced modulation in GM through culturomics
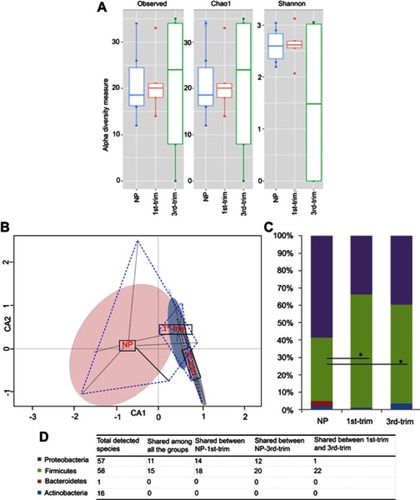
In total, 132 distinct species were identified through culturomics (using MALDI-TOF and 16S rRNA) by processing 14,694 purified isolates from the stool samples of pregnant women in their first and third trimester and NP women. Fiftyeight of the identified species belonged to the phylum Firmicutes, 57 species were from the phylum Proteobacteria, 16 species were from Actinobacteria, and one was from Bacteroidetes. The majority of the identified isolates were from the genera Enterococcus, Escherichia, and Lactococcus (Figure S4).
Increased species diversity was observed in third trimester samples (), but the differences were statistically insignificant. The constrained ordination analysis plotted the GM of control samples separately from those of the first and third trimester samples (). We noticed decreased representation of the phyla Proteobacteria and an increase in Firmicutes (p<0.05) representation during pregnancy compared to the control NP group (). Bacteroidetes were not detected from pregnant groups but a species of Flavobacterium johnsoniae from phylum Bacteroidetes was found in abundance of 2.66% in the NP group (). In addition, Actinobacteria were particularly increased in the third trimester samples compared to the NP samples (). The increase in Actinobacteria was related to greater growth of species from the genera Bifidobacterium, Corynebacterium, and Streptomyces in the third trimester compared to the control group. Distribution of common species from each phylum in the different groups is presented in .
Figure 2 Diversity, structural, and compositional changes observed according to trimester using a culturomic approach. (A) Alpha diversity analysis of culturomic data. (B) Constrained ordination analysis. Species' occurrence and abundance differed among the groups. The non-pregnant (NP) group had comparatively more diverse and abundant species. Projecting lines from each group correspond to samples. (C) Average relative percentage abundance of phyla. Annotation of phyla is same as shown in the D-section of the plot. Count data were first transformed with the Hellinger transformation method. After normality test, statistical significance was performed with ANOVA, and Bonferroni correction was applied. *Significant at p<0.05. (D) Tabular presentation of total species' identified in each phyla and study group.
Abbreviations: NP, non-pregnant group; 1st-Trim, first trimester; 3rd-Trim, third trimester.
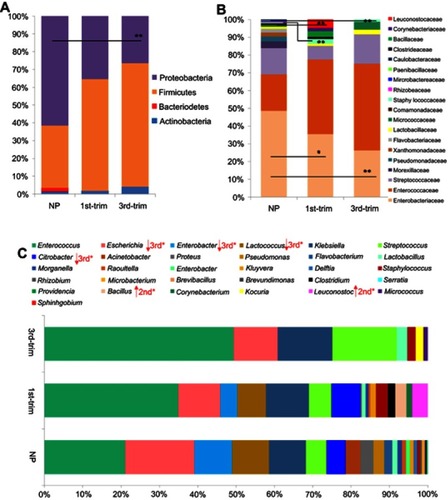
Overall, the relative abundance of the genus Enterococcus was higher in the first and third trimester (35.9% and 36.7%), respectively, compared to the NP group (19.2%). Escherichia, Leuconostoc, and Enterobacter were subsequently recovered as the dominant genera in first and third trimester samples, but they had a lower abundance compared to the NP group. In addition, the genera Klebsiella, Streptococcus, and Staphylococcus were isolated at a higher relative abundance from the first trimester samples compared to the NP group. The species Escherichia coli, Enterobacter cloacae, Lactococcus lactis, Lactococcus garvieae, Stenotrophomonas maltophilia, and F. johnsoniae dominated isolates from the NP group, but they were either profoundly reduced or absent from the first and third trimester samples.
GM resistome analysis
Out of 14,694 tested isolates, 5,837 isolates were resistant to a single antibiotic, 1,192 isolates were resistant to two antibiotics, and 847 were resistant to three antibiotics. Several isolates were resistant to four (142 isolates), five (82 isolates), and six (25 isolates) antibiotics (Figure S5). The highest resistance was observed against trimethoprim/sulfamethoxazole (15%), with 25 different species, most of which belonged to the genera Enterococcus and Enterobacter. Metronidazole (14%), cycloserine (12%), and cefixime (10%) were associated with higher resistance in 32, 29, and 25 different species, respectively. Ciprofloxacin and carbenicillin were the most effective antibiotics, with the lowest abundance and diversity of resistant bacteria being detected (Figure S5B). Two bacterial species from the genera Escherichia and Brevundimonas showed resistance to ciprofloxacin. Approximately 8% of the total isolates were simultaneously resistant to two different antibiotics. The combinations of metronidazole and azithromycin (18%), trimethoprim/sulfamethoxazole and oxytetracycline (11%), and cycloserine and metronidazole (9%) were the most dual resistant patterns (Figure S5C). Similarly, 6% of the isolates were resistant to different triple-antibiotic combinations. Among these, approximately 26% of the resistant isolates were resistant to metronidazole, trimethoprim/sulfamethoxazole, and azithromycin (Figure S5D).
Forty-eight percent of the resistant isolates belonged to phylum Firmicutes, whereas 47% resistant isolates were identified as being from phylum Proteobacteria. Enterobacteriaceae, Enterococcaceae, and Streptococcaceae were the most resistant families. Out of 73 resistant species, most of the resistant isolates belonged to Enterococcus genus followed by Klebsiella and Escherichia (Figure S6). Among the multiple resistant species, 38 were found to be resistant against two antibiotics; 28 species were resistant to different combinations of three antibiotics, and seven species showed resistance against combinations of four or five different antibiotics.
Comparison of GM resistome between NP and pregnant groups
A total of four resistant phyla were observed in the NP group, among which Proteobacteria and Firmicutes were abundantly present. The abundance of resistant species from Proteobacteria was much lower in samples from pregnant women (particularly third trimester samples) (). Samples from the pregnant groups were abundant in resistant species from phylum Firmicutes. Most of the resistant species were from the families Enterobacteriaceae, Enterococcaceae, and Streptococcaceae. The most dominant antibiotic-resistant families shifted in the samples from the pregnant groups compared to the NP group, with a clear reduction in the family Enterobacteriaceae and an increase in Enterococcaceae ().
Figure 3 Comparisons of the relative abundance of antibiotic-resistant taxa. (A) A comparison of the relative abundance of antibiotic-resistant phyla. (B) A comparison of the relative abundance of antibiotic-resistant families. (C) A comparison of the relative abundance of antibiotic-resistant genera. Data are shown as percentile abundances in each group. Before statistical analysis, count data were transformed with the Hellinger method and analyzed for normality. Taxa with normal distribution were analyzed using ANOVA with Dunnett's post hoc test, while non-normal data were analyzed with Kruskal–Wallis and p-values were corrected.
Abbreviations: NP, non-pregnant group; 1st-Trim, first trimester; 3rd-Trim, third trimester.
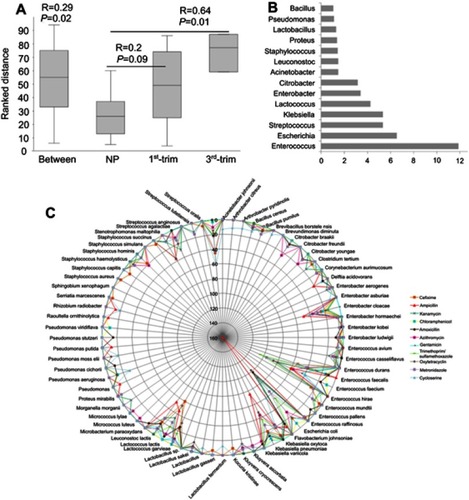
A total of 31 resistant genera were identified. Among the most dominant genera, Enterococcus, Enterobacter, Streptococcus, and Citrobacter were substantially dissimilar between the pregnant and NP groups (). In addition, the abundance of the Enterobacter, one of the dominant antibiotic-resistant genera, was significantly lower (p<0.05) in pregnant group samples. Although pregnant and NP groups were harboring similar (p=0.02) antibiotic-resistant genera, the correlation was lower (R=0.29) (). Therefore, to further elucidate the similarity/dissimilarity index, SIMPER analysis was performed. We found 55.35% dissimilarity among the groups by analyzing antibiotic-resistant genera. Genera that were mainly contributing to dissimilarity among the groups (dissimilarity score >1%) were retrieved and filtered, and the results are presented in . Overall, the abundance and diversity of the antibiotic-resistant species were higher in the NP group followed by the first and third trimester groups. The total diversity of antibiotic-resistant species is presented in .
Figure 4 Similarity analysis among the groups on the basis of antibiotic-resistant genera and list of total resistant bacteria. (A) ANOSIM was performed using Euclidean similarity with permutation N=9999. Pairwise p-values were corrected with sequential Bonferroni tests. (B) SIMPER test was performed to determine major bacteria that differentiate the antibiotic-resistance profiles of the studied groups. (C) Network presentation of total resistant species with abundance for resistance to antimicrobials. The circular lines are scaled to show the corresponding abundance of each species. The color of the lines represents different antimicrobials.
Abbreviations: ANOSIM, Analysis of similarities; NP, non-pregnant group; 1st-Trim, first trimester; 3rd-Trim, third trimester.
Moreover, to determine group-specific antimicrobial-resistant bacteria, we observed that isolates from the genus Klebsiella were substantially higher in first trimester samples encoding resistance to amoxicillin and metronidazole compared to the NP group (Figure S7, S8). Isolates from the genera Lactobacillus and Enterococcus in third trimester samples were particularly resistant to cycloserine (Figure S7). In addition, ampicillin-resistant Escherichia was profoundly increased in third trimester samples compared to first trimester samples (Figure S7).
Evaluation of ARGs
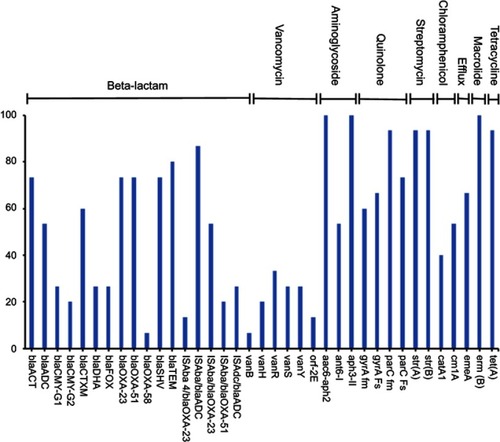
A total of 37 unique ARGs conferring resistance to 9 various classes of antibiotics were detected in the genomic DNA extracted from the 24 stool samples of pregnant and NP groups (). The number of detected resistance genes per sample ranged between 12 and 27. Out of 47 studied genes, nine ARGs were detected in >80% of the samples (). The common set of resistance genes detected in ≥70% of the tested samples included aminoglycoside resistance genes (aac6-aph2, aph 3-II, strA, and strB), macrolide resistance genes (ermB), quinolone resistance genes (parC fm and parC Fs), β-lactamase (blaTEM) and tetracycline resistance gene (tetA) (). Genes associated with major antibiotic resistance threats, including ESBLs encoding genes (blaCTX-M), the carbapenem resistance–associated genes (blaOXA-23-like and blaOXA-51-like) and their IsAba element were also detected in several subjects. Fewer samples were positive for vancomycin and blaOXA-58-like resistance genes (). Moreover, no pattern was noticed in ARGs' abundance between pregnant and NP groups.
Figure 5 Percentage abundance of the antimicrobial resistance genes amplified from the stool samples.
Discussion
This study used both culturomic and metagenomic approaches to investigate total GM diversity, AMR profiles between trimesters, and pregnancy-associated GM changes in Saudi females. We observed pregnancy-associated phyla modulations; discriminately clustered in the pregnant groups compared to the NP group and indicated a resemblance between NP and first trimester groups compared to the third trimester group. A closer linkage in GM composition between control and first trimester samples has also been reported through 16S amplicon sequencing approach.Citation2
To profile antibiotic-resistant species in the human gut, we observed that about 95% of the antibiotic-resistant species belonged to Firmicutes and Proteobacteria. Both of these phyla are commensally abundant in the human gut and have substantial diversity in antibiotic-resistant species.Citation6,Citation38 At the genus level, Enterococcus was the most abundant and diverse resistant genus in our sample population, with Enterococcus faecalis and Enterococcus faecium being the most abundant. A total of ten different species from the genus Enterococcus were isolated, some of which possessed resistance against ten different antibiotics. Enterococcus is one of the major pathogen-containing genera, ubiquitously present in the ecosystem (especially in the gut of humans and poultry) and able to acquire multiple AMR.Citation39 In a pregnant mouse model, Tan et al showed that E. faecalis can translocate into blood, spleen, and placenta.Citation40 We suggest further studies to elucidate AMR profiling and pathogenicity of the genus Enterococcus during pregnancy.
As in other studies, we also observed a higher abundance of Klebsiella, Enterobacter, and Lactococcus in the gut of NP Saudi women.Citation41–Citation43 Specifically, Klebsiella pneumoniae is an emerging antibiotic-resistant pathogen worldwide and is responsible for hospital-acquired infections (especially bloodstream infections) and pneumonia in newborns and immune-compromised patients.Citation44 Furthermore, E. coli was the most abundant antibiotic resistant species. The bacterium was abundant in both the control and the pregnant groups. Multiple- antibiotic-resistant E. coli is prevalent throughout Saudi ArabiaCitation45,Citation46 and has been isolated from agricultural fields, hospitals, food, water, and public places.Citation46,Citation47 Antibiotic-resistant E. coli is endemic worldwide, and many countries are failing to control its spread. Although E. coli is a commensal type of bacteria in the human gut, the AMR could potentially spread and contribute to pathogenicity (especially during pregnancy).
The abundance of antibiotic-resistant species varied greatly among samples and groups. Overall, the antibiotic-resistance abundance was higher in NP group samples, whereas samples from pregnant groups were abundantly inhabited by commensal opportunistic pathogens from the genera Enterococcus, Klebsiella, Streptococcus, and Staphylococcus.Citation41,Citation48,Citation49 Moreover, all the tested (Antimicrobials) AMs confronted resistance. The highest bacterial resistance was detected against trimethoprim/sulfamethoxazole, metronidazole, cycloserine, and cefixime; whereas, lower resistance was recorded against ciprofloxacin and chloramphenicol. High resistance observed against metronidazole is probably because of its main activity against anaerobic bacteria, whereas isolates identified in this study are mainly aerobic and facultative anaerobic. The increase in resistance toward trimethoprim/sulfamethoxazole, cycloserine, and cefixime could be attributed to misuse of AMs in Saudi Arabia.Citation12,Citation45 A higher prevalence of AMR is an emerging problem that has been associated with disease outbreaks and mortality in Saudi Arabia.Citation45,Citation46 Non-optimized and improper practices of AMs' prescription, high numbers of people traveling in pilgrimage, and a large population of expatriates could be a few of the causes for the emergence of AMR in Saudi Arabia.Citation12,Citation45 Moreover, chicken is a commonly consumed food in Saudi Arabia, and multiple- antibiotic-resistant bacterial species have been detected in the meat of chickens in Saudi Arabia,Citation50 which could contribute to the higher prevalence of antibiotic-resistant gut bacteria in the Saudi population. This abundance of AMR is a serious concern. Thoughtful and rapid efforts are urgently needed for AMs' monitoring and profiling of AMR across the country.
Furthermore, as Saudi Arabian female GM composition has not been previously published, we were interested to document total GM composition and pregnancy-associated changes using 16S amplicon sequencing. Being a reserved society, people are reluctant to provide stool samples.Citation51 Our results are in agreement with published studies and observed variation in GM composition, and modulation with pregnancy in Saudi population from other geographical regions.Citation2,Citation9,Citation10 GM diversity and composition were substantially remodeled from the first trimester to the third. The OTU richness and abundance in samples from the first trimester group were more comparable with those in the NP group than the third trimester group. Abundance of the proinflammatory phylum (Proteobacteria) was enriched during pregnancy and species' diversity was lower in the third trimester group. Such aberrations have been associated with several health problems.Citation52,Citation53 In contrast, few studies have reported that these changes help in sustaining a healthy pregnancy.Citation1,Citation2
Besides the phylum Proteobacteria, the phylum Firmicutes was also enriched during pregnancy, which was mainly related to the increased diversity and abundance of taxa from class Clostridia during pregnancy. Species from this class are involved in energy uptake and adiposityCitation54,Citation55 that support the growth and protection of the fetus. The phylum Bacteroidetes was significantly reduced during pregnancy. The decrease in Bacteroidetes' abundance was mainly related to pregnancy-induced decline in the families Prevotellaceae, Bacteroidaceae, Lachnospiraceae, and Sutterellaceae. These families are associated with host energy metabolism.Citation56 Besides, our data have limitations of a comparatively wide range of BMI and age. We do not rule out the implication of these factors in the differential bacterial composition among the studied groups. Further, prospective studies are recommended to analyze GM among pregnant and NP females of the same BMI and age group.
The family Prevotellaceae was abundantly represented with 12 different species, among which P. copri and P. stercorea were predominant. The abundance of both species was profoundly lower in samples from pregnant women. P. copri is one of the dominant human gut bacteria,Citation57 which is comparatively more abundant in non-WesternersCitation5 and improves intestinal permeability by degrading mucin.Citation58 The family Ruminococcaceae was discriminately enriched in third trimester samples. Ruminococcaceae is a metabolically active family that helps the host by providing short-chain fatty acids and degrading indigestible polysaccharides.Citation56 In addition, Ruminococcaceae are associated with anti-atopy properties,Citation59 and their enrichment during the third trimester could lead to a higher level in infants that could be helpful in preventing atopic reactions.
In agreement with other studies,Citation2,Citation5 we noticed a higher abundance of butyrate-producing species, such as F. prausnitzii, Faecalibacterium spp., Eubacterium rectale, and B. vulgatus. Similarly, the other butyrate-producing genera from the class Clostridia (such as Moryella and Anaerococcus)Citation60 were uniquely present in samples from pregnant women. Butyrate contributes to the maintenance of normal blood pressure and the intestinal lining, and provides energy to colonocytes.Citation61 In addition, fiber-degrading species (such as Succinivibrio spp.) and resistant-starch-degrading species (such as Oscillospira spp.) also have relatively high abundance during pregnancy.Citation5,Citation62 The pregnancy-associated increase in species that degrade resistant starch and fiber could be helpful in meeting the high-energy demand that occurs during pregnancy.
In general, data generated from metagenomics and culturomics were dissimilar in species' diversity and abundance. The dominant species detected through metagenomics were absent in culturomics and vice versa. The possible reasons could include the limitation of appropriate growth conditions, the composition of media being unable to promote the growth of certain bacteria, the loss of some species during sample dilution, and the secretion of bacteriocins by some bacteria that inhibit the growth of other bacteria. Although culturomics is laborious, it is effective in detecting minor flora. We were able to isolate 132 species, out of which 113 were undetected in metagenomic data. In agreement with Lagier et al,Citation63 we suggest that multiple types of growth conditions could maximize bacterial diversity; however, the gap between culturomics and metagenomics could be reduced by improving the DNA extraction protocol.
Conclusion
GM composition was substantially remodeled with pregnancy and affected bacterial diversity. GM harbors diverse antibiotic resistance that is unrelated to an individual’s age, BMI, or pregnancy status; however, such a higher abundance of antibiotic resistance could be a potential source for the emergence of new antibiotic-resistant bacteria in the gut ecosystem. Culturomics should be conducted in addition to metagenomics to obtain a more complete profile and a better understanding of functional repertoires. Further studies are recommended to investigate evolutionary aspects of ARGs in GM and their consequences on pregnancy and the fetus.
Author contributions
All authors contributed to data analysis, drafting or revising the article, gave final approval of the version to be published, and agree to be accountable for all aspects of the work.
Acknowledgments
This project was funded by the National Plan for Science, Technology and Innovation (MAARIFAH) - King Abdulaziz City for Science and Technology - the Kingdom of Saudi Arabia - award number (12MED3108-03). The authors also acknowledge with thanks the Science and Technology Unit, King Abdulaziz University for their technical support.
Disclosure
The authors report no conflicts of interest in this work.
References
- Gohir W, Whelan FJ, Surette MG, Moore C, Schertzer JD, Sloboda DM. Pregnancy-related changes in the maternal gut microbiota are dependent upon the mother’s periconceptional diet. Gut Microbes. 2015;6(5):310–320. doi:10.1080/19490976.2015.108605626322500
- Koren O, Goodrich JK, Cullender TC, et al. Host remodeling of the gut microbiome and metabolic changes during pregnancy. Cell. 2012;150(3):470–480. doi:10.1016/j.cell.2012.07.00822863002
- Carding S, Verbeke K, Vipond DT, Bm C, Lj O. Dysbiosis of the gut microbiota in disease. Microb Ecol Health Dis. 2015;26:26191.25651997
- Dethlefsen L, Relman DA. Incomplete recovery and individualized responses of the human distal gut microbiota to repeated antibiotic perturbation. Proc Natl Acad Sci U S A. 2011;108 Suppl 1:4554–4561. doi:10.1073/pnas.100008710720847294
- Pedersen HK, Gudmundsdottir V, Nielsen HB, et al. Human gut microbes impact host serum metabolome and insulin sensitivity. Nature. 2016;535(7612):376–381. doi:10.1038/nature1864627409811
- Hu Y, Yang X, Qin J, et al. Metagenome-wide analysis of antibiotic resistance genes in a large cohort of human gut microbiota. Nat Commun. 2013;4:2151. doi:10.1038/ncomms315123877117
- Candela M, Biagi E, Maccaferri S, Turroni S, Brigidi P. Intestinal microbiota is a plastic factor responding to environmental changes. Trends Microbiol. 2012;20(8):385–391. doi:10.1016/j.tim.2012.05.00322672911
- Avershina E, Ravi A, Storro O, Oien T, Johnsen R, Rudi K. Potential association of vacuum cleaning frequency with an altered gut microbiota in pregnant women and their 2-year-old children. Microbiome. 2015;3:6526687338
- Collado MC, Isolauri E, Laitinen K, Salminen S. Distinct composition of gut microbiota during pregnancy in overweight and normal-weight women. Am J Clin Nutr. 2008;88(4):894–899. doi:10.1093/ajcn/88.4.89418842773
- Jost T, Lacroix C, Braegger C, Chassard C. Stability of the maternal gut microbiota during late pregnancy and early lactation. Curr Microbiol. 2014;68(4):419–427. doi:10.1007/s00284-013-0491-624258611
- Modi SR, Collins JJ, Relman DA. Antibiotics and the gut microbiota. J Clin Invest. 2014;124(10):4212–4218. doi:10.1172/JCI7233325271726
- Bin Abdulhak AA, Altannir MA, Almansor MA, et al. Non prescribed sale of antibiotics in Riyadh, Saudi Arabia: a cross sectional study. BMC Public Health. 2011;11:538. doi:10.1186/1471-2458-11-53821736711
- Broe A, Pottegard A, Lamont RF, Jorgensen JS, Damkier P. Increasing use of antibiotics in pregnancy during the period 2000-2010: prevalence, timing, category, and demographics. Bjog-Int J Obstet Gy. 2014;121(8):988–996. doi:10.1111/1471-0528.12806
- Crespin S, Bourrel R, Hurault-Delarue C, Lapeyre-Mestre M, Montastruc JL, Damase-Michel C. Drug prescribing before and during pregnancy in South West France a retrolective study. Drug Saf. 2011;34(7):595–604. doi:10.2165/11589170-000000000-0000021663335
- Khan I, Azhar EI, Abbas AT, et al. Metagenomic analysis of antibiotic-induced changes in gut microbiota in a pregnant rat model. Front Pharmacol. 2016;7:104. doi:10.3389/fphar.2016.0032327199748
- Ventola CL. The antibiotic resistance crisis: part 1: causes and threats. P T. 2015;40(4):277–283.25859123
- Sommer MOA, Dantas G, Church GM. Functional characterization of the antibiotic resistance reservoir in the human microflora. Science. 2009;325(5944):1128–1131. doi:10.1126/science.117695019713526
- Fouhy F, Ross RP, Fitzgerald GF, Stanton C, Cotter PD. A degenerate PCR-based strategy as a means of identifying homologues of aminoglycoside and beta-lactam resistance genes in the gut microbiota. BMC Microbiol. 2014;14:2524499167
- Arias CA, Murray BE. The rise of the enterococcus: beyond vancomycin resistance. Nat Rev Microbiol. 2012;10(4):266–278. doi:10.1038/nrmicro276122421879
- van Schaik W. The human gut resistome. Philos Trans R Soc Lond B Biol Sci. 2015;370(1670):20140087. doi:10.1098/rstb.2014.023025918444
- Jamieson DJ, Theiler RN, Rasmussen SA. Emerging infections and pregnancy. Emerg Infect Dis. 2006;12(11):1638–1643. doi:10.3201/eid1211.06015217283611
- Pehrsson EC, Tsukayama P, Patel S, et al. Interconnected microbiomes and resistomes in low-income human habitats. Nature. 2016;533(7602):212–216. doi:10.1038/nature1767227172044
- Giakoumelou S, Wheelhouse N, Cuschieri K, Entrican G, Howie SE, Horne AW. The role of infection in miscarriage. Hum Reprod Update. 2016;22(1):116–133. doi:10.1093/humupd/dmv04126386469
- Matovina M, Husnjak K, Milutin N, Ciglar S, Grce M. Possible role of bacterial and viral infections in miscarriages. Fertil Steril. 2004;81(3):662–669. doi:10.1016/j.fertnstert.2003.08.02015037417
- Masella AP, Bartram AK, Truszkowski JM, Brown DG, Neufeld JD. PANDAseq: paired-end assembler for illumina sequences. BMC Bioinformatics. 2012;13:31. doi:10.1186/1471-2105-13-3122333067
- Angelakis E, Yasir M, Bachar D, et al. Gut microbiome and dietary patterns in different Saudi populations and monkeys. Sci Rep. 2016;6:32191. doi:10.1038/srep3219127578328
- Lagier JC, Hugon P, Khelaifia S, Fournier PE, La Scola B, Raoult D. The rebirth of culture in microbiology through the example of culturomics to study human gut microbiota. Clin Microbiol Rev. 2015;28(1):237–264. doi:10.1128/CMR.00014-1425567229
- La Scola B, Khelaifia S, Lagier JC, Raoult D. Aerobic culture of anaerobic bacteria using antioxidants: a preliminary report. Eur J Clin Microbiol Infect Dis. 2014;33(10):1781–1783. doi:10.1007/s10096-014-2137-424820294
- Angelakis E, Yasir M, Azhar EI, et al. MALDI-TOF mass spectrometry and identification of new bacteria species in air samples from Makkah, Saudi Arabia. BMC Res Notes. 2014;7:892. doi:10.1186/1756-0500-7-89225491533
- Yasir M, Aslam Z, Kim SW, Lee SW, Jeon CO, Chung YR. Bacterial community composition and chitinase gene diversity of vermicompost with antifungal activity. Bioresour Technol. 2009;100(19):4396–4403. doi:10.1016/j.biortech.2009.04.01519423335
- Andrews JM. Determination of minimum inhibitory concentrations. J Antimicrob Chemother. 2001;48(Suppl 1):5–16.11420333
- Khan I, Yasir M, Kumosani T, et al. Assessment of bacterial density, diversity, and antibiotic resistance-dissemination from multidrug-resistant escherichia coli to rat’s gut microbiota in presence and absence of antibiotic treatment: a useful animal model for future investigations. Int J Appl Res Vet M. 2016;14(2):170–184.
- D’Costa VM, McGrann KM, Hughes DW, Wright GD. Sampling the antibiotic resistome. Science. 2006;311(5759):374–377. doi:10.1126/science.112080016424339
- Walsh F. Investigating antibiotic resistance in non-clinical environments. Front Microbiol. 2013;4:19. doi:10.3389/fmicb.2013.0007723423602
- Paliy O, Shankar V. Application of multivariate statistical techniques in microbial ecology. Mol Ecol. 2016;25(5):1032–1057. doi:10.1111/mec.1353626786791
- Dixon P. VEGAN, a package of R functions for community ecology. J Veg Sci. 2003;14(6):927–930. doi:10.1111/j.1654-1103.2003.tb02228.x
- McMurdie PJ, Holmes S. Shiny-phyloseq: web application for interactive microbiome analysis with provenance tracking. Bioinformatics. 2015;31(2):282–283. doi:10.1093/bioinformatics/btu61625262154
- Lanza VF, Tedim AP, Martinez JL, Baquero F, Coque TM. The plasmidome of firmicutes: impact on the emergence and the spread of resistance to antimicrobials. Microbiol Spectr. 2015;3(2):PLAS-0039–2014. doi:10.1128/microbiolspec.PLAS-0039-2014
- Guerrero-Olmos K, Baez J, Valenzuela N, Gahona J, Del Campo R, Silva J. Molecular characterization and antibiotic resistance of enterococcus species from gut microbiota of Chilean Altiplano camelids. Infect Ecol Epidemiol. 2014;4:24714.
- Tan Q, Xu H, Xu F, et al. Survival, distribution, and translocation of enterococcus faecalis and implications for pregnant mice. FEMS Microbiol Lett. 2013;349(1):32–39. doi:10.1111/1574-6968.1228024131236
- Ispirli H, Demirbas F, Dertli E. Characterization of functional properties of enterococcus faecium strains isolated from human gut. Can J Microbiol. 2015;61(11):861–870. doi:10.1139/cjm-2015-044626485327
- Katouli M. Population structure of gut Escherichia coli and its role in development of extra-intestinal infections. Iran J Microbiol. 2010;2(2):59–72.22347551
- Raymond F, Ouameur AA, Deraspe M, et al. The initial state of the human gut microbiome determines its reshaping by antibiotics. Isme J. 2016;10(3):707–720. doi:10.1038/ismej.2015.14826359913
- WHO. Antimicrobial resistance. Available from: http://www.who.int/mediacentre/factsheets/fs194/en/. Accessed March 28, 2019.
- Zowawi HM. Antimicrobial resistance in Saudi Arabia. An urgent call for an immediate action. Saudi Med J. 2016;37(9):935–940. doi:10.15537/smj.2016.9.1613927570847
- Yasir M, Ajlan AM, Shakil S, et al. Molecular characterization, antimicrobial resistance and clinico-bioinformatics approaches to address the problem of extended-spectrum beta-lactamase-producing Escherichia coli in western Saudi Arabia. Sci Rep. 2018;8(1):14847. doi:10.1038/s41598-018-33093-830287889
- Mantilla-Calderon D, Jumat MR, Wang T, Ganesan P, Al-Jassim N, Hong PY. Isolation and characterization of NDM-positive escherichia coli from municipal wastewater in Jeddah, Saudi Arabia. Antimicrob Agents Chemother. 2016;60(9):5223–5231. doi:10.1128/AAC.00236-1627324770
- Brown SP, Cornforth DM, Mideo N. Evolution of virulence in opportunistic pathogens: generalism, plasticity, and control. Trends Microbiol. 2012;20(7):336–342. doi:10.1016/j.tim.2012.04.00522564248
- Kriebs JM. Staphylococcus infections in pregnancy: maternal and neonatal risks. J Perinat Neonatal Nurs. 2016;30(2):115–123. doi:10.1097/JPN.000000000000016527104602
- Al-Ghamdi MS, El-Morsy F, Al-Mustafa ZH, Al-Ramadhan M, Hanif M. Antibiotic resistance of Escherichia coli isolated from poultry workers, patients and chicken in the eastern province of Saudi Arabia. Trop Med Int Health. 1999;4(4):278–283.10320654
- Yasir M, Angelakis E, Bibi F, et al. Comparison of the gut microbiota of people in France and Saudi Arabia. Nutr Diabetes. 2015;5:e153. doi:10.1038/nutd.2015.325915742
- Claesson MJ, Jeffery IB, Conde S, et al. Gut microbiota composition correlates with diet and health in the elderly. Nature. 2012;488(7410):178–184. doi:10.1038/nature1131922797518
- Khan I, Yasir M, Azhar EI, et al. Implication of gut microbiota in human health. CNS Neurol Disord Drug Targets. 2014;13(8):1325–1333.25345506
- Collado MC, Isolauri E, Laitinen K, Salminen S. Effect of mother’s weight on infant’s microbiota acquisition, composition, and activity during early infancy: a prospective follow-up study initiated in early pregnancy. Am J Clin Nutr. 2010;92(5):1023–1030. doi:10.3945/ajcn.2010.2987720844065
- Ley RE, Backhed F, Turnbaugh P, Lozupone CA, Knight RD, Gordon JI. Obesity alters gut microbial ecology. Proc Natl Acad Sci U S A. 2005;102(31):11070–11075. doi:10.1073/pnas.050497810216033867
- Gomez-Arango LF, Barrett HL, McIntyre HD, et al. Connections between the gut microbiome and metabolic hormones in early pregnancy in overweight and obese women. Diabetes. 2016;65(8):2214–2223. doi:10.2337/db16-027827217482
- Ley RE. Gut microbiota in 2015: prevotella in the gut: choose carefully. Nat Rev Gastroenterol Hepatol. 2016;13(2):69–70. doi:10.1038/nrgastro.2016.426828918
- Brown CT, Davis-Richardson AG, Giongo A, et al. Gut microbiome metagenomics analysis suggests a functional model for the development of autoimmunity for type 1 diabetes. PLoS One. 2011;6(10):e25792. doi:10.1371/journal.pone.002579222043294
- Simonyte Sjodin K, Vidman L, Ryden P, West CE. Emerging evidence of the role of gut microbiota in the development of allergic diseases. Curr Opin Allergy Clin Immunol. 2016;16(4):390–395. doi:10.1097/ACI.000000000000027727253486
- Carlier JP, K’Ouas G, Han XY. Moryella indoligenes gen. nov., sp. nov., an anaerobic bacterium isolated from clinical specimens. Int J Syst Evol Microbiol. 2007;57(Pt 4):725–729. doi:10.1099/ijs.0.64705-017392195
- Gomez-Arango LF, Barrett HL, McIntyre HD, et al. Increased systolic and diastolic blood pressure is associated with altered gut microbiota composition and Butyrate production in early pregnancy. Hypertension. 2016;68(4):974–981. doi:10.1161/HYPERTENSIONAHA.116.0791027528065
- Upadhyaya B, McCormack L, Fardin-Kia AR, et al. Impact of dietary resistant starch type 4 on human gut microbiota and immunometabolic functions. Sci Rep. 2016;6:28797. doi:10.1038/srep2879727356770
- Lagier JC, Khelaifia S, Alou MT, et al. Culture of previously uncultured members of the human gut microbiota by culturomics. Nat Microbiol. 2016;1:16203. doi:10.1038/nmicrobiol.2016.20327819657