
Abstract
Objective
The objective of the study was to assess magnetic resonance (MR) planimetric measurements and MR parkinsonism index (MRPI) in differentiating progressive supranuclear palsy (PSP) from Parkinson’s disease (PD) using 1.5 and 3 T MRI scanner.
Subjects and methods
After ethical approval was obtained, analysis of 34 consecutive patients with PSP, 34 patients with PD and 34 healthy controls (HCs) was performed. HCs were age-matched adults without any history of neurodegenerative disease or movement disorders. Retrospective data from the past 10 years (from January 2006 to December 2015) were obtained from the Hospital Information Management System, and informed consent was obtained from all participants. The measurements of pons area–midbrain area ratio (P/M) and MCP width–superior cerebellar peduncle (SCP) width ratio (MCP/SCP) were used, and MRPI was calculated by the formula ([P/M]×[MCP/SCP]).
Results
Midbrain area and SCP width in patients with PSP (19 males, 15 females; mean age =66.7 years) were significantly (P<0.001) smaller than in patients with PD (20 males, 14 females; mean age =66.7 years) and control participants (17 males, 17 females; mean age =66.1 years). P/M and MCP/SCP were significantly higher in patients with PSP than in patients with PD and control participants. All measurements showed some overlap of values between patients with PSP and patients from PD group and control participants. MRPI value was significantly higher in patients with PSP (mean 21.00) than in patients with PD (mean 9.50; P<0.001) and control participants (mean 9.6; P<0.001), without any overlap of values among groups. No correlation was found between the duration of disease, PSP rating scale, PSP staging system and MRPI in this study. No patient with PSP received a misdiagnosis when the index was used (sensitivity and specificity, 100%).
Conclusion
MRPI should be made an essential part of all MRI brain reporting whenever differentiation between PD and PSP is sought for.
Introduction
Progressive supranuclear palsy (PSP), also called Steele–Richardson–Olszewski syndrome, is a neurodegenerative disorder represented by supranuclear vertical gaze palsy, postural instability and frequent falls, parkinsonian features, cognitive impairment and speech disturbances.Citation1 PSP is characterized by early and severe postural instability, with falls in the first year of disease onset, supranuclear gaze palsy and slowing of vertical saccades. Other characteristics include rapid disease progression and reduced response to medication.
For decades, the diagnosis of parkinsonian disorders has relied upon the presence and progression of characteristic clinical features. To establish a diagnostic consensus, various sets of clinical criteria have been proposed for diagnosis of parkinsonian disorders such as Parkinson’s disease (PD) and PSP.Citation2–Citation4 Clinical criteria proposed by the National Institute for Neurological Disorders and Society for PSP describe categorization of PSP into possible, probable and definite subtypes, depending on mandatory inclusion, supportive and exclusion criteria in detail.Citation3 Idiopathic PD, PSP and multiple system atrophy can be difficult to be differentiated clinically, particularly early in the disease course.Citation5 On the other hand, clinical diagnostic classification of PD based on Movement Disorder Society Clinical Diagnostic Criteria for PD was proposed in 2015 by Postuma et al.Citation4 Movement Disorder Society diagnostic criteria defined “parkinsonism” as the presence of bradykinesia with at least one of rest tremor or rigidity. Once parkinsonism is diagnosed, supportive criteria for idiopathic PD include a clear response to dopaminergic therapy and/or the presence of levodopa-induced dyskinesias.Citation4
Despite these suggestive features, in many cases, all these clinical findings are not as clear-cut as it ideally could be and a great degree of overlap exists.Citation6 Various pathologic data have shown considerable false-positive and false-negative results if diagnosis is made only on the basis of clinical criteria. Misdiagnosis is especially common during the early stages of these disorders due to lack of classic clinical signs.Citation2 Undoubtedly, the definitive diagnostic test is neuropathologic confirmation for both the conditions, which is not possible routinely; however, there is a dire need for an alternative but highly accurate diagnostic tool to predict the prognosis and to guide management of these patients.
Magnetic resonance imaging (MRI) has a substantial role in the diagnosis of various movement disorders. Conventional MRI demonstrates symptomatic causes of parkinsonism, but does not show any specific finding in PD. In parkinsonism variants such as PSP, MRI reveals characteristic patterns of regional atrophy combined with signal changes or microstructural changes in the basal ganglia, pons, middle cerebellar peduncle and superior cerebellar peduncle (SCP) and cerebral subcortical white matter. PSP has unique morphologic and underlying molecular pathologic changes. The cellular characteristic is neurofibrillary degeneration; the distribution and intensity of damage to brainstem and basal ganglia are used to pathologically describe the disorder. A large number of studies aimed at evaluating the possible contribution of MRI to the diagnosis have been performed. The high spatial and contrast resolution combined with the multiplanar capability of MRI enables in vivo demonstration of loss of the bulk of central nervous system structures with the regional distribution pattern typical of some movement disorders.Citation7,Citation8 Pathologic findings suggest that midbrain and SCPs are atrophic in PSP; on the other hand, all these brain structures are spared in PD. The major changes are in substantia nigra, pars compacta and reticulata, globus pallidus, subthalamic nucleus, midbrain and reticular formation of pons. Degeneration of midbrain and pontine structures leads to identifiable changes of brainstem atrophy on MRI, with widening of cerebral aqueduct, thinning of midbrain tegmentum and fourth ventricular dilatation.Citation9,Citation10 We utilized the MR parkinsonism index, which is calculated by multiplying the pons area–midbrain area ratio by the middle cerebellar peduncle width–SCP width ratio, for the combined assessment at routine MR imaging of four brain structures differently involved in atypical parkinsonian syndromes. Magnetic resonance parkinsonism index (MRPI) has been proved to be an extremely reliable measure to distinguish patients with PSP from those with PD and control subjects, on an individual basis.Citation9
International studies have shown that PSP is more familiar than previously recognized, that it is frequently misdiagnosed and that it may initially present to various medical subspecialties.Citation1 The aim of this study was to evaluate the diagnostic accuracy of MRPI which reflects structural anatomic changes measured by quantitative MRI analysis and to propose MRI-based criteria to help the clinician to recognize these parkinsonian syndromes. Objective quantifications of brain structures using linear, surface and volumetric measurements have been reported before in international literatures;Citation6–Citation11 however, no local data has been ever reported regarding parkinsonism variants due to lack of awareness and clinical knowledge. To our knowledge, not a single research was ever performed on the diagnostic workup of PSP in Pakistan. Therefore, taking this into consideration, this research would play a pioneer role in the subspecialty of movement disorder and quantitative MRI parameters at a local level. Our study will broaden the research horizon, spark a new hope of research on this topic resulting in more availability of local data and would be helpful in assessing implication of international results in this part of world.
Subjects and methods
Patients’ inclusion and control participants
This study was conducted at the Aga Khan University Hospital, Karachi, Pakistan, after collecting retrospective data from past 10 years (from January 2006 to December 2015) from the Hospital Information Management System. Data were obtained after getting approval from the ethical review committee of Aga Khan University. Consent was obtained from all the patients at the time of admission and was maintained by ERC.
Data of 34 consecutive patients with clinically proven PSP, 34 patients with clinically proven PD and 34 healthy controls (HCs) were obtained. HCs were age-matched adults without any history of neurodegenerative disease or movement disorders. Findings of neurologic examination were obtained in each case. Established consensus criteria were fulfilled for the diagnosis of PSPCitation3 and PD.Citation5 All HCs had normal findings at neurologic examination. MRI images of brain were blindly reviewed by consultant neuroradiologist with at least 5 years of clinical experience. The measurements of middle cerebellar peduncle (MCP)–SCP width ratio (MCP/SCP) and pons–midbrain area ratio (P/M) were used for calculating MRPI; MRPI was calculated by the formula ([P/M]×[MCP/SCP]).
MRI protocols
All MRIs were performed using MAGNETOM® Avanto Siemens 1.5 T MR Scanner and Toshiba Vantage TITAN™ 3 T MR Scanner. All MR brain included axial intermediate-weighted and T2-weighted dual-echo fast spin echo (repetition time msec/echo time msec, 3500/10.2, 85; section thickness, 4 mm; frequency- and phase-encoding matrix, 288×224), transverse fluid-attenuated inversion recovery (repetition time msec/echo time msec/inversion time msec, 8000/120/2000; slice thickness, 4 mm; frequency- and phase-encoding matrix, 256×224), transverse T2-weighted gradient echo (500/15; section thickness, 4 mm; frequency- and phase-encoding matrix, 256×192; flip angle, 20°) and T1-weighted volumetric spoiled gradient echo (15.2/6.8; slice thickness, 0.6 mm; frequency- and phase-encoding matrix, 256×256; flip angle, 15°) sequences. A volumetric block of 45 mm (0.9 mm section thickness) tangent to the floor of the fourth ventricle was placed on the midsagittal plane to cover both SCPs completely. The resulting images in oblique-coronal plane were utilized for SCP width quantification.
Image interpretation
All the images were interpreted by an experienced consultant neuroradiologist and his clinical fellow in the Department of Radiology using Rogan-Delft Zillion Picture Archiving and Communication System on standard DICOM display monitor. The measurements of midbrain and pontine areas were performed on the midsagittal plane of T2-weighted MRI in all patients and HC participants, as described by Massey et al.Citation5
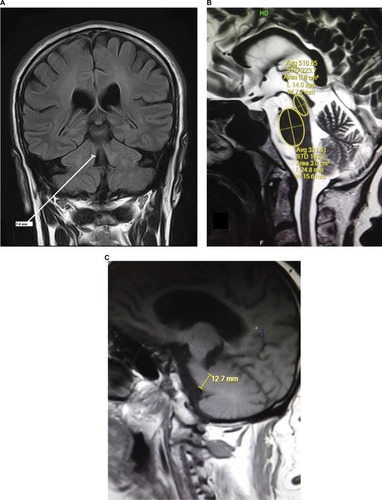
The reference image was taken as the midsagittal section of MR brain. Right and left MCPs were recognized on the parasagittal planes, and the distance between superior and inferior borders of MCPs was measured. Mean values were obtained from the right and left MCPs. Measurements of SCPs were obtained on coronal fluid-attenuated inversion recovery images which are an essential part of MRI brain protocol. Images were visually inspected in the anteroposterior direction to identify the first view on which the inferior colliculi and SCPs were separated. Average measurements of linear distance between the medial and lateral borders of both SCPs at the middle of their extension were calculated (). The pons–midbrain area ratio (P/M) and the MCP–SCP width ratio (MCP/SCP) were used for calculating an index that was termed as MRPI as follows: ([P/M]×[MCP/SCP]).Citation8
Figure 1 MRI brain images of this study in orthogonal planes showing measurement annotations and appropriate planes for measurements.
Abbreviation: FLAIR, fluid-attenuated inversion recovery.
Statistical analyses
Statistical analysis was performed with statistical software (SPSS for Windows, version 21.0; IBM Corporation, Armonk, NY, USA). The analysis used χ2 test followed by evaluation with pairwise test for comparison of two proportions, corrected according to Bonferroni method and one-way analysis of variance, and evaluation with unpaired t-test and Bonferroni correction to compare age at examination, disease duration and age at onset. To assess the differences in Hoehn–Yahr scores and MRI measurements among groups, the Kruskal–Wallis test was used, followed by evaluation with the Mann–Whitney U test for multiple comparisons.
Results
Thirty-four cases with clinical diagnosis of PD (20 males, 14 females; mean age =66.76±6.28; disease duration =6.3±3.86), 34 cases with clinical diagnosis of PSP (19 males, 15 females; mean age =66.76±6.27; disease duration =6.6±2.82) and 34 HC participants (17 males, 17 females; mean age =66.14±7.53) were studied. In all cases, age varied from 58 to 82 (mean age 66.55±6.66) years.
shows the demographic information of both patients’ groups and HC participants involved in this study. MR planimetric measurements of all three groups are presented in . All the measurements are the mean values calculated from individual measurements. Midbrain measurement revealed significantly smaller mean midbrain area of 96.02 mm2 in PSP subjects in comparison to PD patients (mean area of 145.58 mm2) and HC participants (mean area of 149.41 mm2). Similarly, the mean width of SCP in patients with PSP was 2.81 mm, which was significantly smaller than 4.33 mm in PD patients and 4.36 mm in HC participants (P<0.001). The analysis of MCP dimensions showed that PSP, PD and HC cases had mean values of 12.78, 12.81 and 13.4 mm, respectively. No significant difference was found between PD and HC participants regarding individual measurements of midbrain, pons, SCP and MCP. Comparison of P/M and MCP/SCP ratio among the three groups demonstrated significantly higher values in patients with PSP than HC participants and PD patients ( and ).
Figure 2 Box plot of P/M ratio in patients with PSP.
Abbreviations: P/M, pons area–midbrain area ratio; PD, Parkinson’s disease; PSP, progressive supranuclear palsy.
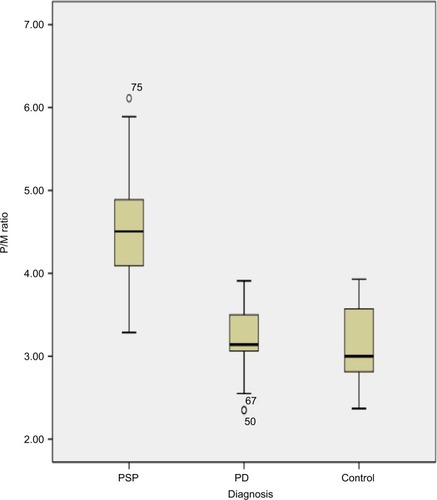
Figure 3 Box plot of MCP/SCP ratio in PSP patients (median =4.75; range, 3.14–6.35), PD patients (median =2.97; range, 1.92–4.77), control participants (median =3.0; range, 2.38–4.29).
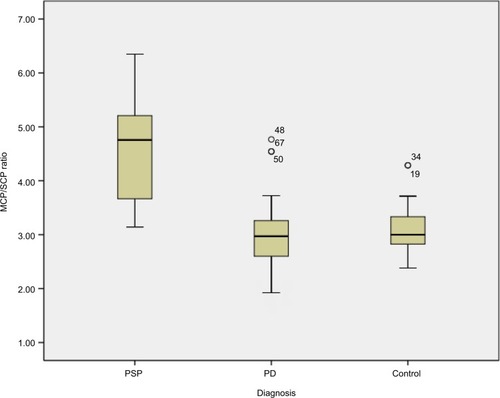
Table 1 Demographic data of PD and PSP patients along with healthy control participants involved in this study
Table 2 MR planimetric measurements in three different subgroups of this study
All obtained measurements showed minor overlap of values between patients with PSP and PD and HC participants. MRPI was significantly higher in PSP patients (mean 21) than PD patients (mean 9.50; P<0.001) and HC participants (mean 9.6; P<0.001), without overlapping of values among groups, as shown in . No correlation was found between the duration of disease, PSP rating scale, PSP staging system and MRPI in this study. None of the patients with PSP received a misdiagnosis when this index was applied (sensitivity and specificity, 100%). However, in this study, we found the sensitivity and specificity of MCP/SCP ratio to be 85% and 92.86%, respectively, and that the P/M ratio was 85.71% sensitive in differentiating PSP from PD, but showed more specificity (97.67%) and diagnostic accuracy (87.87%) due to overlapping individual values ().
Figure 4 Box plot of MRPI in PSP patients (median =21; range, 12.92–30.56), PD patients (median =9.5; range, 5.89–14.9), control participants (median =9.6; range, 6.67–14.29). MRPI values are higher in PSP patients compared to PD and HC.
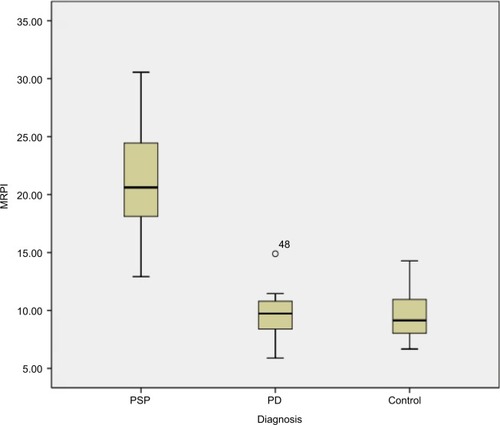
Table 3 Sensitivity and specificity of MRPI for the differentiation of PSP and PD
Pair wise comparative analysis using MRPI values between different groups showed statistical significance (P<0.001) between PD and PSP patients and between PSP patients and HC participants. On the other hand, no statistical significance was found between PD patients and HC participants in pair wise comparison using MRPI values ().
Table 4 All pairwise multiple comparison procedures taking MRPI values
Discussion
Among the neurodegenerative parkinsonian disorders, PSP is the second most common after idiopathic Parkinson’s disease.Citation2 Since levodopa responsiveness is poor and clinical deterioration is faster in PSP, it is important to be able to differentiate between idiopathic Parkinson’s disease and PSP.Citation12 It has been suggested that MR measurements of several brainstem structures could overcome the limitations inherent in the clinical diagnostic criteria for PSP.Citation8,Citation12,Citation13
In addition, quantitative measurements of brainstem structures have been reported to be useful in differentiating patients with PSP from those with PD.Citation19 Different brainstem measurements include P/M and MCP/SCP ratios; however, one study demonstrated that MRPI was more accurate than P/M in differentiating patients with possible PSP from those with PD and, as we have discussed earlier, that MRPI is calculated by the formula ([P/M]×[MCP/SCP]).Citation8,Citation20
Recent studies have shown extensive research work on MRPI, and a new automatic method for calculating the MRPI is formulated based on automatic algorithm, which helps in the early diagnosis of PSP with less time and more accuracy.Citation21
In a very interesting study, the researchers have compared morphometric markers (midbrain area, pons to midbrain area ratio and MRPI) with Diffusion Tensor Imaging parameters (infratentorial structures) and volumetric analysis (thalamus, putamen and pallidus nuclei), and surprisingly found that the morphometric assessment is the best single diagnostic marker and should be routinely included in the neuroradiologic work-up of parkinsonian patients.Citation22
The role of quantitative MRI in vascular parkinsonism was also analyzed by several studies, which revealed MRPI may represent an accurate tool in differentiating PSP from vascular parkinsonism, however, it is not discussed in detail in this article.Citation23
The role of regional distribution of white matter damage by using Diffusion Tensor Imaging also improves the diagnostic accuracy of MRI in the diagnosis of supranuclear palsy, not independently, but only in combination with MRPI.Citation24
In this study, we analyzed those neural structures that were primarily involved in PSP, in order to differentiate them from others. Atrophy of midbrain is the typical pathologic finding in PSP patients.Citation10 Neuroimaging findingsCitation15,Citation16 confirmed the diagnostic value of presence of midbrain atrophy in PSP patients and concluded that measurement of midbrain area could help in differentiation of PSP patients from PD patients. Our findings, however, reveal that measurement of midbrain area is unsuccessful to aid in distinction, on an individual basis, of patients with PSP from PD. In this study, the average midbrain area of PSP patients was significantly smaller than those of PD cases and HC participants, but individual values of midbrain area overlapped significantly with others.
MRPI is significantly higher in PSP patients than in HCs and PD cases. MRPI is proposed to distinguish PSP from PD on an individual basis. MRPI had a very high sensitivity, specificity and positive predictive value, when a cut-off of 13.5 was taken to discriminate rest of parkinsonian disorders from PSP.Citation9,Citation25
In this study, PSP had a mean MRPI of 21; on the other hand, the mean MRPI was 9.6 in HC and 9.5 in PD. The mean age at onset of the disease was 66.76 years, which is comparable to earlier studies. The average disease duration was found to be 6.6 years. Other studies have found a higher age at examination and longer disease duration. Therefore, MRPI can be helpful in differentiating PSP from PD in the early stages of the disease.Citation25–Citation27 However, further studies should be performed with large number of patients to obtain more reliable figures.
In this study, the midbrain area in PSP (mean 96.02 mm2) was significantly less than in PD (mean 145.58 mm2) and HC (mean 149.41 mm2). The individual values of midbrain area overlapped with other groups, making the differentiation difficult on an individual basis. This study also revealed slightly reduced mean pons area in PSP (430.73 mm2) than in PD (455.29 mm2). Our results were fairly comparable with the findings of previous international studies.Citation25,Citation28,Citation29
The mean SCP width in PSP was 2.81 mm, which was remarkably less than those of PD (4.33 mm) and HC (4.36 mm) subjects. Based on previous studies, mean SCP width <3 mm is thought to be associated with PSP. We did not find considerable difference in mean SCP width in PD and HC. Similarly, due to overlapping of individual values, SCP width could not differentiate PSP from other groups on an individual basis.Citation9,Citation15,Citation25,Citation29
Our data also suggest that mean MCP width in PSP (12.78 mm) was smaller than those of PD (12.81 mm) and HC (13.4 mm), but with a minor difference. Comparable results were observed in the data from previous studies.Citation9,Citation25,Citation28,Citation29
Comparing the MRPI values of our study and previous studies, MRPI of 21.4 was calculated by Morelli et al,Citation25 20.7 by Longoni et al,Citation29 18.63 by Hussl et al,Citation31 24.56 by Quattrone et alCitation9 and 23.48 by Sankhla et al.Citation30 In this study, mean MRPI was 21 in PSP, 9.5 in patients with PD and 9.6 in HC, a finding that is supportive with the results of other studies.Citation9,Citation25,Citation29,Citation31
As mentioned earlier, single brain measurements are unable to aid in differentiating PSP from other groups; rather, combined assessment of all four brain structures involved in this neurodegenerative process is proven to be more helpful. Single measurement of P/M ratio can differentiate PSP from PD and HCs in some casesCitation9,Citation15 The mean P/M ratio in PSP (4.54) was significantly higher than PD (3.18) and HC (3.08), with the values overlapping in individual cases. Overlapping of values between the PSP and other groups was also encountered in Morelli et al’s study.Citation25
We found, MRPI as 100% sensitive, specific and accurate in distinguishing PSP from PD, when a cut-off level of 13.5 was used. Our results showed higher statistical values than previous studies that also showed close to 90% sensitivity and specificity.
Morelli et al also reported that P/M ratio was unsuccessful to distinguish PSP from PD on an individual basis. They found a relatively higher sensitivity of 92.9%, but lower specificity, and diagnostic accuracy of 85.3% and 86.8%, respectively.Citation25 Hussl et al also reported relatively low sensitivity and diagnostic accuracy for the same.Citation1,Citation31
Correlation between MRPI and the disease duration was found by some researches,Citation9,Citation25 but we did not find any correlation of MRPI values with disease duration.
MRPI improved the diagnostic accuracy much more than that seen with the use of P/M ratio in discriminating PSP from PD because of the combined assessment of four brain structures involved in neurodegenerative disorders. Thus, atrophy of midbrain and SCP suggested the presence of PSP. These brain structures are usually not involved in PD. However, calculation of MRPI is more time consuming than calculation of the P/M ratio because it involves measurement of additional brain structures.
Our limitations were that we used clinical criteria for the diagnosis of PSP and we did not have a pathologic confirmation. Thus, it is likely that in some patients, the clinical diagnosis may be inaccurate. However, sensitivity and specificity of clinical diagnostic criteria for PSP are well documented, so the chances are unlikely. However, it is an important consideration that so far MRI brain is not a complete substitution for clinical and neuropathologic assessment. Thus, clinicians need to be acquainted with the diagnostic criteria for PSP and be sufficiently aware of the application of this method in patients’ clinical context.
Conclusion
In cases of clinically unclassifiable parkinsonism, MRPI is a reliable and accurate marker to predict the presence of PSP. In comparison to individual measurements such as midbrain to pons ratio or SCP to middle cerebellar peduncle ratio, it has superior diagnostic value as it accounts both measurements. It is also more reliable in early detection and can predict the disease on an individual basis without overlap.
Disclosure
The authors report no conflicts of interest in this work.
References
- BurnDJLAProgressive supranuclear palsy: where are we now?Lancet Neurol20021635936912849397
- LitvanIBhatiaKBurnDJMovement disorders society scientific issues committee report: SIC task force appraisal of clinical diagnostic criteria for parkinsonian disordersMov Disord200318546748612722160
- LitvanIAgidYCalneDClinical research criteria for the diagnosis of progressive supranuclear palsy (Steele Richardson-Olszewski syndrome): report of the NINDSSPSP international workshopNeurology1996471198710059
- PostumaRBBergDSternMMDS clinical diagnostic criteria for Parkinson’s diseaseMov Disord2015123015911601
- MasseyLAJagerHRPaviourDCThe midbrain to pons ratio: a simple and specific MRI sign of progressive supranuclear palsyNeurology2013208018561861
- GamaRLTavoraDBomfimRCSilvaCEBruinVMBruinPFMorphometry MRI in the differential diagnosis of parkinsonian syndromesArq Neuropsiquiatr2010368333338
- MascalchiMVellaACeravoloRMovement disorders: role of imaging in diagnosisJ Magn Reson Imaging201235223925622271273
- HauwJJDanielSDicksonDPreliminary NINDS neuropathologic criteria for Steele–Richardson–Olszewski syndrome (progressive supranuclear palsy)Neurology19944411201520197969952
- QuattroneANicolettiGMessinaDMR imaging index for differentiation of progressive supranuclear palsy from Parkinson disease and the Parkinson variant of multiple system atrophyRadiology2008246121422117991785
- AibaIHashizumeYYoshidaMOkudaSMurakamiNUjihiraNRelationship between brainstem MRI and pathological findings in progressive supranuclear palsy–study in autopsy casesJ Neurol Sci199715222102179415543
- MorelliMArabiaGNovellinoFMRI measurements predict PSP in unclassifiable parkinsonisms: a cohort studyNeurology201177111042104721832222
- HughesAJDanielSKilfordLLeesAJAccuracy of clinical diagnosis of idiopathic Parkinson’s disease: a clinico-pathological study of 100 casesJ Neurol Neurosurg Psychiatry19925531811841564476
- Warmuth-MetzMNaumannMCsotiISolymosiLMeasurement of the midbrain diameter on routine magnetic resonance imaging: a simple and accurate method of differentiating between Parkinson disease and progressive supranuclear palsyArch Neurol20015871076107911448296
- SungYHParkKHLeeYBMidbrain atrophy in subcortical ischemic vascular dementiaJ Neurol2009256121997200219618301
- ObaHYagishitaATeradaHNew and reliable MRI diagnosis for progressive supranuclear palsyNeurology2005642050205515985570
- KatoNAraiKHattoriTStudy of the rostral midbrain atrophy in progressive supranuclear palsyJ Neurol Sci20032101–2576012736089
- CosottiniMCeravoloRFaggioniLAssessment of midbrain atrophy in patients with progressive supranuclear palsy with routine magnetic resonance imagingActa Neurol Scand20071161374217587253
- RighiniAAntoniniAFerrariniMThin section MR study of the basal ganglia in the differential diagnosis between striatonigral degeneration and Parkinson diseaseJ Comput Assist Tomogr200226226627111884785
- KimBCChoiSMChoiKHMRI measurements of brainstem structures in patients with vascular parkinsonism, progressive supranuclear palsy, and Parkinson’s diseaseNeurol Sci201738462763328078564
- NigroSMorerlliMArabiaGMagnetic Resonance Parkinsonism Index and midbrain to pons ratio: which index better distinguishes Progressive Supranuclear Palsy patients with a low degree of diagnostic certainty from patients with Parkinson Disease?Parkinsonism Relat Disord201741313628487107
- NigroSArabiaGAntoniniAMagnetic Resonance Parkinsonism Index: diagnostic accuracy of a fully automated algorithm in comparison with the manual measurement in a large Italian multicentre study in patients with progressive supranuclear palsyEur Radiol20172762665267527761709
- ZanigniSCalandra-BuonauraGMannersDNAccuracy of MR markers for differentiating Progressive Supranuclear Palsy from Parkinson’s diseaseNeuroimage Clin20161173674227330973
- MostileGNicolettiACiceroCEMagnetic resonance parkinsonism index in progressive supranuclear palsy and vascular parkinsonismNeurol Sci201637459159526820655
- AgostaFPievaniMSvetelMDiffusion tensor MRI contributes to differentiate Richardson’s syndrome from PSP-parkinsonismNeurobiol Aging201233122817282622418735
- MorelliMArbiaGSalsoneMAccuracy of magnetic resonance parkinsonism index for differentiation of progressive supranuclear palsy from probable or possible Parkinson diseaseMov Disord201126352753321287599
- MasseyLAMicallefCPaviourDCConventional magnetic resonance imaging in confirmed progressive supranuclear palsy and multiple system atrophyMov Disord201227141754176222488922
- OsakiYBen-ShlomoYLeesAJAccuracy of clinical diagnosis of progressive supranuclear palsyMov Disord200419218118914978673
- MorelliMArabiaGMessinaDEffect of aging on magnetic resonance measures differentiating progressive supranuclear palsy from Parkinson’s diseaseMov Disord201429448849524573655
- LongoniGAgostaFKostićVSMRI measurements of brainstem structures in patients with Richardson’s syndrome, progressive supranuclear palsy-parkinsonism, and Parkinson’s diseaseMov Disord201126224725521412831
- SankhlaCSPatilKSawantNGuptaSDiagnostic accuracy of Magnetic Resonance Parkinsonism Index in differentiating progressive supranuclear palsy from Parkinson’s disease and controls in Indian patientsNeurol India201664223924526954800
- HusslAMahlknechtPScherflerCDiagnostic accuracy of the magnetic resonance Parkinsonism index and the midbrain-to-pontine area ratio to differentiate progressive supranuclear palsy from Parkinson’s disease and the Parkinson variant of multiple system atrophyMov Disord201025142444244920878992