Abstract
The prevalence of diet-induced obesity is increasing amongst adults and children worldwide, predisposing millions of people to an array of health problems that include metabolic syndrome, non-alcoholic fatty liver disease and non-alcoholic steatohepatitis. In this study we used experimental animals to investigate the effects of dietary obesity on markers of hepatic insulin signaling as well as structural changes in hepatocytes. Adult male Wistar rats were randomized and assigned to either a control group or a test group. Controls were fed standard laboratory pelleted diet (chow-fed), while the test group had free access to a highly-palatable diet (HPD). After eight weeks, the HPD-fed animals were subdivided into three subgroups and their diets altered as follows: HPD-to-chow, HPD with the addition of fenofibrate given by oral gavage for a further seven weeks, or HPD with vehicle (1% carboxymethylcellulose at 1 mL/kg body weight) given by oral gavage for a further seven weeks, respectively. Untreated diet-fed animals had significantly higher body weight, liver weight, and all measured metabolic profiles compared with chow-fed and treated diet-fed groups. Expression of kinases IRβ, IRS-1, AKt, eNOS, Shc and ERK1/2 were unaffected by obesity, while IRS-2 and P I3 kinase levels were significantly reduced in untreated HPD animals. Compared with chow-fed animals, steatosis and steatohepatitis were almost doubled in animals from untreated HPD, while removal of HPD and fenofibrate-treatment reduced steatosis by 40% and 80% respectively. These data suggest that diet-induced obesity affects intracellular insulin signaling mechanisms, namely IRS-2 and PI 3-kinase, leading to hepatic insulin resistance. Moreover, diet-induced obesity induces fatty liver, an effect which can be reversed by either removal of the source of obesity or treatment with fenofibrate, a peroxisome proliferator-activated receptor alpha agonist.
Introduction
Obesity has been associated with glucose intolerance, insulin resistance, dyslipidemia and cardiovascular disease.Citation1 The liver has specifically been implicated as a primary site of insulin resistance observed with visceral obesity. The mechanism(s) relating visceral fat accumulation to hepatic insulin resistance are not well understood, but several possible factors have been implicated. For example, increased release of adipokines such as TNF-α, resistin and adiponectin has been implicated in the development of hepatic resistance.Citation2,Citation3 Alternatively, the “portal hypothesis” posits a high rate of lipolysis of visceral adipose tissue leading to increased delivery of free fatty acids (FFA) to the liver via the portal vein, thus contributing to increased hepatic fat accumulation and insulin resistance.Citation4,Citation5
Chronic exposure of the liver to elevated FFA can promote liver gluconeogenesis,Citation6 deplete enzymes involved in FFA oxidation and increase hepatic lipogenesis.Citation7 In addition, elevated FFA is known to increase liver triglyceride (TG) content,Citation8 and decrease insulin clearance,Citation9 both of which are associated with insulin resistance. Thus, insulin signaling in the liver is critical in regulating glucose homeostasis and maintaining normal hepatic function. Furthermore, insulin resistance in hepatocytes leads to severe systemic insulin resistance and progressive hepatic dysfunction.Citation10 It is therefore plausible to assume that reduced levels of expression of insulin signaling components in the liver and/or inhibition of their activation may precipitate insulin resistance.
Patients with metabolic syndrome X (a combination of insulin resistance, deranged lipid profile and vascular dysfunction) develop non-alcoholic fatty liver disease (NAFLD). As obesity is closely associated with NAFLD,Citation11,Citation12 it is expected that its incidence and prevalence will increase. Therefore, this study aims to investigate the effects of physiologic and pharmacologic weight reduction on liver morphology in diet-induced obese rats.
Methods
Experimental protocol
Adult male Wistar rats (n = 40, weight 190 ± 3 g) were randomized and assigned to a control group (n = 10) and a test group (n = 30). Controls were fed standard laboratory pelleted diet (chow-fed), while the test group had free access to a highly-palatable diet (HPD). The standard chow diet provided 1310 KJ/100g total energy as carbohydrate 60%, fat 10%, and protein 30%. The HPD provided 1010 KJ/100g which consisted of 33% powdered chow, 33% condensed milk (Nestlé UK Ltd, York, UK) and 7% sucrose (Tate & Lyle, London, UK) by weight with the reminder being tap water. This provided 65% energy as carbohydrate, 19% as protein and 16% as fat. Chow-fed controls remained on their diet for 15 weeks, while after 8 weeks the HPD-fed animals were subdivided into three subgroups (each group containing 10 animals). In the first subgroup, the HPD was removed and the standard chow diet was reintroduced (diet-to-chow), while the second subgroup remained on the HPD and were given fenofibrate (fenofibrate-treated, 50 mg/kg/day) by oral gavage for a further seven weeks. The third subgroup (HPD-fed) was given vehicle (1% carboxymethylcellulose at 1 mL/kg body weight; Sigma, Gillingham, UK) by oral gavage daily for seven weeks.
After 15 weeks the rats were weighed and then killed by CO2 inhalation after two hours of fasting. The total body fat mass was measured immediately by a bioimpedance method using TOBEC® equipment (Biotec Instruments Ltd, Kimpton, UK). The gonadal and perirenal fat pads and the gastrocnemius muscle were dissected and weighed. The liver was dissected and snap-frozen in liquid nitrogen for later molecular and histologic analysis. Plasma was immediately separated by centrifugation before being frozen for later measurement of nonesterified free fatty acids (NEFA) and triglycerides (TG) and tumor necrosis factor alpha (TNFα), using commercially available diagnostic kits (Roche, Welwyn, UK, and Sigma Diagnostics, Gillingham, UK). All procedures were carried out according to institutional ethical guidelines.
Experimental procedures
Western-immunoblo ng technique
Western-immunoblotting technique was carried out on the four experimental groups (chow-fed, diet-to-chow, fenofibrate and vehicle treated groups) to measure protein expression levels of kinases such as IR-β, IRS-1, IRS-2, Pl 3-kinase, Akt, eNOS, Shc and ERK1/2, which are involved in hepatic insulin signaling pathways.
Nonspecific binding proteins were discriminated by incubating the blot with a blocking buffer (5% milk powder, 1x phosphate buffer saline [PBS]) at room temperature for one hour, followed by immunoblotting with appropriate primary antibody (1:500 dilution) made up in blocking buffer, left overnight at 4°C. The following morning, blots were washed in 1 × PBS with 1% Tween and incubated with secondary antibody (1:1000), a horse-radish peroxidase (HRP)-linked anti-rabbit (or anti-goat, depending on the source of the species used for primary antibody) for one hour at room temperature. Proteins were detected using an enhanced chemiluminescence method. Positive controls were incubated for standardization of samples between blots, while molecular weight markers (Bio-Rad Laboratories Inc, Hercules, CA) were used for sizing of bands. Densitometry was used to quantify the bands obtained.
Liver triglyceride content
Triglyceride content was assessed in liver samples from all experimental groups: chow-fed, diet-fed with vehicle, diet-to-chow, and fenofibrate treated. Briefly, 80–100 mg liver tissue samples were homogenized in 500 μL distilled water using a Poltroon homogenizer (Kinematical, Lausanne, Switzerland). The homogenates were centrifuged for five minutes at 13,000 × g, and the supernatants were transferred to Eppendorf tubes. The TG assay was performed on the supernatant to detect the concentration of TG in liver tissue.
Liver histology
Tissue samples of liver were prepared for histologic examinations using ordinary tissue processing, and stained using a hematoxylin and eosin staining protocol. Ten liver specimens (ten animals) from each experimental group were interpreted by a single pathologist who was blinded to all data concerning the liver samples and the experimental groups under investigation. The liver samples were analyzed microscopically for the presence or absence of the following histologic features: steatosis, steatohepatitis, fibrosis and hepatocellular carcinoma. Histologic features were interpreted according to the schema outlined by Brunt et al.Citation13 Steatosis was graded on a 3-point scale: grade 1 = steatosis involving <33% of hepatocytes; grade 2 = 33%–66%; grade 3 = >66%. Inflammation (steatohepatitis) was graded on a 4-point scale: grade 0 = no or negligible inflammation; grade 1 = mild; grade 2 = moderate; grade 3 = severe. Fibrosis was graded on a 5-point scale: stage 0 = no fibrosis; stage 1 = zone 3 perisinusoidal/perivenular fibrosis; stage 2 = zone 3 and periportal fibrosis; stage 3 = septal/bridging fibrosis; stage 4 = cirrhosis.
Data interpretation and statistical analysis
For Western blotting, the data from chow-fed (control) animals were expressed as 100% response, and the results from the other three groups were normalized and subsequently expressed as the percentage of their respective controls. Data are expressed as mean ± SEM. Data have a normal distribution (Shapiro Wilk W test). Statistical significance was tested using Student’s t-test or repeated measures (ANOVA; Bonferroni t-test) or the Mann –Whitney test, as appropriate. Results were considered statistically significant at P < 0.05. The histologic data are presented as percentages, each sample representing 10%.
Results
Body weight and metabolic changes
Animals given the HPD progressively gained more weight than their chow-fed counterparts. At the end of the study, untreated diet-fed (vehicle) animals were significantly heavier than chow-fed, diet-to-chow and fenofibrate-treated animals, while body weights of diet-to-chow and fenofibrate-treated animals were significantly (P < 0.01) lower than untreated diet-fed but not control chow-fed animals (). Compared with the chow-fed control group, the untreated diet-fed group had significantly (P < 0.001) higher percentage total fat levels, and epididymal perirenal fat masses. Similarly, plasma levels of insulin, TG, NEFA and TNFα were significantly (P < 0.001) higher in the untreated diet-fed group compared with the chow-fed group (). Removal of the palatable diet or fenofibrate treatment significantly reversed palatable diet-induced changes in fat masses and metabolic parameters (). There were no significant differences between plasma glucose levels and gastrocnemius muscle mass between the four experimental groups ().
Table 1 Physiological and metabolic characteristics of the four experimental groups
Liver weight
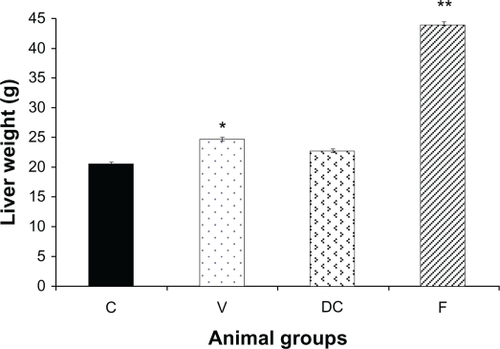
Liver weight in untreated obese animals (vehicle) was significantly elevated compared with the chow-fed group (control) (P < 0.01, 1.22-fold). Replacing the highly-palatable diet with standard laboratory chow (diet-to-chow group) completely restored the liver weight to the normal range with no significant difference in comparison to the chow-fed group. However, compared with chow-fed and vehicle groups, fenofibrate treatment produced a marked increase in liver weight of up to 2.13-fold (P < 0.01) ().
Figure 1 Liver weight of the animals at the end of the experiment in four groups: chow-fed (C), vehicle (V), diet-to-chow (DC), and fenofibrate treated (F).
Triglyceride content of liver
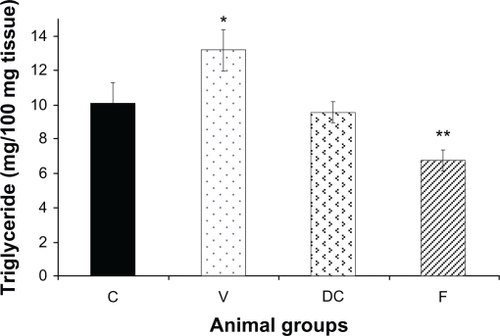
Compared with the chow-fed group, untreated obese animals (vehicle) had significantly (P < 0.05) higher TG levels. Diet-to-chow animals had liver TG levels similar to those of chow-fed, while TG levels in the fenofibrate-treated group were significantly reduced (P < 0.01) compared with the chow-fed group ().
Figure 2 Content of hepatic triglycerides (TG) in four experimental groups: chow-fed (C), vehicle (V), diet-to-chow (DC), and fenofibrate treated (F).
Expression of protein kinases of insulin signaling pathways in hepatocytes
IR-β and IRS-1: Diet had no significant effect on hepatocyte IR-β or IRS-1 levels while fenofibrate treatment resulted in significant (P < 0.001) reduction in the concentration of IR-β and IRS-1 in hepatocytes ().
Figure 3 Protein expression of A) IR-β, and B) IRS-1 in rat liver. Equal amounts (50 μg/well) of protein were separated by SDS-PAGE and immunoblotted with IR-β or IRS-1 antibodies, respectively. The animal groups are: C) chow-fed lean control, V) vehicle group (untreated dietary obese), DC (diet-to-chow group), and F) fenofibrate treated group.
Notes: Data (mean ± SEM) are normalized to that of the control group and expressed as a percentage of chow fed (control) rats. *P < 0.001 versus chow-fed.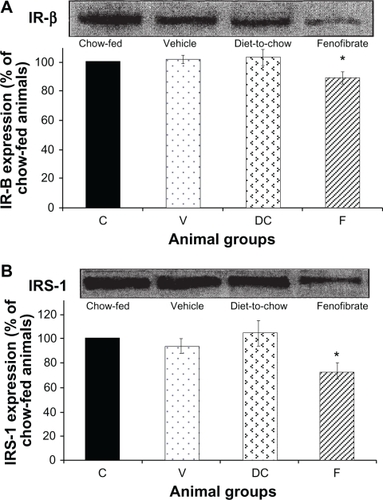
IRS-2 and PI 3-kinase: Compared with chow-fed controls, diet-fed obese vehicle-treated animals had significantly lower levels of IRS-2 and PI 3-kinase expression (P < 0.05). Fenofibrate treatment further increased reduction in IRS-2 and PI 3-kinase levels (P < 0.0001) ().
Figure 4 Protein expression of A) IRS-2 and B) PI 3-kinase in rat liver. Equal amounts (50 μg/well) of protein were separated by SDS-PAGE and immunoblotted with IRS-2 and PI 3-kinase antibodies, respectively. The animal groups are: C) chow-fed lean control, V) vehicle group (untreated dietary obese), DC) diet-to-chow group, of the control group and expressed as a percentage of chow fed (control) rats.
Notes: *P < 0.05; **P < 0.0005 versus chow-fed.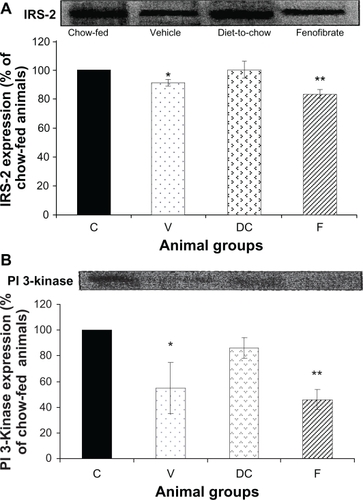
AKt: Although diet-induced obesity did not affect AKt levels, chronic withdrawal of the HPD caused a marked decrease in AKt protein (P < 0.05). Furthermore, fenofibrate treatment induced a significant reduction (P < 0.000005) in AKt levels ().
Figure 5 Protein expression of AKt in rat liver. Equal amounts (50 μg/well) of protein were separated by SDS-PAGE and immunoblotted with AKt antibody. The animal groups are: C) chow-fed lean control, V) vehicle group (untreated dietary obese), DC) diet-to-chow group, and F) fenofibrate treated group.
Notes: Data (mean ± SEM) are normalized to that of the control group and expressed as a percentage of chow fed (control) rats. *P < 0.05, **P < 0.000005 versus chow-fed.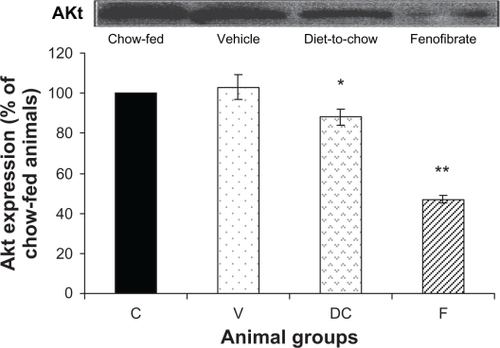
eNOS: Expression of eNOS protein was not affected in the three experimental groups: vehicle, diet-to-chow and fenofibrate groups. In fact, eNOS levels were similar in all groups with no significant difference between the groups ().
Figure 6 Protein expression of eNOS in rat liver. Equal amounts (50 μg/well) of protein were separated by SDS-PAGE and immunoblotted with eNOS antibody. The animal groups are: C) chow-fed lean control, V) vehicle group (untreated dietary obese), DC) diet-to-chow group, and F) fenofibrate treated group.
Notes: Data (mean ± SEM) are normalized to that of the control group and expressed as a percentage of chow fed (control) rats. No significant differences were seen between the four groups.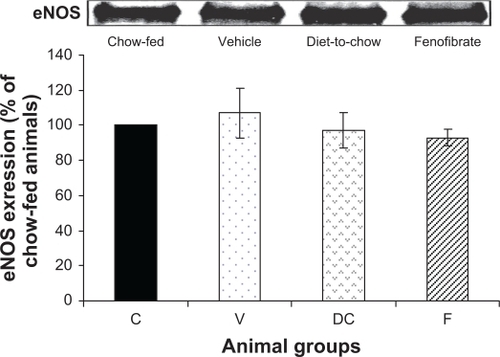
Shc and ERK 1/2: Shc and ERK1/2 expressions were similar in chow-fed, diet-induced obese (vehicle) and diet-to-chow animals. However, compared with chow-fed animals, the levels of both Shc and ERK1/2 were significantly (P < 0.005) reduced in fenofibrate-treated animals ().
Figure 7 Protein expression of A) Shc and B) ERK1/2 in rat liver. Equal amounts (50 μg/well) of protein were separated by SDS-PAGE and immunoblotted with Shc or ERK 1/2 antibodies, respectively. The animal groups are: C) chow-fed lean control, V) vehicle group (untreated dietary obese), DC) diet-to-chow group, and F) fenofibrate treated group.
Notes: Data (mean ± SEM) are normalized to that of the control group and expressed as a percentage of the chow-fed (control) rats. *P < 0.01 versus chow-fed.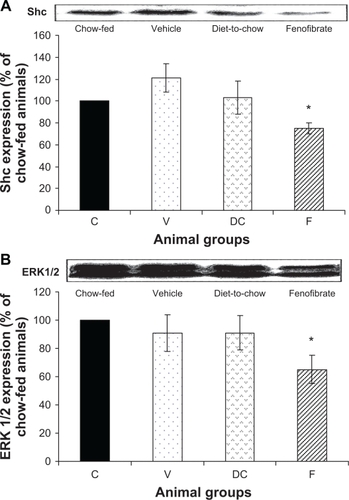
Histologic features of liver tissue (non-alcoholic fatty liver disease)
The histologic slides of liver tissue of each animal were examined for the presence or absence of histologic features of the different stages of non-alcoholic fatty liver disease (). Ten liver samples (ten animals) in each experimental group were analyzed microscopically.
Figure 8 Histologic sectioning for the liver: A) normal liver, B) steatosis fatty liver grade one, C) steatosis fatty liver grade two and D) steatohepatitis grade one. Note: The arrows indicate the presence of adipocytes in each section.
Steatosis (accumulation of fat in the liver)
Steatosis was found in 50% (grade 1steatosis) of the chow-fed control group, while untreated obese animals (vehicle group) had steatosis in 80% of the total samples (40% grade 1, 30% grade 2 and 10% grade 3). Steatosis was present in 50% of the samples of the diet-to-chow group (40% grade 1 and 10% grade 2). Fenofibrate-treated group had steatosis in only 10% of the total samples for this group (grade 2) ().
Table 2 Total percentage of hepatic change (steatosis) in stage 1 of non-alcoholic fatty liver disease in the four experimental groups
Steatohepatitis
All four groups of animals had some degree of steatohepatitis. The highest level was in diet-induced obese (vehicle) animals (70%, Grade 1) whilst fenofibrate-treated animals had the lowest levels of steatohepatitis (10%, Grade 1) ().
Table 3 Percentage of hepatic inflammation in stage II of non-alcoholic fatty liver disease in the four experimental groups
Fibrosis and hepatocellular carcinoma
The histologic examination of samples in all experimental groups showed no signs of the presence of advanced features of NAFLD: fibrosis and hepatocellular carcinoma. All samples were negative for fibrosis and hepatocellular carcinoma.
Discussion
In the liver, insulin has a crucial role in mediating carbohydrate and lipid homeostasis by stimulating glycogen synthesis, lipogenesis, lipoprotein synthesis, suppression of gluconeogenesis/glycogenolysis and very low density lipoprotein secretion in the fed state,Citation14,Citation15 as well as having a role in hepatocyte regeneration and growth.Citation16 Therefore, the integrity of hepatic insulin signaling is important for the action of insulin in hepatocytes. Deficiency in protein expression of any components of insulin transduction may induce hepatic insulin resistance and subsequently may precipitate induction of systemic insulin resistance and Type II diabetes, while local hepatic insulin resistance may cause non-alcoholic fatty liver disease.
In general, protein kinase phosphorylation and activation levels depend on the concentration of the expressed protein.Citation17 Therefore, in hepatocytes, defective protein kinase expression may cause insulin resistance with subsequent induction of hepatic insulin resistance-related clinical disorders, namely NAFLD. In the present study, diet-induced obesity did not affect the expression of insulin receptor β (IR-β) and insulin receptor substrate-1 (IRS-1), indicating that the detrimental effects of diet-induced obesity on hepatic insulin signaling is at postreceptor levels. This is in contrast with findings on genetically obese animals where reduced IR-β autophosphorylation secondary to its inhibited expression in hepatocytes is a characteristic feature of the genetically obese hypertensive strain.Citation18 In fact another study has revealed that in genetically obese ob/ob mice, levels and activation of IRS-1 are reduced significantly.Citation19 Taken together, these reports indicate that the molecular mechanism of hepatic insulin resistance in genetic obesity may involve modification in the early steps (IR-β and IRS-1 proteins) of insulin signaling, and that the amount of protein expression may correlate directly with the levels of phosphorylation and activation of the protein. However, unlike studies in genetically obese animals, our study does not show any role for IR-β and IRS-1 involvements in genesis of hepatic insulin resistance.
In the liver, IRS-2 appears to have a major role in regulating hepatic insulin action, whereas IRS-1 appears to have important functions in skeletal muscle.Citation20,Citation21 IRS-2 has a major role in the growth-promoting actions of insulin, in suppressing gluconeogenesis and apoptosis in hepatocytes,Citation22 and in acting as a regulatory point for the Pl 3-kinase-AKt cascade in hepatocytes.Citation22,Citation23 In the present study, levels of expression of both proteins (IRS-2 and Pl 3-kinase) were significantly decreased in diet-induced obese animals, suggesting that diet-induced obesity has similar detrimental effects to those of genetic obesity on IRS-2 and Pl 3-kinase proteins in hepatocytes. The normal concentration of AKt protein in the hepatocytes of diet-induced obese animals in our study is consistent with other studies,Citation24 which found unchanged levels of protein expression and slightly elevated phosphorylation of AKt in genetic obesity. Therefore, both types of obesity may have similar effects on AKt protein expression.
In this study, fenofibrate had a significant effect on the reduction of IRβ, IRS-1, IRS-2, and PI 3-kinase, which may suggest deterioration of insulin signaling pathways, ultimately leading to worsening of insulin resistance. However, similar to previous reports, in this study, fenofibrate treatment improved insulin resistance as measured by plasma insulin and glucose levels. Therefore, a question arises as to what is the role/mechanism of fenofibrate in reducing hepatic IRβ, IRS-1, IRS-2, and PI 3-kinase protein expressions. To answer this important question, further investigations are required.
There is little information about hepatocyte eNOS expression in normal or diseased states. In hepatocytes, eNOS may regulate hepatic vasculature, regulating blood flow and blood cell interaction.Citation25 In the present study, expression of eNOS in the liver was not affected by the different dietary manipulations, or by disease states (normal, steatosis or steatohepatitis). This finding is in agreement with others, demonstrating that the expression of eNOS protein and its activity in hepatocytes is not changed in chronic liver disorders such as alcoholic cirrhosis, viral hepatitis, cholestasis, and fulminant liver failure.Citation26 The normal expression of the MAP-kinase pathway is a crucial factor in mediating the mitogenic response of insulin. A defect in Pl 3-kinase may overactivate the MAP-kinase pathway, altering insulin response. In the present study, diet-induced obesity did not alter the expression of two important protein kinases (Shc and ERK 1/2) in the MAP-kinase pathway, despite significant protein deficiencies in the Pl 3-kinase pathway in hepatocytes. Interestingly, in the present study, the effect of palatable-diet removal on expression of AKt protein in hepatocytes was similar to its affect on AKt in the aorta reported previously.Citation27 Moreover, this reduction in AKt expression in hepatocytes may be related to the sharp decrease in calorie intake. A similar study demonstrated that moderate calorie restriction for 20 days induced a decrease in AKt levels,Citation28 suggesting that caloric intake may affect AKt protein levels which in turn may alter insulin response in vasculature and hepatocytes.
Fatty liver (steatosis), the first stage of NAFLD, was apparent in all experimental groups in our study. Histologic sectioning of liver samples of diet-induced obese animals showed a considerable amount of fat droplets, which was further confirmed by a significant elevation of triglyceride content of liver samples. Steatohepatitis (inflammation of the liver), the second stage of NAFLD, in untreated obese animals was also confirmed by the histologic sectioning of the liver, indicating that steatosis was induced as a result of increasing influx of lipid into the liverCitation29 in obese animals. Simple steatosis might have also progressed into steatohepatitis due to increased secretion of inflammatory markers from adipose tissue, which include TNF-αCitation30 and CRPCitation31. In the presence of hepatic insulin resistance, where the Pl 3-kinase pathway is inhibited and MAP-kinase (ERK1/2) is overactivated, liver disease may progress further. Previous studies have shown that regenerative response to liver injury is impaired in ob/ob obese mice with fatty livers,Citation32 providing further support for the concept that inhibited regeneration contributes to disease progression in NAFLD. A study by Yang et alCitation33 indicated that fatty hepatocytes in ob/ob mice become trapped in G1, the prereplicative phase of the cell cycle. However, the coordinated activation of the oxidant-sensitive, stress-, and mitogen-activated protein kinase cascades, which normally occurs early in G1Citation34 does not occur in fatty hepatocytes, which have adapted to a state of chronic oxidant stress.Citation33 In fact, in fatty liver, the activation of the mitogen-activated kinase, ERK1/2, is enhanced, with abolishment of the induction of the stress-activated kinase JNK. Therefore, fatty ob/ob hepatocytes fail to proliferate despite robust ERK activation when JNK induction is abolished.Citation35
A key feature in the molecular pathogenesis of liver fibrosis is the maintenance of the activated hepatic stellate cell phenotype by both proliferation and inhibition of apoptosis. Another study has demonstrated that leptin is a potent hepatic stellate cell mitogen and dramatically inhibits stellate cell apoptosis via ERK1/2 and AKt kinases.Citation36 We and others have previously reported elevated plasma leptin concentration in diet-induced obese animals,Citation37 a finding which suggests the implication of leptin and ERK1/2 in NAFLD progression.
Lifestyle modification of diet-induced obesity, represented in the present study by chronic withdrawal of HPD (diet-to-chow group) retarded the progression of NAFLD and improved the histologic features of this disease to levels similar to those of chow-fed animals. The positive impact of physiologic weight loss on liver pathophysiology has been suggested since the early 1990s. Studies in human subjects have shown that weight loss and maintenance of weight loss in overweight patients with liver disease would result in improvement of liver function and serum insulin levels.Citation38,Citation39 Indeed our study provides clear evidence that both physiologic and pharmacologic weight loss would improve liver histology and function. Moreover, the pharmacologic intervention (fenofibrate therapy) further improved histologic features to levels better than that of the chow-fed group. Interestingly, improvements in histologic features were paralleled with similar improvement in three detrimental factors associated with diet-induced obesity: TG content of the liver; plasma concentration of TNF-α; and total body weight, suggesting these have a role in initiating and inducing the different histologic features of NAFLD. Similar studies using a mouse model of non-alcoholic steatohepatitis have reported that peroxisome proliferator-activated receptor alpha (PPARα) agonists significantly improve hepatic steatosis, while PPARα (−/−) mice fed with methionine and choline deficient diet developed more severe steatohepatitis than the wild type mice,Citation39,Citation40 indicating a central role for PPARα receptors in hepatic pathophysiology.
Overall, this study indicates that diet-induced obesity results in hepatic insulin resistance, possibly by affecting expression and activation of insulin signaling proteins. Moreover, dietary obesity affects liver histology, leading to the development of NAFLD. Development of NAFLD may be associated with accumulation of triglycerides in the liver and/or changes in the hepatic insulin signaling pathway. These diet-induced detrimental effects on the liver can be attenuated and perhaps improved by both physiologic and pharmacologic weight reduction using PPARα agonists. However, it is important to conduct further research to determine if other weight-reducing pharmacologic agents would have beneficial effects on liver physiology.
Disclosure
The authors have reported no conflict of interest in this work.
References
- DeFronzoRAFerranniniEInsulin resistance. A multifaceted syndrome responsible for NIDDM, obesity, hypertension, dyslipidemia, and atherosclerotic cardiovascular diseaseDiabetes Care1991141731942044434
- HotamisligilGSMechanisms of TNF-alpha-induced insulin resistanceExp Clin Endocrinol Diabetes199910711912510320052
- SteppanCMBaileySTBhatSThe hormone resistin links obesity to diabetesNature200140930731211201732
- BjorntorpP“Portal” adipose tissue as a generator of risk factors for cardiovascular disease and diabetesArteriosclerosis1990104934962196039
- BodenGRole of fatty acids in the pathogenesis of insulin resistance and NIDDMDiabetes1997463108971073
- WilliamsonJRMechanism for the stimulation in vivo of hepatic gluconeogenesis by glucagonBiochem J196610111C14C
- XuJNakamuraMTChoHPClarkeSDSterol regulatory element binding protein-1 expression is suppressed by dietary polyunsaturated fatty acids. A mechanism for the coordinate suppression of lipogenic genes by polyunsaturated fatsJ Biol Chem1999274235772358310438539
- OakesNDBellKSFurlerSMDiet-induced muscle insulin resistance in rats is ameliorated by acute dietary lipid withdrawal or a single bout of exercise: parallel relationship between insulin stimulation of glucose uptake and suppression of long-chain fatty acyl-CoADiabetes199746202220289392490
- MittlemanSDVan CittersGWKimSPLongitudinal compensation for fat-induced insulin resistance includes reduced insulin clearance and enhanced beta-cell responseDiabetes2000492116212511118015
- MichaelMDKulkarniRNPosticCLoss of insulin signaling in hepatocytes leads to severe insulin resistance and progressive hepatic dysfunctionMol Cell20006879710949030
- MarchesiniGBabiniMNon-alcoholic fatty liver disease and metabolic syndromeMinerva Cardioangiol20065422923916778754
- ImhofAKratzerWBoehmBPrevalence of non-alcoholic fatty liver and characteristics in overweight adolescents in the general populationEur J Epidemiol20072288989717896181
- BruntEMJanneyCGDi BisceglieAMNeuschwander-TetriBABaconBRNonalcoholic steatohepatitis: a proposal for grading and staging the histological lesionsAm J Gastroenterol1999942467247410484010
- SparksJDSparksCEInsulin regulation of triacylglycerol-rich lipoprotein synthesis and secretionBiochim Biophys Acta199412159327948013
- ZammitVAUse of in vivo and in vitro techniques for the study of the effects of insulin on hepatic triacylglycerol secretion in different insulinaemic statesBiochem Soc Trans20002810310910816109
- StarzlTEWatanabeKPorterKAPutnamCWEffects of insulin, glucagon, and insulin/glucagon infusions on liver morphology and cell division after complete portacaval shunt in dogsLancet1976182182556646
- AnaiMFunakiMOgiharaTAltered expression levels and impaired steps in the pathway to phosphatidylinositol 3-kinase activation via insulin receptor substrates 1 and 2 in Zucker fatty ratsDiabetes19984713239421369
- FriedmanJEIshizukaTLiuSReduced insulin receptor signaling in the obese spontaneously hypertensive Koletsky ratAm J Physiol1997273E1014E10239374689
- SaadMJArakiEMiralpeixMRothenbergPlWhiteMFKahnCRRegulation of insulin receptor substrate-1 in liver and muscle of animal models of insulin resistanceJ Clin Invest199290183918491331176
- SestiGFedericiMHribalMLLauroDSbracciaPLauroRDefects of the insulin receptor substrate (IRS) system in human metabolic disordersFASEB J2001152099211111641236
- RotherKIImaiYCarusoMBeguinotFFormisanoPAcciliDEvidence that IRS-2 phosphorylation is required for insulin action in hepatocytesJ Biol Chem199827317491174979651339
- ValverdeAMBurksDJFabregatIMolecular mechanisms of insulin resistance in IRS-2-deficient hepatocytesDiabetes2003522239224812941762
- KimYBPeroniODFrankeTFKahnBBDivergent regulation of Akt1 and Akt2 isoforms in insulin target tissues of obese Zucker ratsDiabetes20004984785610905496
- LiJBilliarTRNitric Oxide. IV. Determinants of nitric oxide protection and toxicity in liverAm J Physiol1999276G1069G107310329995
- McNaughtonLPuttaguntaLMartinez-CuestaMADistribution of nitric oxide synthase in normal and cirrhotic human liverProc Natl Acad Sci U S A200299171611716612482944
- FataniSHNaderaliEKPanchianiSShahSWongCThe effects of dietary obesity on protein expressions of insulin signaling pathway in rat aortaDrug Discov Ther20082254261
- McCurdyCEDavidsonRTCarteeGDBrief calorie restriction increases AKt2 phosphorylation in insulin-stimulated rat skeletal muscleAm J Physiol Endocrinol Metab2003285693700
- GauthierMSFavierRLavoieJMTime course of the development of non-alcoholic hepatic steatosis in response to high-fat diet-induced obesity in ratsBr J Nutr20069527328116469142
- LiZYangSLinHProbiotics and antibodies to TNF inhibit inflammatory activity and improve non-alcoholic fatty liver diseaseHepatology20033734335012540784
- UchiharaMIzumiNHigh-sensitivity C-reactive protein (hs-CRP): a promising biomarker for the screening of nonalcoholic steatohepatitis (NASH)Nippon Rinsho2006641133113816768121
- YangSQLinHZMandalAKHuangJDiehlAMDisrupted signaling and inhibited regeneration in obese mice with fatty livers: implications for nonalcoholic fatty liver disease pathophysiologyHepatology2001344 Pt 169470611584365
- YangSQLiYLinHZGabriesonKTrushMADiehlAMMitochondrial adaptations to obesity-related oxidant stressArch Biochem Biophys200037825926810860543
- LeeFYLiYZhuHTumor necrosis factor increases mitochondrial oxidant production and induces expression of uncoupling protein-2 in the regenerating rat liverHepatology19992967768710051468
- BostFMcKayRDeanNMercolaDThe JnK kinase/stress-activated protein kinase pathway is required for epidermal growth factor stimulation of growth of human A549 lung carcinoma cellsJ Biol Chem199727233422334299407138
- SaxenaNKTitusMADingXLeptin as a novel profibrogenic cytokine in hepatic stellate cells: mitogenesis and inhibition of apoptosis mediated by extracellular regulated kinase (Erk and Akt phosphorylation)FASEB J2004181612161415319373
- NaderaliEKFataniSTellesMHunterLThe effects of physiological and pharmacological weight loss on adiponectin and leptin mRNA levels in the rat epididymal adipose tissueEur J Pharmacol200857943343818155694
- PalmerMSchaffnerFEffect of weight reduction on hepatic abnormalities in overweight patientsGastroenterology199099140814132210247
- HickmanIJJonssonJRPrinsJBModest weight loss and physical activity in overweight patients with chronic liver disease results in sustained improvements in alanine aminotransferase, fasting insulin, and quality of lifeGut20045341341914960526
- IpEFarrellGCRobertsonGHallPKirschRLeclercqICentral role of PPARalpha-dependent hepatic lipid turnover in dietary steatohepatitis in miceHepatology20033812313212829994
- NagasawaTInadaYNakanoSEffects of bezafibrate, PPAR pan-agonist, and GW501516, PPARdelta agonist, on development of steatohepatitis in mice fed a methionine- and choline-deficient dietEur J Pharmacol200653618219116574099