Abstract
Background:
Meals begin and end subjectively. We trained healthy subjects to recognize initial hunger as a preprandial target for meal consumption, and to create a “recognizing hunger” or initial hunger meal pattern.
Objective:
Training subjects to “recognize hunger” lowers blood glucose (BG) and improves energy balance, and lowers metabolic risks and bodyweight. A minority may have low BG and low metabolic risks at recruitment, but the others may recover this favorable condition by training.
Methods:
In a 7-day food diary, subjects reported their preprandial BG measurements; BG and energy availability by blood were assessed at the lowest BG during the day, and diary-mean BG thus characterized the individual meal pattern (daily energy intake). We analyzed the same diaries of a recent paper on a global, randomized comparison of subjects trained in “recognizing hunger” with control subjects. This time, we checked whether subjects who had maintained low BG (LBG subgroup) at recruitment were able to decrease mean BG and metabolic risk factors during “hunger recognition” like those who presented high BG (HBG subgroup).
Results:
At recruitment, the BG means of 120 investigated subjects were within mean confidence limits of ± 3.84 mg/dL, and we could stratify subjects in ten small strata of which each significantly differed by mean BG. Mean BG was stable in each control subject over five months; the mean absolute change being 6.0 ± 4.6 mg/dL. Only three out of 34 trained subjects who had lower mean BG than 81.8 mg/dL significantly decreased mean BG, whereas 41 out of 55 subjects whose mean BG was greater than 81.8 mg/dL significantly decreased mean BG after training (P < 0.0001). At recruitment, the LBG subgroup showed significantly lower insulin, lower BG area under curve (AUC) in the oral glucose tolerance test (GTT), and lower HbA1c than the HBG group. After training, only HBG subjects, compared with HBG controls, significantly decreased preprandial BG from 91.6 ± 7.7 mg/dL to 81.0 ± 7.7 mg/dL, in association with a decrease of HbA1c from 4.81% ± 0.44% to 4.56% ± 0.47%, of GTT insulin AUC from 244 ± 138 mU/L to 164 ± 92 mU/L, and of energy intake from 1872 ± 655 kcal to 1251 ± 470 kcal (P < 0.001), with an increase of indices of insulin sensitivity from 5.9 ± 3.3 to 9.8 ± 5.6 and of beta cell function from 1.0 ± 0.7 to 1.4 ± 1.1 (P < 0.05). LBG subjects only decreased weekly-diary BG standard deviation in comparison with controls.
Conclusion:
At recruitment, the 120 subjects maintained mean BG at one personal level of ten possibilities, and 34 subjects were below 81.8 mg/dL (LBG) and 55 were over (HBG). The 55 HBG subjects showed higher mean insulin resistance, HbA1c, other cardiovascular risk factors, and increased bodyweight compared with the 34 LBG subjects. A total of 41 out of the 55 HBG subjects regressed to LBG with training.
Introduction
Meals begin and end subjectively. People cannot share subjective sensations with others, such as sights and sounds. Subjective sensations guide a person’s food intake. In past investigations, we suggested subjects find a subjective target (initial hunger [IH]) before food intake on the first day, and measure blood glucose (BG) concentration as a marker of this target on the first and subsequent days.Citation1–Citation6 We named this ability to adjust food intake to times of IH arousal before meals three times a day “initial hunger meal pattern” (IHMP). This is a meal pattern based on “recognizing hunger”. We use these two simple words here to be more evocative than IHMP. We chose the target assessment and BG measurement before meals for the following five reasons:
Before meals, people sometimes recognize definite hunger sensations and are able to validate them through BG measurement.Citation4–Citation6
A BG measurement (as well as validated hunger sensations, IH) is an evaluation of either sufficiency or excess of energy intake at previous meal, and is useful in planning meal sizes.Citation4
Seven-day food-diary reporting, 21 consecutive BG measurements, and meal compositions may prove to be highly effective educational tools to evaluate food intake meal by meal as suggested in point 2.
Before mixed meals, in our experience, BG is lower than after food consumption in healthy individuals. A sequence of preprandial BG measurements provides information on the lowest mean BG and lowest mean energy availability during the examined days.
Point 4 is a metabolic characterization of an individual energy meal pattern, which is standard during the examined days, and the mean BG allows comparisons and classifications better than daily energy intake.
We previously investigated a pool of diaries of 120 subjects by assessing mean weekly BG of the group.Citation6 Meal adaptation to “recognizing hunger” decreased mean BG, metabolic risks, insulin resistance, and bodyweight in the trained group compared with control subjects.Citation5,Citation6 The overall response in mean BG and the overall improvement overlooks differences in single meal patterns, insulin sensitivity, health at recruitment, and health in response to training. If mean BG is maintained as a personal habit, the differences may explain huge risk differences that can be personally felt and corrected by “recognizing hunger”.
Methods
Participants
Eligibility criteria and randomization
Subjects were reported in a previous paper.Citation6 Briefly, the Pediatric Gastroenterology Unit of Florence University recruited 143 subjects from 1996 to 2000. Aged 18–60 years old, subjects suffered from symptoms of functional bowel disorders such as dyspepsia, abdominal pain, and diarrhea ()Citation7,Citation8 but were otherwise clinically healthy. Informed consent had been signed by all subjects. The local Hospital Ethics Committee approved the investigation in compliance with the Helsinki Declaration.
Figure 1 Consort flow chart and study design.
Abbreviations: GTT, glucose tolerance test; HBG, high blood glucose; IHMP, initial hunger meal pattern (recognizing hunger); LBG, low blood glucose.
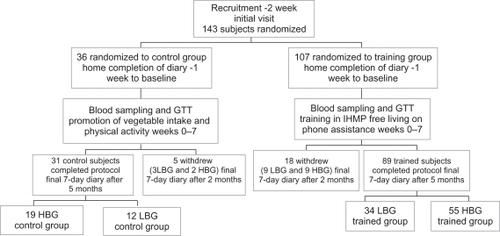
Before recruitment, we prepared a list of blocks of 1–4 empty places. In a ratio of 1:3 blocks, we randomly assigned the blocks of empty places to either control or training groups by using Armitage odd and even random numbers. A dietician kept the list and subsequently assigned each recruited subject to the first empty list place. Control or training destination was revealed after the first visit ().
The training
The trained group exercised regularly under guided instruction for 7 weeks, and maintained the new strategies of food consumption and energy expenditure for a further 3 months without any assistance ().
Subjects suspended food intake until arousal of a sensation of hunger, generally epigastric hunger.Citation4 Meal consumption delayed 2 hours on average; range 0–48 hours. Hungry subjects measured BG by a portable instrument (see measurements below) and consumed a meal. The energy content was initially lower than before training to obtain a further hunger arousal before the subsequent mealtime. After 3–14 days of this training, subjects became aware of their current BG state before meals by sensations.Citation4 IH was maintained pre-meal, adjusting meal sizes, composition, or timing of food intake. After a few days of trial and error, and sometimes irregular mealtimes, subjects were able to adjust their food intake so that IH appeared before the usual three mealtimes per day, with an average error of 30 minutes in 80% of instances in adults, and 90% in children (“recognizing hunger” or IHMP).Citation9–Citation14
Both control (N = 31) and trained (N = 89) subjects had the same information on food energy content, recommended vegetable intake, and physical activity amount per day (weeks 0–7) ().
Design
All 120 subjects who completed the protocol were fully assessed at recruitment (before training), clinically only after the first 7 weeks of training, and completely at the end of the investigation (total investigation 5 months).
In 31 control subjects, we investigated whether food intake is habitual, ie, maintaining the same meal pattern by mean BG. Moreover, habits in BG maintenance may be personal, ie, sharply defined from most others. In all 120 subjects, we calculated mean confidence interval at recruitment (0.95%) for this purpose, and we stratified all 120 subjects in groups that contained subjects without significant differences in mean BG.
Some subjects who had low mean BG at recruitment might fail any response to “recognizing hunger”, because this meal pattern lowers mean BG to the point of imminent subjective insufficiency (see description of training in previous studies).Citation4–Citation6 We decided to find the most significant cutoff point on the basis of individual response in mean BG, either significant or not due to training. After finding the cutoff, we separately investigated (at recruitment and during “recognizing hunger” 5 months from recruitment, compared with controls) the association of subjects with low mean BG (LBG) and high mean BG (HBG) with insulin area under curve (AUC), and indices of insulin sensitivity and beta cell function (primary endpoints). Analyses were also performed on BG AUC, measurements of BG and insulin concentrations during oral glucose tolerance test (GTT), mean BG, and glycated hemoglobin (HbA1c) values (secondary endpoints).Citation15 Data are presented post hoc division. Data without division have been previously publishedCitation6 and are not reported here.
Oral GTT
After a 12-hour overnight fast, all subjects were given a 75 g oral glucose load. Venous blood samples were taken immediately before the glucose was administered, and 30, 60, 90, 120, and 180 minutes later to determine plasma glucose and serum insulin. Serum insulin was measured with the IMx insulin assay (Abbott Laboratories, Abbott Park, IL).Citation16 From the GTT, we calculated the AUC, the index of whole-body insulin sensitivity (10,000/square root of [fasting glucose × fasting insulin] × [mean glucose × mean insulin during GTT]),Citation17 and the insulinogenic index of beta cell function (ratio of the increment of plasma insulin to that of plasma glucose 30 minutes after glucose loading).Citation18
Measurements
Subjects measured capillary blood themselves using a glucometer (a portable device for whole blood glucose measurement) (Glucocard Memory; Menarini Diagnostics, Florence, Italy) within 15 minutes before each meal. Accuracy of measurements by the glucometer was validated against periodic measurements by hospital autoanalyzer. Subjects avoided BG measurements taken less than 1 hour after consuming even a few grams of food, after changes in ambient temperature, after physical activity such as walking or cycling, or under psychological stress or being feverish, because BG in these circumstances is higher than 1 hour after cessation of the transient metabolic condition.Citation4 The 7-day home diaries reported BG measurements before the three main mealtimes, energy and vegetable intake, hours in bed and hours spent during physical and outdoor activities (weekly mean and standard deviation [SD]), and presence or absence of preprandial sensation of epigastric hunger.Citation10–Citation14 Subjects compiled the diaries before training, after 7 weeks, and at the end of the study. Our previous studies include more details on the validation of BG estimation compared with BG measurements,Citation4,Citation10–Citation14 comparison of energy intake and total energy expenditure as assessed by doubly labeled water in infants,Citation12 HbA1c,Citation15 methods for anthropometric measurements, structured interviews, and relevant clinical blood tests.Citation11–Citation13,Citation19
Additional assessments
Additional analyses were performed on energy balance, wellbeing, nutrition, and cardiovascular status, as follows.
Structured interviews ascertained the number of days in which each of the five functional symptoms (diarrhea, vomiting, headache, epigastric, or abdominal pain) occurred during the previous 3 months. The hours of daily physical activity and time spent in bed reported in the 7-day diary were also assessed because an increase of the former and a small decrease in the latter suggests improvement in wellbeing.Citation11,Citation19
Nutrition was assessed by monitoring blood hemoglobin, mean cellular volume, transferrin saturation, plasma ferritin, zinc, folates, and vitamin B12.Citation19
Cardiovascular status was assessed by systolic and diastolic blood pressures, plasma low density lipoprotein (LDL) cholesterol/high density lipoprotein (HDL) cholesterol ratio, triglycerides, and HDL cholesterol.
Energy balance during the 5-month investigation interval was assessed through measurement of arm and leg skin-fold thickness changes, by measurements of body weight and body mass index (BMI), and by assessment of reported energy and vegetable intake. BMI and body weight constituted the primary endpoint of a recent article.Citation5
Statistical methods
In a previous study, we found an insulin sensitivity index in the intervention group 3 mg/dL higher than in the control group, with an SD of 3.0.Citation6 Based on these figures, our sample size calculations suggested that we need a minimum of 14 subjects in each comparison group to detect a similar difference between index means, with a power of 80% and a unilateral alpha of 0.05.
Values are expressed as mean ± SD. Twenty-one diarized BG measurements had a normal distribution around the mean. Confidence intervals were calculated to include 95% of measurements.Citation20 Stratification of 120 subjects by mean BG and search for the cutoff point at recruitment between subjects who significantly responded to “recognizing hunger” by mean BG and nonresponders was discussed in the Statistics Department of the University of Firenze (see Acknowledgments). In the separate LBG and HBG subgroups, a logistic regression analysis investigated the association of the training and BG mean, Hb1c, insulin and BG AUCs, intakes, and anthropometric measures (trained vs untrained control groups) to overcome doubts on significance of multiple results.Citation21 Collinearity diagnostics and residual analysis validated the statistical model. The significance of difference and correlation was set at P < 0.05 in these analyses. Yates test and two-tailed Student’s t-test on paired or unpaired samples according to data requirements were used to analyze the significance of difference and two-tailed Student’s t-test for correlation. The significance was set at P < 0.05 for single measurements and at P < 0.025 for the GTT insulin and BG AUCs.Citation20 The trials on wellbeing, nutrition, and cardiovascular risks comprised five to seven tests each.Citation20,Citation21 The significance was set at P < 0.01 for the outcome of a single measurement within these trials. The Bonferroni correction was applied when required in the evaluation of multiple comparison results.Citation20,Citation21 In multiple analyses, the “<” symbol indicates the least significant P-value. Specially provided software was used to tabulate data for statistical analyses. Microsoft Excel and SAS (v 8; SAS Institute, Inc, Cary, NC) were used for data presentation and for statistical analyses.
Results
Flow of participants
shows the flow of participants through each phase of the investigation. Although some subjects may not have been compliant to the “recognition of hunger” for all meals, we have included all 89 trained subjects who completed the investigation in the final analysis because it was our intention to treat them.
Twenty-three dropouts were contacted by telephone at the end of the investigation and their reasons noted. Their reasons were that they “required no further training” or had “busy schedules”. We have 7-week data from all 23 dropouts. We allocated the 18 trained dropout subjects to LBG or HBG subgroups (see Design section) and obtained nine subjects in each subgroup. Over the 7-week training period, LBG subjects maintained constant mean BG (from 78.6 ± 2.6 to 76.3 ± 4.7 mg/dL). HBG subjects significantly decreased mean BG (from 88.1 ± 4.1 mg/dL to 81.5 ± 5.0 mg/dL; P = 0.004), energy intake (from 1657 ± 423 to 1005 ± 319; P = 0.0001), BMI (from 23.6 ± 2.5 to 22.6 ± 1.8; P = 0.04), and leg skin-fold thickness (from 31.8 ± 8.2 to 27.8 ± 9.9; P = 0.04). The five control dropout subjects showed no change in these assessments.
At recruitment, values of mean BG, mean age, school education years, body weight, BMI, height, skin-fold thickness, arm and leg circumferences, systolic and diastolic blood pressure, and blood values did not significantly differ between control and trained groups and between LBG and HBG subgroups in both the trained and the control groups (–).
Table 1 Group composition and effects of training on anthropometry in low and high BG subjects
Table 3 Effects of training on wellbeing, cardiovascular, and nutrition parameters in HBG groups
The results reported refer to the 120 subjects (60 females and 60 males) who completed the study (89 trained versus 31 controls).
Stratification of 120 subjects by significant differences in mean preprandial BG
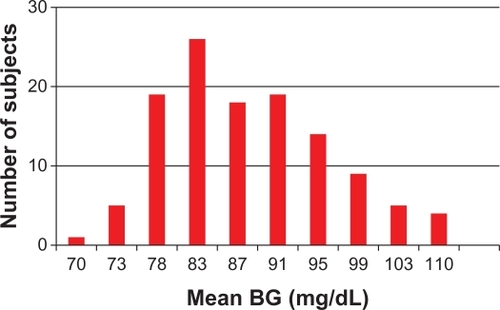
At recruitment, mean BG was distributed from 64.5 to 109.9 mg/dL in all 120 subjects, but the mean confidence interval (95%) of diary measurements around mean BG was ± 3.84 mg/dL. In , all 120 subjects were stratified into ten groups by increasing mean BG at recruitment. Each of the ten stratifications included subjects who showed no difference in mean BG (P > 0.05), but excluded subjects who had significant differences.
Figure 2 Increasing sequence of mean BG of all 120 trained and control subjects divided into ten strata (columns) at recruitment.
Abbreviation: BG, blood glucose.
Stability of mean BG in control subjects
31 control subjects maintained a stable mean BG after 5 months (from 85.2 ± 8.1 mg/dL to 85.3 ± 7.6 mg/dL). The absolute pre/post change (increase or decrease) was 6.0 ± 4.6 mg/dL, with a confidence interval (95%) of 3.1–8.9 mg/dL.
LBG and HBG subgroups by response to “recognizing hunger”
shows the increasing mean BG sequence in 89 trained subjects and their response to “recognizing hunger” training. Significant decrease of mean BG by the end of the investigation occurred mainly in subjects with high mean BG at recruitment, whereas mean BG remained relatively constant in subjects with low BG at recruitment. A cutoff value (demarcation point) of mean BG that most significantly divided these two subgroups was identified at 81.8 mg/dL. shows mean BG changes (post- minus pre-values as a function of the BG means at recruitment). A total of 34 subjects below this demarcation point formed the LBG subgroup. A total of 55 subjects above this demarcation point formed the HBG subgroup. Similarly, the BG value of 81.8 mg/dL was used to divide control subjects into LBG and HBG control subgroups ( and ).
Figure 3 Difference after training versus value in mean blood glucose for each trained subject at recruitment.
Abbreviations: HBG, high blood glucose; LBG, low blood glucose.
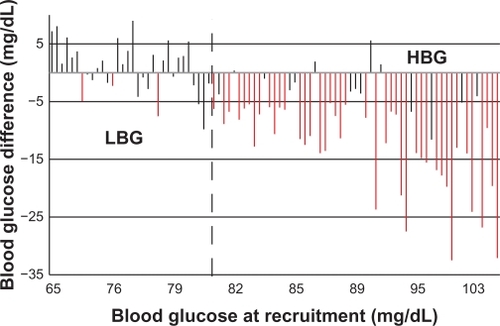
Table 2 Effects of training on metabolic and intake parameters in low and high BG subjects
Differences between LBG and HBG subgroups at recruitment
At recruitment (before training), the LBG subgroup (over the difference in mean BG) showed significantly higher insulin sensitivity index (P = 0.0003), lower insulin AUC (P = 0.02) and BG AUC and peak (both P = 0.0001), diary BG standard deviation (P = 0.01), energy intake per day (P = 0.03), and HbA1c (P = 0.0001) compared with the HBG subgroup. At recruitment, the two LBG and HBG subgroups sharply differed from each other in meal pattern and risk factors.
Effects of “recognizing hunger” in LBG and HBG subgroups
In LBG subjects (BG < 81.8 mg/dL; n = 34: 38.3%) ( and ), mean BG remained constant after training (pre, 76.6 ± 3.7 mg/dL; post, 77.2 ± 4.2 mg/dL; P = 0.499) (), whereas in HBG subjects (≥81.8 mg/dL; n = 55: 61.7%) ( and ), mean BG significantly decreased after training (pre, 91.6 ± 7.7 mg/dL; post, 81.0 ± 7.7 mg/dL; P < 0.0001) (). In the control subgroups, mean BG did not decrease throughout the study in either the LBG or HBG subgroups (). The mean BG, diary-BG SD, and HbA1c significantly decreased in the trained HBG subgroup compared with the control subjects (). Logistic regression longitudinal analyses in these trained and control HBG groups confirmed a significant training effect on mean BG (P = 0.007) and on HbA1c (P = 0.014). In the LBG group, most variables were significantly lower than those in the HBG group since recruitment (), and despite the low value, the diary-BG SD significantly decreased in the longitudinal comparison and in the comparison with the LBG control group.
In summary, the training decreased insulin AUC, index of whole body insulin resistance, and HbA1c, and increased the insulinogenic index only in HBG subjects, and prevented the rise of these metabolic risk factors in LBG subjects.
Other trials
The wellbeing, nutrition, and cardiovascular trials (see Methods section) showed no significant differences between trained and control subjects in the LBG group. In the trained HBG group (), the decreases in days with abdominal pain or stomach ache, in diastolic blood pressure and in LDL to HDL cholesterol ratio, and the increase in the HDL cholesterol were significant and significantly larger than in the control HBG group (P < 0.005; the Bonferroni correction required at least P < 0.01; see Statistical analysis section above).
“Recognizing hunger” fading and overlapping HBG
At clinical examination after 7 weeks of training, 77 out of 89 trained subjects reached mean preprandial LBG, and 62 maintained this level at the end of the study. Achieving LBG appeared to be difficult for six out of nine subjects with high pre-training BG means (around 100 mg/dL). Six further HBG subjects reported being involved in heavy outdoor work for 8–10 hours every day in a cold winter during the study. Their reports, insulin, BG AUCs, and insulin sensitivity index () at final examination suggested they complied with the “recognizing hunger”, but they did not achieve mean preprandial LBG.
Table 4 Effects of heavy outdoor work in 6 of 27 trained subjects who remained with high BG at investigation end
Discussion
Clinical events
In a third-level referring center, we investigated gastroenterology patients with a functional bowel disorder, a self-recovering disease. Subjects considered compliance as difficult before training and easy after training. Yet, about one-third of the subjects already maintained a mean LBG by free personal choice at recruitment. The easy maintenance and the rapid recovery allowed sustained compliance. The functional disorder was significantly associated with high mean BG (and insulin resistance) in HBG subjects, and possibly with high SD of BG in LBG. In infants, we suggested that positive balance of energy stimulates a diarrheic feedback.Citation9 Recurrences are prevalent in the adult population throughout life and are sufficient to motivate balance correction (training in “recognizing hunger”) in a large part of population to improve insulin sensitivity and metabolic risk factors.
Subjective and objective assessments
The training was subjective. Subjects learned to recognize IH on the first day and adapted food intake to the arousal of this target sensation three times a day. The BG association checked the consistency of the “recognition of hunger”. BG is an index of current energy availability to body cells in healthy people on a mixed diet.Citation1–Citation3 In our experience of BG measurements, premeal values are actually lower than after food intake in healthy people on a mixed diet. A week sequence of BG measurements before meals shows nutrient delivery (in situations of mixed food intake) to body tissues at their lowest points. This is a standard metabolic assessment that allows comparisons and also the evaluation of sufficiency or excess of nutrient delivery to body tissues. This delivery of nutrients is the purpose of eating. Daily energy intake does not give information on energy availability. The standard week assessment is even more important because mean BG was maintained as a habit in control subjects, ie, for a longer period than 1 week, and was individual, differing from one person to another. Before initial abstinence from food (before training), HBG subjects habitually forestalled the arousal of the physiological regulation mechanism and maintained positive energy balance. On the basis of the high SD of BG (), the meal pattern of untrained LBG subjects was irregular from one meal to another in comparison with during the “recognition of hunger”, regardless of null balance, low mean BG, and weight stability in a longer period.Citation5 We cannot conclude that LBG coincided with “recognizing hunger” (see below).
Unremitting adjustment to energy expenditure
The food diary with preprandial BG measurements also served as an educational instrument. We trained (and checked) the participants to “recognize hunger” and to adjust food intake according to sensations meal-by-meal with the reported diary. Five-month energy balance showed reliability of the reported “recognition of hunger”. Within this view, dieting represents a rough attempt to achieve an ideal weight without understanding and implementing the necessary meal-by-meal adjustments to expenditure.
Sufficient intake by “recognizing hunger”
Trained HBG but not LBG subjects showed a cumulative balance that was negative during the 5 months, and the longitudinal difference was significant in comparison with control subjects. The significant decrease of body weight, BMI, and arm and leg skin-fold thickness in the HBG group and the stability of the LBG group confirmed a persistent implementation of “recognizing hunger” and associated adjustments to energy expenditure throughout the duration of this investigation. Another paper has detailed the effect of the “recognition of hunger” on body weight using a larger sample.Citation5 The maintenance of previous physical activities in all trained subjects and the improvement in nutrition parameters in the HBG subgroup () demonstrate that meals taken by trained subjects were sufficient to meet energy needs. This confirms earlier controlled, randomized studies in children with chronic nonspecific diarrhea, in which daily activity was preserved and body weight increased normally after 7 months, 4 years, and 12 years of complying with a pediatric adaptation of the present training.Citation9–Citation13
Diabetes prevention
It is interesting that insulin production decreases with increasing noninsulin dependent diabetes (NIDD) duration and HbA1c level.Citation18 In this study, the HBG control subgroup decreased insulinogenic index of beta cell function, whereas the HBG trained subgroup increased it. The difference between control and trained subgroups was significant; this implies higher insulin production, preservation of beta cell function, and the possibility of an innovative therapy designed to preserve or even improve functional beta cell mass by “recognizing hunger”.Citation18 In a longitudinal investigation of 13,163 subjects, a fasting plasma glucose of ≥87 mg/dL (4.8 mmol/L) was found to be associated with an increased risk of NIDD in men compared with those whose fasting plasma glucose was <81 mg/dL (4.5 mmol/L).Citation22 Assessment and classification of meal habits allows correction toward metabolic risk decrease, as in Framingham studies.Citation15
Diabetes treatment
In this research, “recognizing hunger” prevented insulin resistance and NIDD in young, clinically healthy subjects with “normal” BG. The aim was to suppress subclinical inflammation (pro-inflammatory state) and the associated functional disorders and evolving vascular diseases.Citation23–Citation25 “Recognizing hunger” may also be helpful to some people with NIDD. Unfortunately, “recognizing hunger” contrasts the currently prevailing idea of constancy in time of daily energy intake. NIDD patients may have no hunger sensation at all. Absent arousal of hunger facilitates low energy intake. As an extreme example, two meals per day of 50 g of fish and salad, 100 kcal per meal, produced rapid and large weight loss and recovery of hunger sensations after adequate weight loss. Some of these people who lost weight show low estimation error of BG after training in “recognizing hunger”.Citation4 The low error validates “recognizing hunger”, and prevents regaining body weight.Citation5 Thus, adaptation of “recognizing hunger” to treating aged people with fully developed NIDD requires further investigation, and suggests that current treatment practices shall survive for some of these patients.
“Recognizing hunger” fading and overlapping HBG
Mean BG had little absolute change (13.2% ± 10.1% of the range at recruitment in mean BG in the 120 investigated subjects: 64.5 mg/dL to 109.9 mg/dL) in control subjects over 5 months. The division of the 120 subjects into ten strata at recruitment was a classification of associated meal pattern. Subjects chose “recognizing hunger” at the lowest level of BG availability during the day. It is no surprise that “recognizing hunger” largely coincides with LBG meal patterns. The point of mean inversion was at 81.8 mg/dL. However, 27 out of 89 subjects persisted at HBG level at final investigation, although 15 out of 27 were within LBG limits after 7 weeks of training. Six subjects were engaged in heavy work during cool winters. The six subjects had a mean BG of 86.4 ± 4.0 mg/dL, which showed no difference from 87.1 ± 5.3 mg/dL in 21 out of 27 other subjects. IH developed in these outdoor heavy workers at higher levels than 81.8 mg/dL for high expenditure. The division between compliance and noncompliance with “recognizing hunger” is statistically strong at 81.8 mg/dL, but some subjects may “recognize hunger” and overlap with HBG during transient or persistent conditions of high energy expenditure.
Conclusion
“Recognizing hunger” showed a strong statistical association with LBG, with some overlapping with HBG in a few subjects with high energy expenditure and was associated with metabolic improvements as in previous investigations, although only in 55 out of 89 HBG trained subjects.Citation4–Citation6 A total of 38.3% of randomized trained subjects maintained LBG (to that at recruitment), and only decreased the SD of diary BG by “recognizing hunger”. This decrease in SD with the maintenance of the mean suggests that part of the untrained population often recognizes hunger before eating. “Recognizing hunger” as a training method may be a rationalization of the use of physiological stimuli to eat in order to improve health.
Acknowledgements
The authors wish to thank: Laura Chiesi and Stefania Bini MD for dietary analyses; Riccardo Bianchi, David Lovell-Smith, Andrea Giommi (Statistics professor), and Stella Zagaria for technical support; and Stephen Buetow, Tim Kenealy, Chris Harshaw, Simon Thornton, Kent Berridge, James Gibbs, Charlotte Erlanson-Albertsson, and Michael Hermanussen for helpful insights on earlier drafts of this paper. This research was supported by the Italian Ministry of University, Research, Science and Technology grants for the years 1998–2002 and ONLUS Nutrizione e Prevenzione, Firenze for years 2003–2008.
Disclosure
The authors declare that they have no competing interests.
References
- De GraafCBlomWASmeetsPAStafleuAHendriksHFBiomarkers of satiation and satietyAm J ClinNutr2004796946961
- GavinJR3rdPathophysiologic mechanisms of postprandial hyperglycemiaAm J Cardiol2001882S4S8
- ElliottSSKeimNLSternJSTeffKHavelPJFructose, weight gain, and the insulin resistance syndromeAm J ClinNutr2002765911922
- CiampoliniMBianchiRTraining to estimate blood glucose and to form associations with initial hungerNutrMetab (Lond)2006342
- CiampoliniMLovell-SmithDSifoneMSustained self-regulation of energy intake. Loss of weight in overweight subjects. Maintenance of weight in normal-weight subjectsNutrMetab (Lond)201074
- CiampoliniMLovell-SmithDBianchiRSustained self-regulation of energy intake: initial hunger improves insulin sensitivityJ NutrMetab [Epub 2010 Jun 22]
- TalleyNJDyspepsiaGastroenterology200312541219122614517803
- DrossmanDAThe functional gastrointestinal disorders and the Rome III processGastroenterology200613051377139016678553
- CiampoliniMContiABernardiniSInternal stimuli controlled lower calorie intake: effects after eight months in toddler’s diarrhoeaItal J Gastroenterol198719201204
- CiampoliniMBiniSGiommiAVicarelliDGiannelliniVSame growth and different energy intake over four years in children suffering from chronic non-specific diarrheaInt J Obesity Relat Metab Disord19941811723
- CiampoliniMBorselliLGiannelliniVAttention to metabolic hunger and its effects on Helicobacter pylori infectionPhysiolBehav2000703–4287296
- CiampoliniMInfants do request food at the hunger blood glucose level, but adults don’t any more [abstract]Appetite200646345
- CiampoliniMBecherucciPGiommiADecrease in serum IgE associated with limited restriction in energy intake to treat toddler’s diarrheaPhysiol Behav19914911551602017470
- BiniSCiampoliniMChiesiLVicarelliDEnergy need and glycemia before the meals of 23 normal-weight IBS adultsAppetite199219166
- SingerDENathanDMAndersonKMWilsonPWFEvansJCAssociation of HbA(1c) with prevalent cardiovascular disease in the original cohort of the Framingham Heart StudyDiabetes19924122022081733810
- MoriharaKOkaTTsuzukiHTochinoYKanayaTAchromobacter protease I-catalyzed conversion of porcine insulin into human insulinBiochemBiophys Res Commun1980922396402
- MatsudaMDeFronzoRAInsulin sensitivity indices obtained from oral glucose tolerance testing: comparison with the euglycemic insulin clampDiabetes Care19992291462147010480510
- WiesliPSchäfflerESeifertBSchmidCDonathMYIslet secretory capacity determines glucose homoeostasis in the face of insulin resistanceSwiss Med Wkly200413437–3855956415551159
- CiampoliniMVicarelliDSeminaraSNormal energy intake range in children with chronic nonspecific diarrhea: association of relapses with the higher levelJ Pediatr Gastroenterol Nutr19901133423502246716
- ArmitagePBerryGStatistical Methods in Medical Research3rd edOxford, UKBlackwell1994
- GodfreyKComparing the means of several groupsNew Engl J Med198531323145014564058548
- TiroshAShaiITekes-ManovaDNormal fasting plasma glucose levels and Type 2 diabetes in young menNew Engl J Med2005353141454146216207847
- ReavenGMThe metabolic syndrome: is this diagnosis necessary?Am J Clin Nutr20068361237124716762930
- FestaAD’AgostinoRJrHowardGMykkänenLTracyRPHaffnerSMChronic subclinical inflammation as part of the insulin resistance syndrome: the Insulin Resistance Atherosclerosis Study (IRAS)Circulation20001021424710880413
- MollerDEFlierJSInsulin resistance – mechanisms, syndromes, and implicationsNew Engl J Med1991325139389481881419