 ?Mathematical formulae have been encoded as MathML and are displayed in this HTML version using MathJax in order to improve their display. Uncheck the box to turn MathJax off. This feature requires Javascript. Click on a formula to zoom.
Abstract
Purpose:
Skin prick testing (SPT) is fundamental to the practice of clinical allergy identifying relevant allergens and predicting the clinical expression of disease. Wheal sizes on SPT are used to identify atopic cases, and the cut-off value for a positive test is commonly set at 3 mm. However, the measured wheal sizes do not solely reflect the magnitude of skin reaction to allergens, but also skin reactivity (reflected in the size of histamine reaction) and other random or non-random factors. We sought to estimate wheal sizes exclusively due to skin response to allergens and propose gender-specific cutoff points of atopy.
Methods:
We developed a Bayesian method to adjust observed wheal sizes by excluding histamine and other factor effects, based on which revised cutoff points are proposed for males and females, respectively. The method is then applied to and intensively evaluated using a study population aged 18, at a location on the Isle of Wight in the United Kingdom. To evaluate the proposed approach, two sample t-tests for population means and proportion tests are applied.
Results:
Four common aeroallergens, house dust mite (HDM), grass pollen, dog dander, and alternaria are considered in the study. Based on 3 mm cutoff, males tend to be more atopic than females (P-values are between 0.00087 and 0.062). After applying the proposed methods to adjust wheal sizes, our findings suggest that misclassifications of atopy occur more often in males. Revised allergen-specific cutoff values are proposed for each gender.
Conclusion:
To reduce the gender discrepancy, we may have two potentially convenient solutions. One way is to apply allergen-specific and gender-specific cutoff values following the proposed method. Alternatively, we can revise the concentration of allergens in the SPT solutions but keep the cutoff values unchanged, which may be more convenient to clinicians.
Introduction
Atopy is regarded as an inherited predisposition for diseases such as eczema, asthma, or rhinitis. Skin prick testing (SPT) to allergens is commonly used to identify allergic sensitization or atopy. Although some previous studies have suggested different cutoff values,Citation1,Citation2 in clinical practice, a 3 millimeter (mm) cutoff wheal size on SPT is the criterion generally used to define a positive response and, therefore, sensitization. An atopic status is defined as the presence of sensitization to one or more allergens using this cutoff.
The present work is motivated by a discrepancy observed in our birth cohort between atopy and atopy-related diseases such as eczema. The cohort was established between 1989 and 1990 on the Isle of Wight (IOW) in the United Kingdom to prospectively study the natural history of allergic disorders. Skin prick testing was performed on most participants attending the research center to a standard battery of common allergens (ALK, Horsholm, Denmark), including aeroaller-gens (house dust mite, cat dander, dog dander, Alternaria, Cladosporium herbarium, grass pollen mix, and tree pollen mix) and food allergens (cows’ milk, soya, hens’ egg, peanut, and cod). In this work, we focus on individuals aged 18, which includes 405 males and 445 females. provides sensitization prevalence for four allergens, house dust mite (HDM), grass pollen, dog dander, and Alternaria, together with percentages of eczema among sensitized cases. As shown in the table, with atopic status determined by the 3 mm cutoff, significantly more males are sensitized than females based on two-sided two-sample proportion tests (significance level is set at 0.01 after adjusting for multiple testing). However, among the atopic children, the proportion of males who developed eczema tends to be lower than (but not statistically significant based on the same type of tests) that of females, although more males are atopic. For instance, about 35% of males are sensitized to HDM, which is significantly higher than that of females (23.37%). However, among the atopic males, about 14% developed eczema, which is lower than that of females (21.15%). We also examined the other two allergic diseases, asthma and rhinitis. Comparable patterns are observed (results not shown). Although for allergen Alternaria, higher proportions of atopic males developed asthma and/or rhinitis, the differences are statistically insignificant. These observations (more atopic males but fewer with allergic diseases) conflict with the well-established positive association between atopy and atopy related diseases such as eczema and asthma.Citation3–Citation5 These observed discrepancies made us wonder whether atopic status was misclassified.
Table 1 Comparison between gender of atopy prevalence and percentage of atopic cases having eczema based on 3 mm cutoff (405 males and 445 females)
To examine the existence of atopy misclassification, we first compared total immunoglobulin E (IgE) between gender in our cohort. The result shows insignificant difference between males and females (the average total IgE for males is 296.0 ng/ml vs 287.4 ng/ml for females; P-value = 0.23 from two-sided two sample t-test for population means), which agrees with findings in other studies.Citation6 In addition, results from another cohortCitation7 along with findings from other studies examining the agreement of atopic status determined by SPT and by specific IgEs reached the same conclusionCitation8. That is, insignificant differences of atopy prevalence exist between gender based on specific IgEs but significant differences are found based on SPT. Specific IgEs and total IgE are antibody classes regarded as an important factor in the pathogenesis of allergic diseases and higher IgE measures indicate higher probabilities of allergic sensitization. This implies that we ought to expect insignificant gender difference in atopy in general populations. This conflicts with our findings on SPT testing results and consequently indicates the possible existence of misclassifications from SPT.
Since skin reactivity plays a role in the determination of wheal sizes and this reactivity, reflected in histamine wheal size, varies between gender at any given age,Citation1,Citation9–Citation11 cutoff points determined based on SPT wheal sizes without adjustment for these factors may not correctly identify allergic sensitization or determine atopic status. Thus to reduce the possibility of misclassification, two venues may be taken: adjusting the wheal sizes or proposing revised cutoff values that are gender-specific. Both directions aim to correct misclassifications, specifically non-differential misclassifications (misclassifications independent from disease or exposure status). Non-differential misclassifications can cause misleading inferences if left unchecked. In linear or logistic regressions, such errors may lead to biased estimates of coefficients.Citation12–Citation14 In many situations, the misclassifications are actually caused by mismeasured continuous variables.Citation15 This can be the situation of SPT wheal size measures in the sense that they are not exclusively a result of allergen reaction; skin reactivity also contributes to the size of a wheal.
In this article, through a Bayesian hierarchical joint modeling, we first infer wheal sizes in response exclusively to allergens, and then propose gender specific cutoff values for sensitization. The utilization of the Bayesian method was motivated by the hierarchical structure between atopy and atopy related diseases. Due to the similar discrepancy patterns observed in asthma, eczema, and rhinitis, throughout this article, we use eczema to demonstrate the method. In the Discussion section, we briefly summarize results from the other two allergic diseases. We focus on four common aeroallergens, HDM, grass pollen, dog dander, and Alternaria. These four allergens are well represented in the IOW cohort data. Other allergens are not considered due to the sparsity of positive SPT reactions or their cross-reactivity with these four allergens. We expect the work has the potential to resolve the disagreement noted above, which will consequently improve the diagnosis and management of allergic diseases.
Material and methods
We start this section by presenting the modeling of observed wheal sizes and that of the association between eczema and wheal sizes in reaction to allergen (hereafter, true wheal sizes). From the discussion above, the atopy prevalence among males is expected to agree with atopy prevalence among females in general populations, and there should not exist gender differentiated association between true wheal sizes and the risk of eczema.
Model construction
In the following, we discuss the modeling separately for observed wheal sizes, true wheal sizes, and the risk of eczema. In the next section, they are linked through a joint modeling process.
The observed wheal size
Let Oij denote the observed wheal size of person i with gender j (j = 1 for females) in reaction to an allergen. The observed wheal size is a mixture of response to the allergen, skin reactivity and other unknown random factors. We use Tij to denote the latent (unknown) true wheal size. The difference between the expected value of Oij and Tij, denoted as Fij, is modeled as a function of histamine effects (which reflects skin reactivity) and possible interaction effects between the allergen and histamine. We formulate them as follows:
(1)
where αj denotes an overall gender effect on the observed wheal sizes and a constraint α1 + α2 = 0 is applied to avoid singularity, βlij is a random slope for the contribution of histamine Hij, and β2ij is treated as being random as well indicating an interaction effect between allergen and histamine. The interaction is denoted as Tij × Hij in model (1). The random coefficients are assumed to be normally distributed with
and
. Note that gender-specific variances are assumed in the distributions of βlij and β2ij. These flexible assumptions allow gender-specific effects of histamine and its interaction with Tij, which were motivated by the findings from our cohort (at age 18, the average histamine wheal size of males is 5.46 cm and of females is 5.09 cm; P-value = 0.00004 based on two-sided two sample t-tests for population means). Finally, ∈ij explains unknown random effects on Oij and is assumed to be normally distributed with mean zero and variance
.
The true wheal size
The latent variable Tij in (1) represents wheal sizes in reaction to an allergen (the true wheal size). We model Tij as
(2)
in which ϒ denotes what we expect on wheal sizes for a general population in reaction to an allergen, regardless of gender. The second term δij is for random errors. It represents possible differentiated reaction to the allergen at an individual level. We assume δij is half-normally distributed, that is,
where zero and
denote the mean and variance in the corresponding normal distribution function. The density of the half-normal distribution defined above is in a shape of a half bell-curve starting at zero. This distribution function is utilized to reflect the fact that most subjects are non-atopic. Besides the half normal distribution, other skew distributions can be possibly applied, for instance, the skew normal distribution.Citation16,Citation17
The message conveyed by model (2) is that the wheal sizes of males and females are expected a priori to follow the same distribution. However, if Fij and ∈ij in (1) are not sufficient to explain gender discrepancy, the skew-distributed random error δij can still possibly differentiate males’ and females’ true wheal sizes. In this case, data for different genders are likely to be generated from different parts of a half-normal distribution.
The association between eczema and atopy
Since atopy is considered as a risk factor of eczema, modeling the association between true wheal sizes (Tij) and eczema seems a reasonable instrument in the process of identifying misclassifications. A logistic regression given below is considered:
(3)
where Yij takes values 1 or 0 denoting the status of eczema. EquationEquation (3)
(3) evaluates gender effect τj (assuming τ1 + τ2 = 0 to avoid singularity) and the effect of true wheal size (η1) to the odds of eczema.
Statistical analysis
We consider a method of joint modeling to infer the true wheal size. Joint modeling is appropriate for data sharing features in common. It has been used in analysis of combined longitudinal and survival data,Citation18–Citation20 random effects data,Citation21 and mark-recapture data.Citation22 The joint model in our analysis is composed of two parts: the modeling of observed wheal sizes and the modeling of association between the true wheal size and the risk of eczema. The models presented in (1) to (3) are linked to each other with Tij being the joint. We include a brief structure of the joint model in .
Figure 1 Conceptual structure of the joint model.
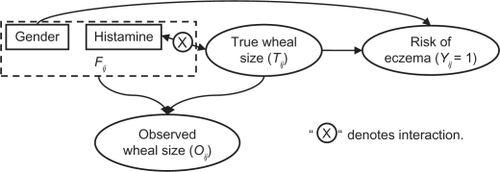
Let f(.) denote a generic density function. EquationEquations (1)(1) to Equation(3)
(3) induce a joint density of Yij, Oij, and Tij in a hierarchical structure, which is
(4)
Here we suppress the dependence on the unknown parameters for simplicity. The last equality is due to the assumption that the observed wheal size does not provide any additional information at the presence of true wheal size (non-differentiable measurement errors). The advantage of a joint analysis is that more sources of information can be incorporated, and thus the inference on true wheal sizes is expected to be more accurate. The joint model presented in (4) allows us to infer Tij based on information from two sources, the disease status Yij and observed wheal size Oij. Inferences of Tij will be further used to facilitate the revision of the 3 mm cutoff point.
Let
denote a collection of parameters. The hierarchical structure shown in (4) motivated us to utilize the Bayesian method to infer the parameters and true wheal sizes Tij. Here we briefly discuss the steps necessary to draw Bayesian inferences. To be fully Bayesian, we assign prior distributions to each parameter. Prior distributions of coefficients including αj, γ, η0, η1 and τj are selected as vague normal distributions with mean zero and large variances. Prior distributions of variance components including
,
,
and
are assumed to follow inverse gamma distributions with scale and shape parameters being 0.5 and 0.0005, respectively.Citation23 Once prior distributions are specified, the joint posterior distribution of the parameters can be formulated using Equationequations (1)
(1) to Equation(4)
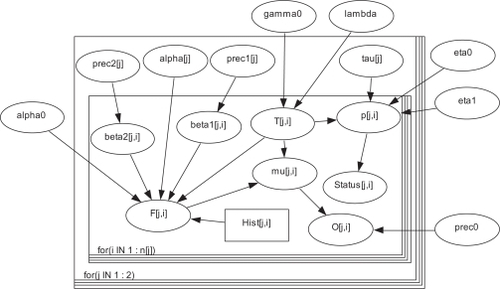
(4) in a hierarchical way. Next, we use the Markov Chain Monte Carlo (MCMC) approach, specifically, the Gibbs sampler to draw samples for each parameter and Tij from the joint posterior distribution. The convergence of the MCMC chains is examined using the method proposed in pervious studies.Citation24–Citation26 The program is coded in WinBUGS.27 A detailed graphical structure with all parameters included are given in the Appendix () along with the corresponding WinBUGS program ().
Appendix Figure 1 The detailed structure of the Bayesian joint model.
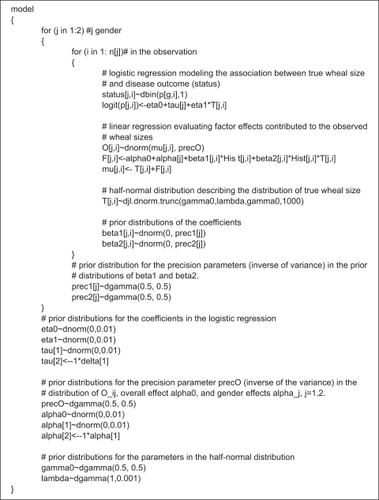
Appendix Figure 2 The WinBUGS program corresponding model structure in .
Defining adjusting factor Fj and cutoff value

The proposed approach draws inferences on the true wheal sizes Tij. In practice, clinicians or epidemiologists may be more interested in handy cutoff values, which is practically more meaningful. Based on posterior inferences of Tij and Fij, we propose revised cutoff points
applied to Oij for males and females, respectively. The revised cutoff value is defined as
according to (1), j = 1, 2, where the 3 mm is the current cutoff value and F̑j denotes an estimate of adjusting factor Fj. The adjusting factor can be estimated by taking the means of posterior estimates of Fij for each gender; recall Fij in (1) represents an adjustment to each individually observed wheal size. It can also be estimated as the difference between Oj and T̑j for gender j, where Oj is the mean of observed wheal sizes Oij, T̑j is the estimate of mean true wheal size for gender j and is calculated as the sample mean of the inferred true wheal sizes Tij.
Examining the proposed method
To evaluate the insights brought in by Tij and
, we examine if the discrepancy is reduced or eliminated between males’ and females’ prevalence in atopy and in eczema among atopic cases. We apply two-sided two sample proportion tests to test the difference between genders of atopy prevalence and of eczema prevalence among atopic cases. We then compare the results from Tij and
to those from Oij and the 3 mm cutoff value. We also evaluate the difference of Tj between genders, and compare it with the difference of Oj between genders. For this purpose, two-sided two sample t-tests applied to population means are applied. For each type of test, the Bonferroni approach is used for multiple testing corrections. The experiment-wise significance level is set at 0.05.
Results
Inferences of Tij and
Using the proposed method, we infer Tij and the adjusting factors for each of the four allergens (HDM, grass pollen, dog dander, and Alternaria). includes descriptive statistics (mean and standard deviation) of Oij and Tij for each gender, denoted as Oj and T̑j in the table, respectively. The revised cutoff values
are presented in the last column of the table. As shown in the table, overall the results are consistent across different allergens for each gender. For females, T̑j agrees with Oj, and
agrees with the commonly used 3 mm cutoff point. However, this is not the case for males. For males, T̑j’s are all smaller than Oj’s and larger cutoff values are suggested.
Table 2 Summary of observed and inferred wheal sizes and proposed cutoff values (The unit of each variable is in millimeters. Standard deviations are in the parentheses)
By comparing the differences of Oj between genders and the differences of T̑j between genders, we can see that the adjusting process clearly has the ability to reduce the disagreement of wheal sizes between males and females. In particular, as indicated by the P-values, the disagreement of wheal sizes between gender based on Tij is eliminated for all allergens except for HDM. The significant differences between genders for HDM implies that besides histamine reactivity effect and its interaction with HDM, other unknown but non-random factors may also contribute to the formation of discrepancy. Further studies are needed to identify those possible factors. On the other hand, as indicated by the reduction of P-values, although gender discrepancy is not eliminated for HDM, the probability of observing such difference between males and females under the null hypothesis is increased compared to that based on Oij. This implies that on average the dissimilarity between males’ and females’ wheal sizes is reduced based on the inferred true wheal sizes.
The inferences of Tij discussed so far are promising in that gender discrepancy in wheal sizes is significantly reduced. However, the reduction of disagreement in wheal sizes does not necessarily lead to a discrepancy reduction in the prevalence of sensitization to an allergen. This is examined in the following section.
Prevalence comparison based on Tij
To compare sensitization prevalence between gender using Tij (true wheal size), a cutoff value
applied to Tij is needed. We use inferences related to grass pollen to demonstrate the
selection process. plots the prevalence of sensitization based on Tij versus different cutoff values. The difference of prevalence between genders decreases as the cutoff value increases, which implies the importance of choosing an appropriate cutoff value. As indicated in , the revised cutoff values for females (the last column of ) in general agrees with the commonly applied 3 mm cutoff point. Our paired tests further indicate that Ti1 agrees with Oi1 in all the four allergens (all P-values > 0.05. For this grass pollen example, the P-value is 0.79). These results imply that for females the sensitization prevalence based on Oi1 is expected to agree with the prevalence based on Ti1. As discussed below, this finding is then utilized to determine an atopy cutoff value for Tij applied to both genders, since there is no significant difference of Tij between genders.
Figure 2 The relationship between sensitization prevalence of wheat and cutoff value based on Tij.
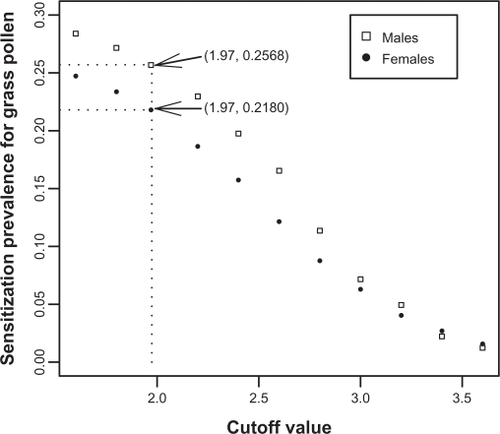
The prevalence of atopy for females based on Oij is 21.34% as in . Given the agreement between Oi1 and Ti1, we apply this prevalence to Tij resulting in a cutoff value
. Using this cutoff value, the sensitization prevalence for males is 25.68% and for females is 21.80% (different from 21.34% due to rounding errors), which are insignificantly different from each other (P-value = 0.09). The same procedure is repeated for the remaining three allergens. The cutoff values
and the comparison of sensitization prevalence between genders are summarized in . After adjusting for multiple testing using the Bonferroni method (multiple testing adjusted significance level = 0.0125), the differences of atopy prevalences between genders are no longer statistically significant for any single allergen. Utilizing information summarized in , we then identified the individuals, especially males, who are misclassified into the atopic group by applying the 3 mm cutoff to the observed wheal sizes Oij. Specifically, among 142 males originally classified into the HDM sensitization group, 25 (17.61%) are misclassified; results of misclassification for grass pollen, dog dander, and Alternaria are 4 (3.70%) out of 108, 16 (32%) out of 50, and 14 (35.90%) out of 39, respectively.
Table 3 Cutoff values and sensitization prevalence comparison between gender based on Tij
So far our focus is on the prevalence of atopy. We now turn to the comparison of eczema prevalence among atopic cases. The results are given in . Comparing the prevalence differences between genders, we can see that the results of insignificant differences drawn from Oij (see ) are kept for Tij. This finding, coupled with the findings on Tij-based atopy prevalence, demonstrates the applicability of the proposed adjusting process. This process has the potential to correct the bias in wheal size measuring and resolve the conflict between atopy prevalence and findings on eczema prevalence and IgE measures.
Table 4 Eczema cases with positive sensitization based on Tij
In an early section, we proposed cutoff values
applied to Oij. Even with the promising gain from inferring Tij, to clinicians and epidemiologists, it is possibly more convenient to use
. In the next section we examine if we can reach the same conclusion on the elimination of gender discrepancy by using
.
Prevalence comparison based on
We apply the revised cutoff value
given in to the observed wheal sizes to infer the prevalence of sensitization and that of eczema among atopic cases. The results are presented in . Compared to the results given in , the updated prevalence differences between genders for each allergen are less significant, although for HDM the significant gender discrepancy still exists. The prevalence of eczema among atopic cases is not significantly different between males and females for each individual allergen, the same trend as in .
Table 5 Comparison of prevalence between gender based on
of sensitization and percentage of atopic cases having eczema
By using although the gender discrepancy cannot be completely eliminated for all allergens and the results are not as promising as those based on Tij ( and ), the revised cutoff value
does have the potential to decrease the significance of gender discrepancy in sensitization prevalence.
Discussion
Motivated by the inconsistency between the wheal size-based atopy prevalence in men and women and the results of IgE measures, we developed a Bayesian method to estimate true wheal sizes and proposed gender-specific sensitization cutoff values for different allergens. The disease outcome considered in this work is eczema. The allergens considered are common aeroallergens including house dust mite, grass pollen, dog dander, and Alternaria.
Based on inferred true wheal sizes (Tij), the differences in sensitization prevalence between males and females are statistically insignificant with respect to each individual allergen, and the chance that sensitized males developing eczema is comparable to that of sensitized females. This indicates a significant improvement compared to the results based on observed wheal sizes with the 3 mm cutoff. On the other hand, if we apply the revised cutoff values
to observed wheal sizes (other than directly using inferred Tij), our results showed limited improvement. It thus seems more reasonable to adjust the observed wheal sizes than to revise the 3 mm cutoff value for each allergen and gender. The findings can be further assessed by calculating the sensitivity and specificity with the help of gold standard such as radioallergosorbent test proposed in early studies.Citation28,Citation29 We also applied the method to two other allergic diseases, asthma and rhinitis. Similar results are drawn for allergens HDM, grass pollen, and dog dander. For Alternaria, results from the method suggest adjusting wheal sizes is unnecessary.
On the other hand, since utilizing revised cutoff values () does reduce the differences between males and females, although the reduction is not significant in some situations, one may wonder the possibility to propose cutoff values separately for males and females but apply to all allergens. We further investigated this possibility. Based on the results given in , we used 3.5 mm cutoff for males and 3 mm cutoff for females. These cutoff values are applied to all allergens. However, as indicated by the results in , very limited reduction in the statistical significance is observed. Similar results are obtained when using other cutoff values different from 3.5 mm. This finding indicates that just revising cutoff points applied to all allergens may not at all solve the prevalence discrepancy between males and females. Instead, we may have to deal with each individual allergen.
Table 6 Comparison of prevalence between gender of atopy and percentage of atopic cases having eczema based on different cutoffs on all allergens
Conclusion
To correct misclassified atopic cases caused by gender discrepancy, we can utilize the proposed statistical methods to adjust wheal size measures. Besides adjusting observed wheal sizes, we found that using allergen-specific cutoff values different for men and women () will also reduce the occurrence of misclassifications.
Clinicians may prefer the same cutoff value applied to all allergens. To achieve this goal and keep misclassification reduced, a laboratory-related alternative solution may be possible. Specifically, based on the inferred cutoff values , one can adjust the concentration of allergens used in the prick test solutions for men and women, respectively. The results from this work may assist the determination of allergen concentration. This approach makes it possible to reduce the gender discrepancy in atopy without revising cutoff values. Our work shows that future clinical, mechanistic, and epidemiological studies are needed to optimize the skin prick test to make it agree with results from specific IgE levels.
Acknowledgements
This work was supported by the National Heart, Lung, and Blood Institute at the National Institute of Health (5R01 HL082925, PI: Arshad SH; 1R03HL095429, MPI: Zhang H).
Disclosure
The authors report no conflict of interest in this work.
References
- GergenPTurkeltaubPKovarMThe prevalence of allergic skin test reactivity to eight common aeroallergens in the US population: results from the second national health and nutrition examination surveyJ Allergy Clin Immunol1987806696793680811
- ChinnSJarvisDLuczynskaCMeasuring atopy in a multi-centre epidemiological studyEuropean Journal of Epidemiology1996121551628817194
- ArshadSKarmausWMatthewsSAssociation of allergy related symptoms with sensiti-sation to common allergens in an adult european populationJ Inves Allergology Clin Immunol20011194102
- SlyPBonerABjörkstenB
- GergenPArbesSJrCalatroniATotal ige levels and asthma prevalence in the us population: results from the national health and nutrition examination survey 2005–2006Journal of Allergy and Clinical Immunology200912444745310.1016/j.jaci.2009.06.01119647861
- ShoormastiRPourpakZEshraghianMThe study of total ige reference range in healthy adults in tehran, iranIranian J Public Health2010393236
- Van EerdeweghPLittleRDupuisJAssociation of the adam33 gene with asthma and bronchial hyperresponsivenessNature200241842643012110844
- BousquetPCastelliCDauresJAssessment of allergen sensitization in a general population-based survey (european community respiratory health survey i)Ann Epidemiol20102079780320702109
- BarbeeRLebowitzMThompsonHImmediate skintest reactivity in a general population sampleAnn Intern Med197684129133766679
- PeatJWoolcockASensitivity to common allergens: relation to respiratory symptoms and bronchial hyper-responsiveness in children from three different climatic areas of australiaClin Exp Allergy1991215735811742649
- MeinertRFrischerTKarmausWInfluence of skin prick test criteria on estimation of prevalence and incidence of allergic sensitization in childrenAllergy1994495265327825719
- GustafsonPMeasurement error and misclassification in statistics and epidemiology: impacts and bayesian adjustmentsChapman and Hall/CRC PressBoca Raton, FL2003
- BrossIMisclassification in 2×2 tablesBiometrics195410478486
- GoldbergJThe effects of misclassification on the bias in the difference between two proportions and the relative odds in the fourfold tableJournal of the American Statistical Association197570561567
- NatarajanLRegression calibration for dichotomized mismeasured predictorsThe International Journal of Biostatistics20095 article 12
- AzzaliniAA class of distributions which includes the normal onesScandinavian Journal of Statistics198512171178
- AzzaliniAFurther results on a class of distributions which includes the normal onesStatistica (Bologna)198646199208
- DingJWangJModeling longitudinal data with nonparametric multiplicative random effects jointly with survival dataBiometrics200864254655617888040
- HendersonRDigglePDobsonAJoint modelling of longitudinal measurements and event time dataBiostatistics (Oxford)200014465480
- TsiatisADavidianMJoint modeling of longitudinal and time-to-event data: an overviewStatistica Sinica2004143809834
- BigelowJDunsonDBayesian Semiparametric joint models for functional predictorsJournal of the American Statistical Association20091044852636
- BarkerRJJoint modeling of live-recapture, tag-resight, and tag-recovery dataBiometrics199753666677
- KelsallJWakefieldJDiscussion of “Bayesian models for spatially correlated disease and exposure data” by best et alBayesian Statistics19996151
- GelmanARubinBDInference from iterative simulation using multiple sequencesStatistical Science19927457511
- GelmanARubinDBA single series from the Gibbs sampler provides a false sense of securityBernardoJMBergerJODawidAPBayesian statistics 4 proceedings of the fourth valencia international meetingClarendon PressOxford University Press625631
- GelmanACarlinJBSternHSBayesian Data AnalysisChapman and Hall/CRC2003
- SpiegelhalterDThomasABestNWinBUGS user manualMRC Biostatistics Unit, Institute of Public Health,Cambridge, UK2003
- DreborgSSkin tests used for epidemiological studiesAllergy1989445259
- HaahtelaTSkin tests used for epidemiologic studiesAllergy1993487680
Appendix
The model structure
The structure in shows the formulation of the Bayesian joint model including models (1) to (3) along with the specified prior distributions. It is drawn using DoodleBUGS.Citation29 Squares represent constant (fixed), ovals represent stochastic or unknown variables, hollow (thicker) arrows are for logical functions (such as definitions or identities), and single arrows are for stochastic dependencies (distributions involved). There are two panels in the figure. The smaller panel indicated by “for (i IN 1:n[j])” is for parameters and random variables related to each individual, the ovals between the bigger panel and the smaller one are for the parameters exclusively related to gender, and the ovals outside the two panels are for common parameters.
The WinBUGS codes
The codes below are consistent with the structure given in .