Abstract
Risk-taking behavior is a major determinant of health and plays a central role in various diseases. Therefore, a brief questionnaire was developed to assess risk taking among young adults with known different levels of risk-taking behavior (social drinkers and recreational drug users). In Study 1, N = 522 university students completed the RT-18 risk taking questionnaire. N = 100 students were retested after 2 to 4 weeks and performed the Cambridge Gambling Task (CGT). Mean RT-18 score was 7.69 and Cronbach’s alpha was 0.886. The test-retest reliability was r = 0.94. Significant correlation was found between the RT-18 score and CGT scores of risk taking, bet proportion, and risk adjustment. In Study 2, N = 7834 young adult social drinkers, and recreational drug users, mean RT-18 score was 9.34 and Cronbach’s alpha was 0.80. Factor analysis showed that the RT-18 comprises two factors assessing level of risk-taking behavior and risk assessment. Men scored significantly higher than women on the RT-18. Recreational drug users had significantly higher scores when compared to social drinkers. In Study 3 of N = 1000 students, construct validity was confirmed by showing that the RT-18 outcome correlates significantly with scores on the Stimulating-Instrumental Risk Inventory. In conclusion, the RT-18 is a valid and reliable screening tool to differentiate levels of risk-taking behavior. This short scale is quick and practical to administer, imposing minimal demands on participants. The RT-18 is able to differentiate risk taking and risk assessment which can help target appropriate intervention strategies.
Introduction
Risk taking can be defined as the intentional or unintentional exposure to the possibility of injury or loss. Risk-taking behavior is a major determinant of health, plays a central role in many diseases, and is related to several health risk factors listed in a 2006 World Bank report.Citation1 For example, risk-taking behavior may be the cause of injury (eg, traffic accidents and self-inflicted injuries), is related to public health hazards (eg, unsafe sex, smoking, alcohol, and recreational drug use),Citation2 and may be a dominant symptom in psychiatric disease such as attention-deficit hyperactivity disorder (ADHD).Citation3 These examples illustrate how some people show higher levels of risk-taking behavior than others. Adolescents and male young adults especially show higher levels of risk-taking behavior and related consequences.Citation4,Citation5
Risk-taking behavior can be functional, necessary, and appropriate in some situations, but can also be dangerous and inappropriate. There are different categories of risks, for example financial, social, legal, physical, and psychological. The outcome of risk-taking behavior is subjective and depends partly on individual circumstances; many decisions in life involve a balance between risk and anticipated reward. Thus, in many cases risk-taking behavior is goal-directed (ie, acquiring the reward) and related to perceived needs.Citation6 Risk-taking behavior has been associated with impulsivity and traits such as sensation seeking, novelty seeking, and venturesomeness.Citation4,Citation7–Citation10 Although closely related, these individual traits do not adequately cover all concepts of risk taking.Citation11 For example, high risk takers sometimes engage in behaviors that can be viewed as sensation seeking (eg, bun-gee jumping). However, other risky behaviors are conducted in a more automatic and/or less conscious way and do not involve sensation or thrill seeking (eg, crossing a road while not attending to the traffic). These two examples of risk taking behavior cannot be both defined as sensation seeking or impulsivity. Instead, sensation seeking, venturesomeness, and impulsivity must be viewed as different expressions of risk-taking behavior. Therefore, it is important to integrate these traits and develop a risk taking questionnaire that differentiates level of risk-taking behavior from level of risk assessment.
Current questionnaires that assess risk-taking behavior are limited by the fact that they are specifically designed to examine adolescents (12–18 years old) or include questions on a variety of risk-taking related daily activities.Citation12–Citation15 The latter is problematic, because it cannot be assumed that everybody who completes the questionnaire is engaged in these activities. To complicate matters, these questionnaires all measure different components of risk-taking behavior, depending on the items that were included in the questionnaire. These studies illustrate that conceptualization of risk-taking behavior differs greatly between researchers. It is of high importance that young adults who are high risk takers can be easily recognized, because early detection of high risk-taking individuals can help improve prevention, health promotion, and diagnosis. Therefore, the aim of our study was to develop a brief risk taking questionnaire in young adults that can be completed and analyzed in minimal time.
The new questionnaire was validated in a large sample of young adult social drinkers and recreational drug users,Citation16 ie, two groups known to differ in levels of risk-taking behavior,Citation17–Citation20 and in a sample of university students.
Materials and methods
Study 1 was conducted in a student population to develop a short risk-taking questionnaire (Risk Taking questionnaire 18 items; RT-18). As part of the Alcohol and Cocaine Impaired Driving survey (ACID survey),Citation16 the psychometric properties of the RT-18 were tested among social drinkers and recreational drug users (Study 2). To examine construct validity, Study 3 compared the RT-18 score with an existing risk-taking questionnaire. The studies were approved by the Institutional Review Board at Utrecht University and performed according to guidelines for Good Clinical Practice.
Development of the RT-18 (Study 1)
Subjects and procedure
N = 550 university and college students in Utrecht, The Netherlands were recruited between September 2008 and October 2008 to complete a two-page survey. To obtain a representative sample of the general student population of Utrecht, students were approached at various locations such as colleges, campuses, fraternities, and libraries. With few exceptions, almost all students agreed to participate (N = 522) and completed the survey at the location of recruitment. Subjects were invited to submit their contact details in order to participate in a follow up study. Of the subjects who were willing to participate, N = 100 were selected according to their scores on the 65-item questionnaire. We aimed at selecting an equal distribution of low-, medium-, and high-scoring subjects. The questionnaire was readministered to these subjects after 2 to 4 weeks and they also performed the Cambridge Gambling Task (CGT).
The risk-taking questionnaire
The preliminary risk-taking questionnaire consisted of 65-items and was composed of subscales on impulsiveness and venturesomeness from the Impulsiveness Venturesomeness Empathy (IVE) questionnaire,Citation7,Citation21 novelty seeking from the Temperament and Character Inventory (TCI),Citation9,Citation22 and impulsive sensation seeking (ImpSS) from the Zuckerman Kuhlman Personality Questionnaire.Citation8 Existing Dutch versions of the IVE and TCI were used;Citation21,Citation22 items of the ImpSS were translated from the English language version.Citation23 These subscales were chosen from a variety of scales and questionnaires, because they reflect traits associated with risk taking. In addition, the scales that were chosen comprise general items, not related to specific subtypes of risk-taking behavior that may not be relevant or apply to the whole population (eg, gambling or drug use). Questions can be answered by “yes” and “no.” Scores are 0 or 1 point per question, adding up to a sum score ranging from 0 to 65.
The CGT
The CGT is part of the CANTAB test battery.Citation24 The test was developed to assess decision-making and risk-taking behavior.Citation25 On each trial, a row of ten boxes is presented across the top of the screen, some of which are red, others are blue. At the bottom of the screen two rectangles are presented, containing the words “red” and “blue.” The subject must guess whether a yellow token is hidden in a red or in a blue box. Subjects start with a number of points which are displayed on the screen and they can select a proportion of these points (5%, 25%, 50%, 75%, or 95% of current points), displayed in either rising or falling order. If the subject chose the correct color the bet placed was added to the overall score; if the subject chose the wrong color the bet was subtracted. The task has two modes: ascending first or descending first. In the ascending mode the stakes rise, whereas in descending mode the stakes decrease. The CGT dissociates risk taking from impulsivity, because in the ascending mode the subject has to wait patiently for the appearance of a higher, more risky bet.
The subject must try to accumulate as many points as possible. The six outcome measures of the CGT are risk taking, quality of decision making, deliberation time, risk adjustment, delay aversion, and overall proportion bet. Of these, risk taking and overall proportion bet are most important predictors of risk-taking behavior. It takes about 30 minutes to complete the test.
Statistical analysis
Statistical analyses were performed using SPSS software (v 16; SPSS Inc, Chicago, IL). Based on N = 522 completed surveys, shortening the 65-item questionnaire into an 18-item questionnaire was done by applying a forward-step regression analysis. The aim was to develop a shortened questionnaire that includes sufficient questions to have a predictive validity of at least 90% of the 65-item questionnaire. Internal consistency (reliability) of the RT-18 was measured by Cronbach’s alpha. Test-retest reliability was determined in N = 100 subjects by correlating RT-18 scores of the initial administration and those of retesting, 2 to 4 weeks thereafter. Validity of the RT-18 was determined by correlating the scores with those of the CGT parameters. In these analyses, data of subjects using psychoactive medication or drugs of abuse were omitted, because these can potentially affect performance on the CGT. Effects were considered significant if P < 0.05 (two-tailed).
Assessing the psychometric properties of the RT-18 (Study 2)
The ACID survey was conducted among a representative sample of Dutch partygoers (18–30 years old) to establish who will drive a car after using alcohol and/or cocaine and why.Citation16 This online survey comprised a large number of questions on demographics and respondent characteristics, alcohol and drug use, reasons for driving after using cocaine, and prevention methods. A total of N = 64,575 subjects read the invitation and N = 10,153 started the survey (15.7%). N = 7834 subjects completed the survey and were included in the analysis. The RT-18 was also completed as part of this survey. These subjects were deliberately chosen because alcohol and drug use is common among Dutch partygoers. A thorough discussion of the design, methodology, and sample of the ACID survey can be found elsewhere.Citation16
Mean (standard deviation) and distribution of the RT-18 data were computed for all subjects and for men and women separately. Distributions of RT-18 scores were also computed individually for social drinkers (N = 2646) and recreational drug users (N = 4968). Differences were analyzed using ANOVA. Results were taken as significant if P < 0.05 (two-tailed). Internal consistency (reliability) of the RT-18 was measured by Cronbach’s alpha and the Spearman–Brown split-half method. A principal component factor analysis was conducted using data from all subjects who completed the RT-18, applying an orthogonal rotation (Varimax with Kaizer Normalization) to check for interrelation between the items. A confirmatory factor analysis was performed to determine which model best fitted the data.
Examining the construct validity of the RT-18 (Study 3)
Among N = 1000 students, a survey was conducted comprising the RT-18 and the Stimulating-Instrumental Risk Inventory (SIRI).Citation26 The purpose of this survey was to compare the outcome of the RT-18 with the SIRI. The SIRI measures two kinds of risk taking. Instrumental risk taking is a form of controlled risk taking in which the magnitude of potential losses are important and reflective decision making (on long term gains and losses) plays an important role. In contrast, stimulating risk taking comprises uncontrolled impulsive decision making, concentrating on (short term) gains with much less consideration for potential losses. The SIRI consists of 17 items describing different attitudes towards risk. Items can be answered by selecting from “no for sure,” “rather not,” “rather yes,” “yes for sure.”
Statistical analyses were performed with SPSS software. In addition to characteristics of the RT-18 (eg, mean, 95% confidence interval [CI], Cronbach’s alpha), Pearson’s r correlation between the RT-18, its two factors, and SIRI subscale scores were computed. A correlation was regarded as significant if P < 0.05 or better.
Results
Development of the RT-18 (Study 1)
Applying a forward-step regression analysis the 65-item questionnaire could be shortened to 18 items, while maintaining 91% of the predictive validity. Mean score of the RT-18 was 7.69 (95% confidence intervals [CI]: 7.33–8.05), Cronbach’s alpha was 0.89, and the test-retest reliability was r = 0.94 (P < 0.0001). The correlation between the RT-18 scores and the 65-item questionnaire was significant (r = 0.95, P < 0.0001), as were the correlations between the RT-18 and subscales of impulsivity (r = 0.72, P < 0.0001), venturesomeness (r = 0.63, P < 0.0001), novelty seeking (r = 0.85, P < 0.0001), and impulsive sensation seeking (r = 0.85, P < 0.0001).
N = 100 students also performed the CGT. Data of subjects using psychoactive medication or drugs of abuse were omitted (N = 21). Data of N = 79 students revealed significant correlations between the RT-18 score and bet proportion (r = 0.46, P < 0.0001), risk taking (r = 0.45, P < 0.0001), and risk adjustment (r = −0.29, P < 0.01).
Psychometric properties of the RT-18 (Study 2)
Of the online survey, a total of N = 7834 completed surveys were eligible for the statistical analyses. Mean score on the RT-18 was 9.34 (95% CI: 9.26–9.43), Cronbach’s alpha was 0.80, and the Spearman–Brown split-half reliability was 0.81. shows that the data follow a normal distribution. The endorsement of items is summarized in .
Figure 1 Distribution of RT-18 scores of N = 7834 young adults.
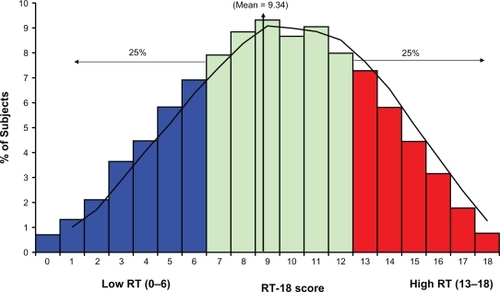
Table 1 RT-18 items, endorsement, and factor loading
Best coverage of total variance (45.7%) is reached by a four-factor model, which resulted in factor 1 (22.6%, 9 items), factor 2 (10.9%, 3 items), factor 3 (6.4%, 4 items), and factor 4 (5.9%, 2 items). Unfortunately, these four factors do not provide a logical framework to explain the data. Therefore, a forced two- and three-factor analysis was conducted. Explained variance of the three models is shown in .
Table 2 Goodness-of-fit indices generated by the confirmatory factor analysis
Confirmatory factor analysis was performed to examine the two-, three-, and four-factor models. Fit indices included the goodness-of-fit index (GFI), the adjusted goodness-of-fit index (AGFI), and the root mean square (RMS) of the standardized residuals. Results are summarized in . Models can be regarded as acceptable if GFI and AGFI values are higher than 0.9, and the RMS is lower than 0.05.Citation27,Citation28 It is evident that the three models fit well with the data.
The two-factor model corresponds best with the theoretical framework of risk-taking behavior. These two factors together explain 33.4% of the total variance. The analysis yields factor 1 (22.5%) labeled “level of risk-taking behavior,” and factor 2 (10.9%) labeled “risk assessment.” Factor 1 and factor 2 correlate significantly (r = 0.312, P < 0.0001). Factor loadings of each item are summarized in . To explore the factor loadings we sorted subjects based on scores on each factor. Using quartile scores, scores were categorized as low, medium, or high. It is possible to distinguish nine groups of subjects that score low, medium, or high on factor 1, factor 2, or both. and summarize risk-taking scores on these nine factor combinations.
Figure 2 Overall RT-18 scores on subgroups that load different on factor 1 and factor 2.
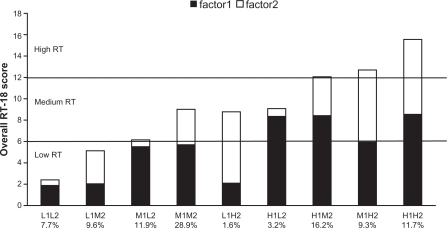
Table 3 RT-18 scores for the nine different factor loading combinations for men, women, and overall
Relationship with CGT performance
In Study 1, subjects performed the CGT. The relationship of performance on this test with the overall RT-18 score and its two factors is summarized in .
Table 4 Relationship between RT-18 scores and performance on the Cambridge Gambling Task
Men vs women
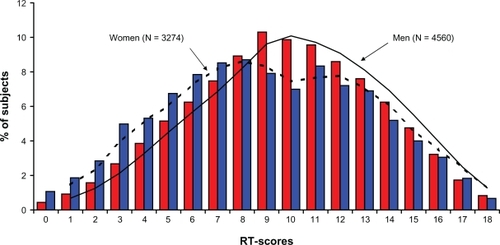
shows the distribution of RT-18 scores of men and women. Men (9.68, 95% CI: 9.57–9.79) score significantly higher (F(1,7833) = 80.31, P < 0.0001) on the RT-18 than women (8.88, 95% CI: 8.74–9.02). Men scored significantly higher on all individual items of the RT-18 (P < 0.0001), apart from items 1, 9, and 12.
Figure 3 Distribution of RT-18 scores of men and women.
Social drinkers vs recreational drug users
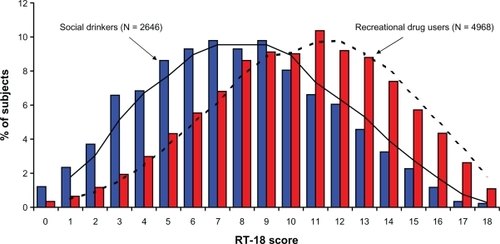
Mean RT-18 scores differed significantly between abstinent subjects, social drinkers, and recreational drug users (F(2, 7822) = 412.87, P < 0.0001). Mean of the RT-18 score for abstinent subjects was 7.11 (95% CI: 6.61–7.61), mean of the RT-18 score for social drinkers was 7.80 (95% CI: 7.66–7.94), and mean of the RT-18 score for recreational drug users was 10.26 (95% CI: 10.15–10.36). shows the distribution of RT-18 scores of social drinkers (N = 2646) compared to those of recreational drug users (N = 4968).
Figure 4 Distribution of RT-18 scores of social drinkers and recreational drug users.
Construct validity of the RT-18 (Study 3)
A total of 903 surveys were eligible for statistical analysis. Mean score on the RT-18 was 6.58 (95% CI: 6.36–6.80), Cronbach’s alpha was 0.74, and the Spearman–Brown split-half reliability was 0.76. For the RT-18, the mean score on Factor 1 (level of risk-taking behavior) was 4.26 (95% CI: 4.10–4.42), and the mean score on Factor 2 (risk assessment) was 2.30 (95% CI: 2.17–2.44). For the SIRI, the mean score on stimulating risk taking was 20.41 (95% CI: 20.11–20.71), and the mean score on instrumental risk taking was 18.11 (95% CI: 17.90–18.31). The RT-18 score correlated significantly with stimulating risk taking (r = 0.60, P < 0.0001) and instrumental risk taking (r = 0.21, P < 0.0001) of the SIRI. Factor 1 of the RT-18 correlates significantly with stimulating risk taking (r = 0.59, P < 0.0001) and instrumental risk taking (r = 0.25, P < 0.0001) of the SIRI. Factor 2 of the RT-18 also correlates significantly with stimulating risk taking (r = 0.36, P < 0.0001), but to a lesser extent with instrumental risk taking (r = 0.08, P < 0.023) of the SIRI.
Discussion
The studies presented in this paper show that the RT-18 is a valid and reliable tool to quickly assess levels of risk-taking behavior. RT-18 scores differentiate clearly between men and women, and between members of groups with known different levels of risk-taking behavior such as social drinkers and recreational drug users. Construct validity of the RT-18 was examined by comparing its outcome with another risk taking questionnaire (Study 3) and performance on the CGT (Study 1). Study 3 showed a significant correlation between scores on the RT-18, its two factors, and the SIRI subscales. Study 1 showed that RT-18 scores also correlate significantly with the risk-taking-related parameters of the CGT. The Cronbach’s alpha and split-half reliability of the RT-18 were shown to be high.
Factor analysis yielded a two-factor model that provides a logical framework to explain the data (variance explained 33.4%). The first factor is described as “level of risk-taking behavior,” while the second includes items best described as “risk assessment.” This distinction of two factors is important, since although people are low or high risk takers, they may vary in the way they have thought about the potential consequences of this behavior (ie, risk assessment). This is evident from and .
Figure 5 Interpretation of scores on the two factors of the RT-18.
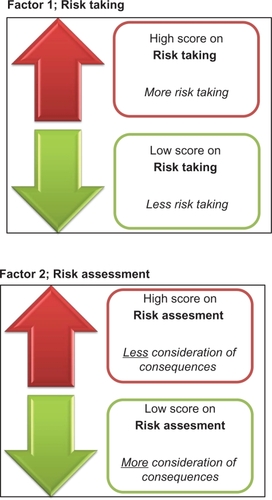
About 30% of subjects score high on factor 1 and can be considered as moderate to high risk takers. About two-thirds of those people (the H1L1 and H1M2 combination) have a moderate overall RT-18 score because they do consider the potential consequences of risk-taking behavior (expressed in a low score on Factor 2). Of special concern are two groups. First, those who score high on Factor 1 (risk taking) and low on Factor 2 (risk assessment) (ie, H1L2). These are high risk takers, although they know the consequences can be adverse, eg, people who know the consequences of driving after alcohol consumption but still decide to drive a car. Second, the group of people that are high risk takers but do not consider the possible negative outcome (H1H2). These are the people who drive after consuming alcohol without considering possible consequences. Although both groups end up driving, the underlying intention is completely different. The distinctions made by the subscales of the RT-18 are crucial for determining the type of intervention that is necessary to prevent these behaviors. The latter is important because often risky behaviors (such as driving while intoxicated) are not only harmful to risk takers, but also to the people surrounding them. H1H2 risk takers need to be educated about the consequences of their behavior, while for H1L2 risk takers it should be examined why these people are willing to take risks despite their knowledge of possible negative outcomes.
The relevance of our findings is clear, as it is shown that the RT-18 is a useful tool to assess risk-taking behavior that correlates with risk taking in an experimental setting (Study 1) and an existing risk-taking scale (Study 3). Although some correlations presented in this article are low, those correlations with RT-18 scores that are of most importance are moderate to high (eg, the correlation between RT-18 scores and risk taking on the CGT, or stimulating risk-taking scores on the SIRI).
Future studies should test the psychometric properties of the RT-18 in patient populations with known high risk-taking levels such as ADHD. In alcohol and drug users it is interesting to relate RT-18 scores to frequency of use, and to determine whether high RT-18 scores are a cause or consequence of frequent alcohol and drug use. Although substance abuse is only one example of risk-taking behavior, it is one that has a major socioeconomic impact on society and our healthcare system.Citation1 Substance users are more likely to become involved in additional other risky behaviors, such as criminality, risky driving, and unsafe sex.Citation29–Citation32 This risky behavior is not only harmful to the individual itself but could potentially harm innocent others. The proposed two-factor model for the RT-18 enables assessment of both the level of risk-taking behavior and risk assessment, and may thus help to identify vulnerable subjects as well as optimizing intervention strategies.
An important advantage of the RT-18 lies in the fact that it is relatively short compared to existing questionnaires. As been pointed out by Allen et al, brief and easy-to-score measures are needed to obtain standardized assessment procedures.Citation33 RT-18 fulfills these requirements and therefore is a helpful new tool to assess risk-taking behavior in this important population.
Acknowledgements
The authors want to thank Professor Cloninger for sending us the English version of the TCI, and Professor Zaleskiewicz for sending us the SIRI. We further thank Chris Alford for checking the draft version of the manuscript and providing helpful comments. The Dutch version of the RT-18 can be obtained upon request from the corresponding author.
Disclosure
The studies described in this paper were supported by internal University funding. The authors report no conflicts of interest in this work.
References
- LopezADMathersCDEzzatiMJamisonDTMurrayCJLGlobal burden of disease and risk factorsWashington DCWorld Bank2006
- BenizovićPMalatestinićDPerceived exposure to substance abuse and risk-taking behavior in early adolescence: cross-sectional studyCroat Med J200950215716419399949
- McNamaraJVervaekeSLWilloughbyTLearning disabilities and risk-taking behavior in adolescents: a comparison of those with and without comorbid attention-deficit/hyperactivity disorderJ Learn Disabil200841656157418931019
- ZuckermanMKuhlmanDMPersonality and risk-taking: common biosocial factorsJ Persy20006869991029
- GalvanAHareTVosHGloverGCaseyBJRisk-taking and the adolescent brain: who is at risk?Dev Sci2007102F8F1417286837
- ShapiroRSiegelAWScovillLCHaysJRisk-taking patterns of female adolescents: what they do and whyJ Adolesc19982121431599585493
- EysenckSGBPearsonPREastingGAllsoppJFAge norms for impulsiveness, venturesomeness and empathy in adultsPers Indiv Differ198565613619
- ZuckermanMKuhlmanDMHornquistMKiersHFive (or three) robust questionnaire scale factors of personality without culturePers Indiv Differ1991129929941
- CloningerCRSvracikDMPrzybeckTRA psychobiological model of temperament and characterArch Gen Psychiatry19935012977991
- ZuckermanMBehavioral expressions and biosocial bases of sensation seekingCambridge, UKCambridge University Press1994
- LlewellynDJThe psychology of risk-taking: toward the integration of psychometric and neuropsychological paradigmsAm J Psychol2008121336337618792715
- AlexanderCSKimYJEnsmingerMJohnsonKESmithBJDolanLJA measure of risk-taking for young adolescents: reliability and validity assessmentsJ Youth Adolesc1990196559569
- LaveryBSiegelAWCousinsJHRubovitsDSAdolescent risk-taking: an analysis of problem behaviors in problem childrenJ Exp Child Psychol19935522772948501428
- GulloneEMooreSMossSBoydCThe adolescent risk-taking questionnaire: development and psychometric evaluationJ Adolescent Res2000152231250
- GulloneEPaulJMooreSMA validation study of the adolescent risk-taking questionnaireBehav Change2000173143154
- VersterJCKuertenYOlivierBvan LaarMWThe ACID-survey: methodology and design of an online survey to assess alcohol and recreational cocaine use and its consequences for traffic safetyThe Open Addict J201032431
- GreeneKKrcmarMWaltersLHRubinDLHaleJLTargeting adolescent risk-taking behaviors: the contributions of egocentrism and sensation-seekingJ Adolesc200023443946110936016
- NewcombMDMcGeeLAdolescent alcohol use and other delinquent behaviors: a one year longitudinal analysis controlling for sensation seekingCrim Justice Behav1989163345369
- ZuckermanMSensation seeking and risky behaviorWashington, DCAmerican Psychological Association2007
- DaltonWT3rdKlesgesLMHendersonLSomesGRobinsonLJohnsonKCGender, smoking status, and risk behavior attitudes explain adolescents’ patterns of nicotine replacement therapy useAddict Behav201035214715119819640
- LijffijtMCaciHKenemansJLValidation of the Dutch translation of the I7 questionnairePers Indiv Differ200538511231133
- DuijsensIJSpinhovenPGoekoopJGSpremonTEurelings-BontekoeEHMThe Dutch temperament and character inventory (TCI): dimensional structure, reliability and validity in a normal and psychiatric outpatient populationPers Indiv Differ2000283487499
- Zuckerman-Kuhlman Personality Questionnaire Available from: www.zkpq.com. Accessed on March 1, 2011.
- Cambridge CognitionCANTAB Core Cognition2011 Available from: http://www.camcog.com/en/science/cantab-core-batteries/cantab-core-cognition. Accessed July 18, 2011
- RogersRDEverittBJBaldacchinoADissociable deficits in the decision-making cognition of chronic amphetamine abusers, opiate abusers, patients with focal damage to prefrontal cortex, and tryptophan-depleted normal volunteers: evidence for monoaminergic mechanismsNeuropsychopharmacology199920432233910088133
- ZaleskiewiczTBeyond risk seeking and risk aversion: personality and the dual nature of economic risk takingEur J Pers200115S1S105S122
- ArbuckleJLAmos users’ guide version 3.6ChicagoSPSS1996
- BrowneMWCudeckRAlternative ways of assessing model fitBollenKALongJSTesting structural equation models1993Newbury Park, CASage1993136162
- BreenRBZuckermanM‘Chasing’ in gambling behavior: personality and cognitive determinantsPers Indiv Differ199927610971111
- BrownRTSystematic review of the impact of adult drug-treatment courtsTransl Res2010155626327420478542
- PenningRVeldstraJDaamenAPOlivierBVersterJCDrugs of abuse, driving and traffic safetyCurr Drug Abuse Rev201031233220088818
- CelentanoDDLatimoreADMehtaSHVariations in sexual risks in drug users: emerging themes in a behavioral contextCurr HIV/AIDS Rep20085421221818838061
- AllenDNDonohueBSuttonGHaderlieMLapotaHApplication of a standardized assessment methodology within the context of an evidence-based treatment for substance abuse and its associated problemsBehav Modif200933561865419864319