
Abstract
Purpose
Early diagnosis of sepsis-induced acute respiratory distress syndrome (ARDS) is critical for effective treatment. We aimed to identify early stage biomarkers.
Materials and Methods
Differentially expressed genes were identified in whole blood samples from patients with sepsis or ARDS based on the Gene Expression Omnibus (GEO) datasets GSE32707, GSE54514 and GSE10361. Functional enrichment analysis explored the biological characteristics of differentially expressed genes. Genes with high functional connectivity based on a protein-protein interaction network were marked as hub genes, which were validated using the GEO dataset GSE76293, and a gene set variation analysis index (GSVA) was assigned. Diagnostic and predictive ability of the hub genes were assessed by receiver operating characteristic (ROC) curve analysis. DNA methylation levels of hub genes were quantified using the GEO dataset GSE67530.
Results
Forty-one differentially expressed genes were shared between sepsis-specific and ARDS-specific datasets. MAP2K2 and IRF7 functional activity was highly connected in sepsis-induced ARDS. Hub genes included RETN, MVP, DEFA4, CTSG, AZU1, FMNL1, RBBP7, POLD4, RIN3, IRF7. ROC curve analysis of the hub gene GSVA index showed good diagnostic ability in sepsis or ARDS. Among genes related to sepsis-induced ARDS, 17 were differentially methylated. Principal component analysis and heatmaps indicated that gene methylation patterns differed significantly between ARDS patients and controls.
Conclusion
We identified a genetic profile specific to early-stage sepsis-induced ARDS. The abnormal expression of these genes may be caused by hypomethylation, which may serve as a biomarker for early diagnosis of ARDS.
Introduction
Acute respiratory distress syndrome (ARDS) is associated with a variety of pathological changes, including the release of inflammatory cytokines, the destruction of pulmonary vascular endothelial cells, the loss of surfactant, the accumulation of lung fluid and the formation of excessive fibrosis.Citation1 Sepsis is a common risk factor for ARDS and patient prognosis is worsened when sepsis is present.Citation2 The 60-day mortality rate of patients with sepsis-related ARDS is significantly higher than that of patients with ARDS unrelated to sepsis. Sepsis-induced ARDS develops rapidly, which limits the time available for doctors to diagnose and treat patients.Citation2 However, few predictive markers of sepsis-induced ARDS are known.
Previous work has addressed sepsis-induced ARDS risk prediction by focusing on the transcriptome and clinical indicators.Citation3,Citation4 Although some biomarkers have been confirmed, most have been correlated with prognosis rather than early diagnosis. A previous study demonstrated that Interferon (INF) response factors IRF7 signaling regulated pulmonary inflammatory response through the TLR4 signaling pathway.Citation5 Activating transcription factor 4 (ATF4) regulates genes involved in the inflammatory response.Citation6 AUZ1 in the inflammatory process is known to facilitate leukocyte-mediated migration, and neutrophil activation and degranulation process.Citation7 In contrast, tissue factor was identified as not only a diagnostic biomarker of sepsis-induced ARDS, but also a prognostic indicator of ARDS.Citation2 Another study elucidated the diagnostic role of 11 biomarkers in ARDS, but did not distinguish between the biomarkers of traumatic or non-traumatic ARDS.Citation8
Epigenetic changes, especially DNA methylation, are critical regulators of gene transcription, and therefore influence the occurrence and development of diseases.Citation9 Changes in DNA methylation have been implicated in many diseases, including lung cancer and airway inflammation.Citation10,Citation11 DNA methylation can directly block transcription by inhibiting the binding of specific transcription factors to target sequences in genes.Citation12–Citation14 For example, sepsis-induced ARDS in animal models can be induced using lipopolysaccharide, which alters DNA methylation to up-regulate the expression of certain inflammatory factors.Citation15 Lipopolysaccharide induces methylation not only of tumor necrosis factor-alpha promoter in human THP-1 monocytes, but also of sequences in the HIC-1 gene in mouse embryonic fibroblasts lacking p53.Citation16 In human intestinal epithelial cells, lipopolysaccharide stimulates the methylation of regions in the IL-8 promoter with which the histone residues H3K4, H3K9 and H3K27 interact.Citation17 Since sepsis-induced ARDS is closely related to the level of lipopolysaccharide in the blood stream, aberrant DNA methylation in lung cells could be considered as a prophase event in sepsis-induced ARDS. However, the methylation profile of genes associated with ARDS or sepsis has not been fully studied. One study showed that epigenetic variation of myosin light chain kinase is involved in the pathogenesis of ARDS and might influence risk of mortality among patients.Citation18 However, that study focused only on a single genetic variation, which may not be diagnostic for all patients.
In this in silico study, we comprehensively analyzed differences in gene expression and methylation among patients with sepsis alone, patients with sepsis-related ARDS and healthy controls. The results may be helpful for the early diagnosis of ARDS and the development of sepsis treatment strategies.
Materials and Methods
Data Preparation
We extracted information from datasets downloaded from the Gene Expression Omnibus (GEO, https://www.ncbi.nlm.nih.gov/geo/). The GSE32707 gene expression profiles,Citation19 obtained using the GPL10558 platform, contained 144 human blood samples, including 58 from patients with sepsis, 31 from patients with sepsis+ARDS, 21 from patients with systemic inflammatory response syndrome and 34 healthy controls. All patients were undergoing mechanical ventilation. The 21 systemic inflammatory response syndrome samples were excluded from our analysis. The GSE10361 gene expression profile data, obtained using the GPL96 platform, comprised 9 human blood samples, including 6 from patients with ARDS and 3 from healthy controls. Among them, 6 samples were collected at 0 h, and 3 at 72 h. The GSE54514 gene expression profile data, obtained with the GPL6947 platform, included 163 human blood samples from up to 5 days for sepsis survivors (n=26), sepsis nonsurvivors (n=9), and healthy controls (n=18). Among them, 127 were from patients with sepsis on day_1, day_2, day_3, day_4 and day_5, as well as 36 were from healthy controls on day_1 and day_5. The above three data sets were used to identify hub genes.
The GSE76293 gene expression profile data,Citation20 obtained using the platform GPL6883, contained samples of alveolar lavage fluid or blood neutrophils from 12 patients with ARDS and samples of blood neutrophils from 82 healthy controls. All patients in this dataset received ventilation therapy. And the study was split in to 2 parts. PartA: PMN were isolated from ARDS patients alongside PMN from paired (ie, age and gender-matched) HVTs. PartB: PMNs from HVTs cultured with GM-CSF and PI3K Inhibitors. This data set was used to validate the aberrant expression of hub genes. The GSE67530 DNA methylation data, based on the GPL13534 platform, came from blood samples from 39 patients with ARDS, 75 non-ARDS ICU controls, and 30 healthy controls.
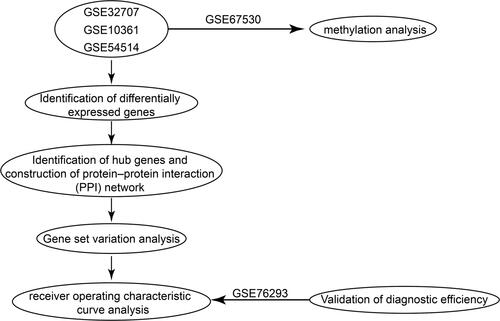
The normalizeBetweenArrays function in the limma packageCitation21 was applied to normalize all the gene expression profiles. If a gene was detected using multiple probes, the average expression value for all probes was used as the expression value for the gene. All the analyses were performed using R software version 3.5.3. (https://www.r-project.org/). The workflow of the present study is shown in .
Figure 1 The workflow of the present study.
Differentially Expressed Gene Analysis (DEG)
The limma package in R was used to screen GSE32707, GSE10361 and GSE54514 datasets to identify genes differentially expressed among sepsis, ARDS and control samples. The fold change (FC) in the expression of individual genes was calculated, and genes with |log2FC| > 1 and P < 0.05 were considered significant. In the GSE32707A dataset, genes related to sepsis-induced ARDS were defined as DEGs that were common to ARDS and sepsis samples (when compared to control), and for which |log2FCARDS vs control| > |log2FCsepsis vs control|Citation22 The DEGs related to sepsis-induced ARDS that were common to the GSE10361 and GSE54514 datasets were extracted for subsequent analysis.
Identification of Differentially Methylated Genes
In dataset GSE67530, the mean β values of all CpG islands corresponding to a gene were used to indicate the degree of methylation of that gene.Citation23 Differentially methylated genes were identified between ARDS and healthy control samples using the limma package. P < 0.05 was considered significant.
Gene Set Variation Analysis (GSVA) and Receiver Operating Characteristic (ROC) Curve Analysis
GSVA,Citation24 as implemented in the GSVA package in R, was used to score individual samples against the DEGs related to sepsis-induced ARDS, and each sample received an up-regulated and a down-regulated GSVA score. Samples in the GSE32707, GSE10361 and GSE54514 datasets were scored in this way. The GSVA results were also displayed as a heatmap, and their diagnostic value was assessed using ROC curve analysis with the pROC software package in R.Citation25
Functional Enrichment Analysis
To explore the biological function of the shared up-regulated and down-regulated genes in the three gene sets, Gene Ontology (GO) and Kyoto Encyclopedia of Genes and Genomes (KEGG) pathway enrichment analyses were performed using the clusterProfiler packageCitation26 in R. P value < 0.05 after adjusting for the false discovery rate was considered significant.
Protein–Protein Interaction (PPI) Network and Identification of Hub Genes
Using the STRING database (https://string-db.org/),Citation27 we constructed a PPI network of the shared up-regulated and down-regulated genes from the three gene sets, which was visualized using Cytoscape software.Citation28 The KEGG pathways in which these genes were involved, based on functional enrichment analysis, were also displayed in this network. In the PPI network, according to the semantic similarities of GO terms used for gene annotation, we ranked the gene inside the interactome by the average functional similarities between the gene and its interaction partners. Genes with a higher mean functional similarity were considered more crucial.Citation29 In addition, we calculated the Pi value = logFC×log (P value) in the three comparisons for the genes based on previous work.Citation30 Thus, the weight (W) value was defined as W = mean functional similarity × mean Pi. The W value was used to rank the top 10 genes, which were considered as hub genes. The hub GSVA score was calculated and ROC curve analysis performed as described above.
Results
Identification of DEGs Involved in Sepsis-Induced ARDS
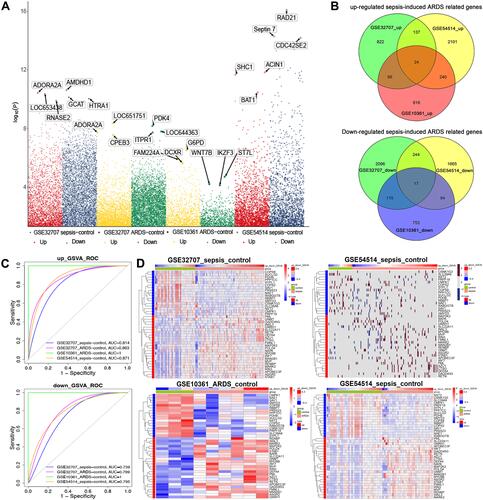
In the GSE32707 dataset, 8354 DEGs were obtained between sepsis samples and healthy control samples, and 7859 were obtained between ARDS samples and control samples. A total of 1049 up-regulated genes and 2472 down-regulated genes were shared between sepsis and ARDS samples and were therefore potentially related to sepsis-induced ARDS. In the GSE10361 dataset, there were 1146 up-regulated genes and 969 down-regulated genes in the ARDS samples. In the GSE54514 dataset, there were 2502 up-regulated genes and 2010 down-regulated genes in sepsis samples (). The genes potentially related to sepsis-induced ARDS were cross-referenced against the ARDS-related genes and sepsis-related genes, and the overlapping set of 24 up-regulated and 17 down-regulated genes () were defined as being related to sepsis-induced ARDS and analyzed further.
Figure 2 Differentially expressed genes in sepsis-induced ARDS. (A) Manhattan plot of differentially expressed genes. (B) Venn diagram identifying sepsis-specific genes and ARDS-specific genes in different datasets. Up- or down-regulated genes in GSE32707, GSE10361 and GSE54514 datasets were considered potentially related to sepsis-induced ARDS. (C) Receiver operating characteristic (ROC) curve analysis of potential gene markers based on gene set variation analysis (GSVA) scores. (D) Heatmaps depicting the expression of sepsis-induced ARDS related genes and the corresponding GSVA scores.
Validation of GSVA Scores for Genes Related to Sepsis-Induced ARDS
ROC curve analysis was performed using the GSVA scores calculated separately for the up-regulated genes related to sepsis-induced ARDS and for the down-regulated genes related to sepsis-induced ARDS. Both GSVA scores showed good potential for diagnosing sepsis and ARDS across multiple datasets (). A heatmap was used to correlate the expression of genes related to sepsis-induced ARDS and the two GSVA scores ().
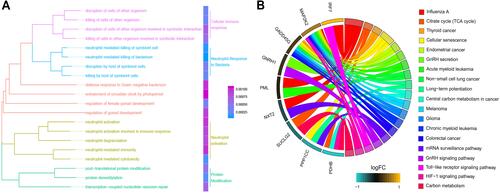
Biological Processes and Pathways Involved in Sepsis-Induced ARDS
GO analysis of genes related to sepsis-induced ARDS identified 20 biological processes that were significantly enriched, including cellular immune response, neutrophil response to bacteria, neutrophil activation and protein modification (). KEGG pathway enrichment analysis showed a total of 19 pathways, such as the citrate cycle, cellular senescence, toll-like receptor (TLR) signaling and HIF-1 signaling ().
Figure 3 Functional enrichment analysis for the sepsis-induced ARDS related genes. (A) The 20 most significant biological processes identified by gene set enrichment analysis. (B) KEGG analysis showed pathways associated with sepsis-induced ARDS.
Potential Molecular Mechanism of Hub Genes Driving Development of Sepsis-Induced ARDS
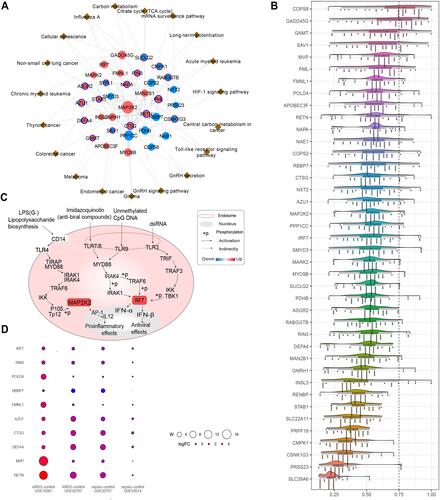
The 41 genes related to sepsis-induced ARDS were introduced into a PPI network using the STRING database (). We found a high degree of connectivity between MAP2K2 and IRF7, which may suggest a bridge role in sepsis-induced ARDS (). During sepsis, lipopolysaccharide activates immune cells by making direct contact with toll-like receptor (TLR)-4. Consequently, a large signaling complex is formed around TLR-4, containing the signal adapter MyD88 and members of the IRAK family that lead to an inflammatory response.Citation31,Citation32 Most proteins associated with the TLR signaling pathway are positively regulated during inflammation. MyD88 can mediate the development of lung inflammation induced by mechanical ventilation in mice.Citation33 IRAK1 is related to the prognosis of sepsis patients. Up-regulating MAP2K2 and IRF7 may ultimately promote the release of inflammatory factors and activate interferon signaling. Similarity analysis was used to screen for hub genes (). Genes with similar functions were identified as hub genes, including RETN, MVP, DEFA4, CTSG, AZU1, FMNL1, RBBP7, POLD4, RIN3, IRF7. Next we evaluated the biological functions and expression of the identified hub genes in sepsis and ARDS ().
Figure 4 Protein-protein interaction network associated with hub genes. (A) Protein-protein interaction network of genes related to sepsis-induced ARDS. Red nodes represent up-regulated genes and blue nodes represent down-regulated genes. The red outer ring represents hypermethylation, and the blue outer ring represents hypomethylation. Brown triangles represent the pathway involved by genes (B) The potential mechanism of regulatory network pathways affecting genes related to sepsis-induced ARDS. Red squares represent up-regulated genes. (C) Average functional similarity among the 41 shared up-regulated and down-regulated genes related to sepsis-induced ARDS. (D) Bubble heat map of hub genes. W = mean functional similarity × mean Pi. W represents the bubble size, and the logFc value is represented by different colors.
Diagnostic Potential of the GSVA Score for the Set of Hub Genes
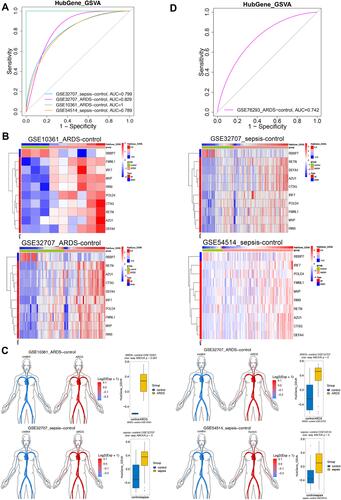
ROC curve analysis of the hub gene GSVA score showed good diagnostic ability in sepsis or ARDS (). The expression of hub genes in ARDS or sepsis samples is shown in heatmaps and disease development ( and ). Validation in an independent data set (GSE76293) confirmed that the hub gene GSVA score had biomarker potential, with an area under the ROC curve of 0.742 ().
Figure 5 Expression of hub genes in sepsis-induced ARDS and their ability to predict the condition. (A) Receiver operating characteristic (ROC) curves showing the diagnostic potential of gene set variation analysis (GSVA) scores for different sets of hub genes. (B) Heatmap depicting hub gene expression and GSVA scores. (C) The hub gene GSVA score was higher in patients with sepsis or ARDS than in controls. (D) ROC curve analysis of hub gene GSVA in dataset GSE76293.
Differential Methylation Alters Hub Gene Expression in Sepsis-Induced ARDS
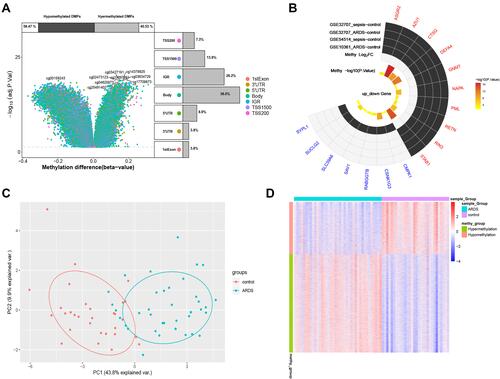
A total of 12,557 differentially methylated genes were identified in the GSE67530 set (). Among the 41 genes related to sepsis-induced ARDS, 17 were differentially methylated. Ten genes showed high expression and low methylation: ASGR2, AZU1, CTSG, DEFA4, GNMT, NAPA, PML, RETN, RIN3, and STAB1. The remaining seven genes showed low expression and high methylation: CMPK1, CSNK1G3, RABGGTB, SAV1, SLC39A6, SUCLG2, SYPL1 (). Gene methylation differed significantly between ARDS and control samples, based on principal component analysis () and a heatmap ().
Figure 6 Differential methylation of hub genes. (A) Volcano plot of top differentially methylated genes in relation to the gene. Percentages of hyper- and hypomethylated genes are displayed on top, while the proportions of different genomic features are shown on the right. (B) The 17 differentially methylated genes related to sepsis-induced ARDS. Red represents up-regulated genes, and blue represents down-regulated genes. (C) Principal component analysis using the 17 differentially methylated genes. (D) Heatmap showing methylation levels of the 17 differentially methylated genes.
Discussion
Sepsis-induced ARDS is severe and develops rapidly. Although the prognosis of patients with this condition has improved, major treatments have not emerged, in part due to the lack of early diagnostic biomarkers. Therefore, we compared gene expression profiles in patients with sepsis or ARDS in order to understand transcriptional disturbance in sepsis-induced ARDS. We discovered hub genes in sepsis-induced ARDS and uncovered different methylation patterns that may regulate hub gene expression, which may help drive the disease.
The majority of the previous studies mainly focused on the prognosis of ARDS, and few people made further exploration on the early diagnosis of ARDS. We found that in patients with sepsis-induced ARDS, differentially expressed genes were mainly involved in the TCA cycle, cellular senescence, Toll-like receptor signaling pathway and HIF-1 signaling pathway. Studies had confirmed that these pathways were closely related to sepsis and play a key role in the development of sepsis. In particular, toll-like receptor signaling pathway played an important role in the development of sepsis and ARDS. The related research by Huang et alCitation34 confirmed that anti-TLR 4 mAb could reduce lung injury in mechanical ventilation, inflammation and edema by inhibiting the TLR 4/MyD 88 signaling pathway in rats. Our results also confirmed the above point.
PPI networks were used to unearth functionally related hub genes from three datasets in sepsis-induced ARDS, and these genes were validated using an independent dataset. The hub genes hold great potential as biomarkers as their related proteins are highly expressed in the blood of ARDS patients. Indeed, we confirmed these hub genes show diagnostic potential for sepsis-induced ARDS.
DNA methylation plays an important role in regulating gene transcription.Citation9 For example, hypermethylation of CpG islands leads to gene silencing and disease, which is why demethylation drugs can be effective.Citation35,Citation36 Indeed, altered DNA methylation in the lungs has often been connected to tumorigenesis and airway inflammation.Citation10,Citation11 However, variation in the methylation of only one gene has so far been linked to ARDS.Citation37,Citation38 Our study showed that highly expressed hub genes showed low methylation levels suggestive of hypomethylation. Hypomethylation of the transcriptional start site and first exon of AZU1 triggers inflammation signaling cascades in multiple autoimmune diseases.Citation39 Inflammation may lead to hypomethylation and subsequent up-regulation of DEFA4.Citation40 These findings lead us to propose that hypomethylation-induced up-regulation of hub genes contributes to the development of sepsis-induced ARDS. Regrettably, IRF7 was upregulated and highly affecting the toll like receptor signaling pathway. However, IRF7 was not differentially methylated.
Our results should be interpreted with caution in light of several limitations. First, this study was a retrospective analysis of incomplete public datasets. Since we do not know the patient’s infection level, treatment methods, or additional clinically relevant data, we cannot rule out that these factors may have confounded our analysis. Second, our study analyzed only three datasets for gene expression, one dataset for methylation, and one dataset for validation. Our results should be verified and extended with larger samples. Future work should also extend our bioinformatics analyses in the laboratory with tissue samples and cell cultures.
Despite these limitations, we have identified key genes showing aberrant expression in sepsis-induced ARDS, which may be due in part to hypomethylation. These genes may be useful as biomarkers for early diagnosis of ARDS and for identifying septic patients at greater risk of developing ARDS.
Acknowledgments
This study was supported by the National Natural Science Foundation of China (81960343), the Guangxi Natural Science Foundation (2017GXNSFAA198249), the Scientific Research Fund of the Population and Family Planning Commission of Guangxi Zhuang Autonomous Region (S2017009) and the High-level Medical Expert Training Program of Guangxi “139” Plan Fund (G201903027).
Disclosure
The authors report no conflicts of interest in this work.
References
- Metwaly S, Cote A, Donnelly SJ, Banoei MM, Mourad AI, Winston BW. Evolution of ARDS biomarkers: will metabolomics be the answer? Am J Physiol Lung Cell Mol Physiol. 2018;315(4):L526–L534. doi:10.1152/ajplung.00074.2018
- Xue M, Sun Z, Shao M, et al. Diagnostic and prognostic utility of tissue factor for severe sepsis and sepsis-induced acute lung injury. J Transl Med. 2015;13:172. doi:10.1186/s12967-015-0518-9
- Ware LB, Koyama T, Billheimer DD, et al. Prognostic and pathogenetic value of combining clinical and biochemical indices in patients with acute lung injury. Chest. 2010;137(2):288–296. doi:10.1378/chest.09-1484
- Barnett N, Ware LB. Biomarkers in acute lung injury–marking forward progress. Crit Care Clin. 2011;27(3):661–683. doi:10.1016/j.ccc.2011.04.001
- Li Y, Wang C, Wu X, et al. IRF3 and IRF7 contribute to diesel exhaust particles-induced pulmonary inflammation by mediating mTORC1 activation and restraining autophagy in mice. Eur J Immunol. 2020;50(8):1142–1153. doi:10.1002/eji.201948415
- Hu X, Deng J, Yu T, et al. ATF4 deficiency promotes intestinal inflammation in mice by reducing uptake of glutamine and expression of antimicrobial peptides. Gastroenterology. 2019;156(4):1098–1111. doi:10.1053/j.gastro.2018.11.033
- Banerjee A, Shukla S, Pandey AD, et al. RNA-Seq analysis of peripheral blood mononuclear cells reveals unique transcriptional signatures associated with disease progression in dengue patients. Transl Res. 2017;186:62–78 e9. doi:10.1016/j.trsl.2017.06.007
- Ware LB, Koyama T, Zhao Z, et al. Biomarkers of lung epithelial injury and inflammation distinguish severe sepsis patients with acute respiratory distress syndrome. Crit Care. 2013;17(5):R253. doi:10.1186/cc13080
- El Gazzar M, Yoza BK, Hu JY, Cousart SL, McCall CE. Epigenetic silencing of tumor necrosis factor alpha during endotoxin tolerance. J Biol Chem. 2007;282(37):26857–26864. doi:10.1074/jbc.M704584200
- Vogel Ciernia A, LaSalle J. The landscape of DNA methylation amid a perfect storm of autism aetiologies. Nat Rev Neurosci. 2016;17(7):411–423. doi:10.1038/nrn.2016.41
- Koch A, Joosten SC, Feng Z, et al. Author correction: analysis of DNA methylation in cancer: location revisited. Nat Rev Clin Oncol. 2018;15(7):467. doi:10.1038/s41571-018-0028-9
- Long H, Yin H, Wang L, Gershwin ME, Lu Q. The critical role of epigenetics in systemic lupus erythematosus and autoimmunity. J Autoimmun. 2016;74:118–138. doi:10.1016/j.jaut.2016.06.020
- Bansal A, Pinney SE. DNA methylation and its role in the pathogenesis of diabetes. Pediatr Diabetes. 2017;18(3):167–177. doi:10.1111/pedi.12521
- Yang IV, Lozupone CA, Schwartz DA. The environment, epigenome, and asthma. J Allergy Clin Immunol. 2017;140(1):14–23. doi:10.1016/j.jaci.2017.05.011
- Wang HM, Bodenstein M, Markstaller K. Overview of the pathology of three widely used animal models of acute lung injury. Eur Surg Res. 2008;40(4):305–316. doi:10.1159/000121471
- Tatemichi M, Hata H, Tazawa H, Nakadate T. Lipopolysaccharide induces aberrant hypermethylation of Hic-1 in mouse embryonic fibroblasts lacking p53 gene. Anticancer Res. 2008;28(4B):2101–2108.
- Angrisano T, Pero R, Peluso S, et al. LPS-induced IL-8 activation in human intestinal epithelial cells is accompanied by specific histone H3 acetylation and methylation changes. BMC Microbiol. 2010;10:172. doi:10.1186/1471-2180-10-172
- Szilagyi KL, Liu C, Zhang X, et al. Epigenetic contribution of the myosin light chain kinase gene to the risk for acute respiratory distress syndrome. Transl Res. 2017;180:12–21. doi:10.1016/j.trsl.2016.07.020
- Dolinay T, Kim YS, Howrylak J, et al. Inflammasome-regulated cytokines are critical mediators of acute lung injury. Am J Respir Crit Care Med. 2012;185(11):1225–1234. doi:10.1164/rccm.201201-0003OC
- Juss JK, House D, Amour A, et al. Acute respiratory distress syndrome neutrophils have a distinct phenotype and are resistant to phosphoinositide 3-kinase inhibition. Am J Respir Crit Care Med. 2016;194(8):961–973. doi:10.1164/rccm.201509-1818OC
- Ritchie ME, Phipson B, Wu D, et al. limma powers differential expression analyses for RNA-sequencing and microarray studies. Nucleic Acids Res. 2015;43(7):e47. doi:10.1093/nar/gkv007
- Zhang J, Luo Y, Wang X, et al. Global transcriptional regulation of STAT3- and MYC-mediated sepsis-induced ARDS. Ther Adv Respir Dis. 2019;13:1753466619879840. doi:10.1177/1753466619879840
- Gevaert O. MethylMix: an R package for identifying DNA methylation-driven genes. Bioinformatics. 2015;31(11):1839–1841. doi:10.1093/bioinformatics/btv020
- Hanzelmann S, Castelo R, Guinney J. GSVA: gene set variation analysis for microarray and RNA-seq data. BMC Bioinform. 2013;14:7. doi:10.1186/1471-2105-14-7
- Robin X, Turck N, Hainard A, et al. pROC: an open-source package for R and S+ to analyze and compare ROC curves. BMC Bioinform. 2011;12:77. doi:10.1186/1471-2105-12-77
- Yu G, Wang LG, Han Y, He QY. clusterProfiler: an R package for comparing biological themes among gene clusters. OMICS. 2012;16(5):284–287. doi:10.1089/omi.2011.0118
- Szklarczyk D, Morris JH, Cook H, et al. The STRING database in 2017: quality-controlled protein-protein association networks, made broadly accessible. Nucleic Acids Res. 2017;45(D1):D362–D368. doi:10.1093/nar/gkw937
- Shannon P, Markiel A, Ozier O, et al. Cytoscape: a software environment for integrated models of biomolecular interaction networks. Genome Res. 2003;13(11):2498–2504. doi:10.1101/gr.1239303
- Han Y, Yu G, Sarioglu H, et al. Proteomic investigation of the interactome of FMNL1 in hematopoietic cells unveils a role in calcium-dependent membrane plasticity. J Proteomics. 2013;78:72–82. doi:10.1016/j.jprot.2012.11.015
- Zou C, Wang J, Huang X, Jian C, Zou D, Li X. Analysis of transcription factor- and ncRNA-mediated potential pathogenic gene modules in Alzheimer’s disease. Aging (Albany NY). 2019;11(16):6109–6119. doi:10.18632/aging.102169
- Takeuchi O, Akira S. Pattern recognition receptors and inflammation. Cell. 2010;140(6):805–820. doi:10.1016/j.cell.2010.01.022
- Kovach MA, Standiford TJ. Toll like receptors in diseases of the lung. Int Immunopharmacol. 2011;11(10):1399–1406. doi:10.1016/j.intimp.2011.05.013
- Zhou S, Wang G, Zhang W. Effect of TLR4/MyD88 signaling pathway on sepsis-associated acute respiratory distress syndrome in rats, via regulation of macrophage activation and inflammatory response. Exp Ther Med. 2018;15(4):3376–3384. doi:10.3892/etm.2018.5815
- Huang C, Pan L, Lin F, Dai H, Fu R. Monoclonal antibody against Toll-like receptor 4 attenuates ventilator-induced lung injury in rats by inhibiting MyD88- and NF-kappaB-dependent signaling. Int J Mol Med. 2017;39(3):693–700. doi:10.3892/ijmm.2017.2873
- Kantarjian H, Issa JP, Rosenfeld CS, et al. Decitabine improves patient outcomes in myelodysplastic syndromes: results of a phase III randomized study. Cancer. 2006;106(8):1794–1803. doi:10.1002/cncr.21792
- Issa JJ, Roboz G, Rizzieri D, et al. Safety and tolerability of guadecitabine (SGI-110) in patients with myelodysplastic syndrome and acute myeloid leukaemia: a multicentre, randomised, dose-escalation phase 1 study. Lancet Oncol. 2015;16(9):1099–1110. doi:10.1016/S1470-2045(15)00038-8
- Huang X, Kong G, Li Y, et al. Decitabine and 5-azacitidine both alleviate LPS induced ARDS through anti-inflammatory/antioxidant activity and protection of glycocalyx and inhibition of MAPK pathways in mice. Biomed Pharmacother. 2016;84:447–453. doi:10.1016/j.biopha.2016.09.072
- Lei C, Jiao Y, He B, Wang G, Wang Q, Wang J. RIP140 down-regulation alleviates acute lung injury via the inhibition of LPS-induced PPARgamma promoter methylation. Pulm Pharmacol Ther. 2016;37:57–64. doi:10.1016/j.pupt.2016.02.001
- Wang X, Lei D, Ding J, et al. A DNA-methylated sight on autoimmune inflammation network across RA, pSS, and SLE. J Immunol Res. 2018;2018:4390789. doi:10.1155/2018/4390789
- Francis M, Pandya M, Gopinathan G, et al. Histone methylation mechanisms modulate the inflammatory response of periodontal ligament progenitors. Stem Cells Dev. 2019;28(15):1015–1025. doi:10.1089/scd.2019.0125