
Abstract
Purpose
This study aimed to identify genes that may be effective in diagnosing or treating diabetic retinopathy (DR), the most common complication of diabetes mellitus (DM).
Methods
Differentially expressed genes (DEGs) were identified between DR and DM in GSE146615 dataset. DEGs that were consistently up- or down-regulated under both standard glucose and high glucose conditions were identified as common genes and used to generate a protein–protein interaction network and modules. The module genes were assessed for the area under the receiver operating characteristic curve (AUC), leading to the identification of hub genes. Differentially methylated probes in GSE76169 were also compared with common DEGs to identify specific methylation markers of DR. Enrichment analysis was used to explore the biological characteristics. The Short Time-series Expression Miner algorithm was used to identify genes that were progressively dysregulated in the sequence: healthy controls < DM < DR.
Results
A total of 1917 common genes were identified for seven modules. The eight genes with AUC > 0.8 under high glucose and standard glucose conditions were considered as hub genes. The module genes were significantly enriched during vascular smooth muscle cell development and regulation of oxygen metabolism, while 92 methylation markers were involved in the similar terms. Among the progressively dysregulated genes, three intersection genes under both standard glucose and high glucose conditions were found to be module genes and were considered as key genes.
Conclusion
We identified eight potential DR-specific diagnostic and therapeutic genes, whose abnormal expression can cause oxidative stress, thus favoring the course of the disease.
Introduction
Diabetes mellitus (DM) affects an increasing number of people worldwide.Citation1 The global incidence of DM is estimated to be 415 million adults and is expected to be nearly 700 million by 2045.Citation2,Citation3 The course of DM is closely related to the development and progression of diabetic retinopathy (DR),Citation4 which is one of the most common complications of DM and which can reduce visual acuity and even lead to blindness.Citation5,Citation6 Almost all patients with type 1 diabetes mellitus (T1DM) and more than 60% with type 2 diabetes mellitus (T2DM) have some degree of retinopathy after 20 years with DM.Citation7 The estimated global prevalence of DR is 382 million,Citation8 imposing a heavy financial burden on healthcare systems.Citation9,Citation10
The retina is the most active metabolic tissue and consumes a large amount of energy and oxygen.Citation11 Inadequate oxygen and nutrient supply to the retina may impair the oxygen balance in cells, resulting in a hypoxic retinal environment.Citation12 During the development of DM, high blood glucose reduces the oxygen levels in the retina,Citation13 while chronic hyperglycemia alters the function of vascular smooth muscle cells, thus promoting DR.Citation14 A typical manifestation of DR is gradual change in retinal microvasculature, which in turn leads to retinal ischemia, neovascularization, changes in retinal permeability, and macular edema.Citation15 Despite the existing knowledge about the pathology and manifestation of DR, no prophylactic treatment has been reported for the early stages of the disease.Citation16
DR can be clinically divided into non-proliferative diabetic retinopathy (NPDR), which is characterized by microvascular damage, and proliferative diabetic retinopathy (PDR), where new blood vessels are formed.Citation17 NPDR can also develop into PDR, resulting in irreversible vision loss and complete blindness.Citation18 Current treatments for DR include laser surgery and anti-vascular endothelial growth factor (VEGF) therapy, which can control the growth of abnormal blood vessels but cannot prevent blindness.Citation19 Gene therapy can also be used as a restorative or neuroprotective approach depending on when it is applied during the disease and what genes it targets.Citation20 DNA methylation in DM patients has also been associated with the pathogenesis of DR, suggesting that methylated sites can serve as predictive or diagnostic biomarkers of DR.Citation21
Here, we used the GSE146615 dataset to identify potential diagnostic markers and therapeutic targets in DR, as well as to begin to clarify molecular dysregulation in the disease. In addition, we used the GSE76169 dataset to explore potential associations between methylation mechanisms and DR. In GSE76169 dataset, all T1DM cases received conventional treatment in the Diabetes Control and Complications Trial (DCCT)Citation22 and developed retinopathy at the 10th year after the end of the EDIC. In contrast, controls were in the DCCT intensive treatment group and did not develop retinopathy during the EDIC study. Identifying early features of DR is particularly important for inhibiting pathology and preventing visual impairment. Therefore, we expect that understanding the underlying pathogenic mechanisms of DR will contribute to the development of novel therapeutic approaches.
Materials and Methods
Data Processing
The DR gene data were collected from the Gene Expression Omnibus database (http://www.ncbi.nlm.nih.gov/geo). The GSE146615 dataset included gene expression profiles of lymphoblastoid cell lines derived from healthy controls (NoD) and matched T1DM individuals with retinopathy (DwC) and without retinopathy (DwoC). The cells were cultured under standard glucose (SG) (21 NoD, 26 DwC, and 25 DwoC) and high glucose (HG) conditions (21 NoD, 26 DwC, and 25 DwoC), and all samples were analyzed on Illumina HT12v4 microarrays (ThermoFisher).
The raw data were background-subtracted and normalized using the lumiR package.Citation23 The GSE76169 dataset included the whole-blood DNA methylation profiles from 32 DR cases and 31 controls collected at the beginning of the Epidemiology of Diabetes Interventions and Complications (EDIC) study.Citation24
DNA methylation samples were measured on the Illumina HumanMethylation450 BeadChip array, and the Bioconductor package ChAMP was used to generate the normalized beta values.Citation25 All data in the present study were obtained from an open-access database and no ethical approval was required.
Differential Analysis
The limma package inRCitation26 was used for the differential analysis between DR and DM patients or between DM patients and controls in the GSE146615 dataset under HG or SG conditions. Genes with P value < 0.05 of t test were considered statistically significant and were indicated as differentially expressed genes (DEGs). In contrast, common genes were defined as genes whose expression in DR differed in the same direction relative to DM under both HG and SG conditions. The limma algorithm was also applied to the GSE76169 dataset to obtain the differentially methylated CpG sites with P < 0.05.
Network Construction
The Search Tool for Retrieval of Interacting Genes/Proteins (STRING; http://string-db.org) is an online database for analyzing functional networks between two or more proteins. Here, the protein–protein interaction (PPI) network was constructed by analyzing common genes with STRING based on the criterion of a combined score >500. The network was displayed using Cytoscape software. Significant modules in the PPI network were identified by the molecular complex detection (MCODE) plugin in CytoscapeCitation27 with degree cutoff = 2, node score cutoff = 0.2, K-Core = 5, and max. depth = 100.
Enrichment Analysis
Annotation of signaling pathways and functions for module genes were performed using the Database for Annotation, Visualization and Integrated Discovery (DAVID, http://david.ncifcrf.gov). Genes were also analyzed for enrichment of Gene Ontology (GO) processes and Kyoto Encyclopedia of Genes and Genomes (KEGG) pathways pathways using the clusterProfiler package in R.Citation28 The same package was also used within a Java environment to obtain the background set for gene set enrichment analysis (GSEA) between DR and DM.Citation29 The fast preranked gene set enrichment analysis (fgsea) package inRCitation30 was used to further analyze the GSEA results. Differences with P value < 0.05 were considered statistically significant. Gene set variation analysis (GSVA) was carried out using the GSVA packageCitation31 to explore the activation or inhibition of biological processes and KEGG pathways in DR relative to DM.
Short Time-Series Expression Miner Analysis
Short Time-series Expression Miner (STEM) softwareCitation32 was used to cluster module genes of the GSE146615 dataset in healthy, DwoC, and DwC samples under SG and HG conditions. A P value < 0.05 was considered as statistically significant clustering. The expression of the significantly clustered genes was progressively up- or down-regulated in the sequence: healthy < DwoC < DwC. The area under the receiver operating characteristic curve (AUC) was also calculated to evaluate the diagnostic value of the hub genes using the pROC package.Citation33
Single-Sample GSEA
The marker gene sets defining different immune cell types were obtained from a previous study.Citation34 Differences in infiltration levels by immune cells between DR and DM was calculated using the single-sample gene set enrichment analysis (ssGSEA) function in the GSVA package and was expressed as a ssGSEA score. A P value < 0.05 was considered statistically significant.
Results
Identification of DEGs Between DR and DM
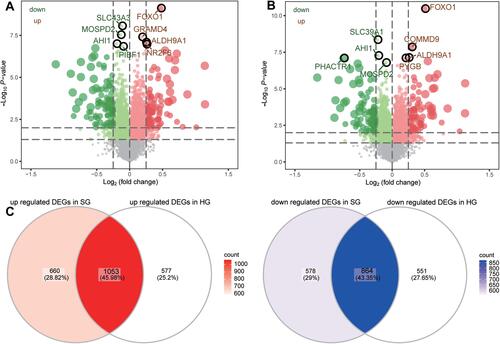
In order to identify specific genes associated with DR, differential analysis of gene expression between DR and DM in GSE146615 was first performed (), resulting in 3155 DEGs under HG conditions (, Table S1) and 3045 DEGs under SG conditions (, Table S2). The intersection of DEGs were attributed to the progression of DR and indicated that 1053 common genes were upregulated and 864 were downregulated under the two glucose conditions ().
Figure 1 Study flowchart. The GSE146615 dataset was used to identify potential diagnostic biomarkers and therapeutic targets of diabetic retinopathy (DR), as well as molecular mechanisms of the disease. Alterations in methylation of DR-related genes were also screened to identify methylated markers.
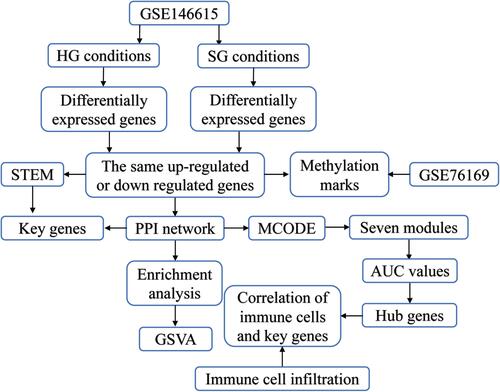
Figure 2 The differentially expressed genes in DR compared to DM. Differentially expressed genes between diabetic retinopathy (DR) and diabetes mellitus (DM) under (A) high glucose (HG) conditions and (B) standard glucose (SG) conditions. Red indicates upregulated genes and green indicates downregulated genes. The top eight genes with the largest fold change are listed. (C) A total of 1053 differentially expressed genes that were upregulated under both HG and SG conditions were detected, as well as 864 genes that were downregulated under the two glucose conditions. These DEGs were defined as “common genes”.
PPI Network
The protein interactions among the identified common genes were predicted using the STRING database. In particular, the 1917 common genes were searched in the STRING (http://string-db.org) and screening for interaction scores >500 yielded a network of 6775 reciprocal pairs of PPIs. In addition, Cytoscape software was used to identify the interaction relationship of the PPI network genes, and the MCODE plugin recognized 279 module genes (). Further calculation of their AUC values under HG and SG conditions indicated that the following eight genes had AUC > 0.8: FOXO1, ALDH9A1, TSC1, AHI1, CMKLR1, EXOSC7, INTS6, and MDFIC. These eight genes were identified as hub genes (). The differential expression of these genes between DR and DM was similar under SG conditions () and HG conditions (Figure S1).
Figure 3 Construction of the protein–protein interaction (PPI) network and identification of hub genes. (A) PPI network of eight modules. Differently colored nodes represent different modules. (B) AUC values of the eight module genes under high glucose (HG) and standard glucose (SG) conditions (left). Mean AUC for genes with AUC > 0.8 under HG and SG conditions (right). Red and blue nodes represent, respectively, genes upregulated or downregulated in diabetic retinopathy (DR) relative to diabetes mellitus (DM). (C) Differential expression profiles of hub genes between DR and DM under SG conditions. ***P < 0.05. (D) Differences in immune cell infiltration between DR and DM under SG conditions. Each row represents a type of immune cell. Blue lines represent significant downregulation in DR. (E) Correlation between hub genes and infiltrating immune cells based on Pearson correlation analysis under SG conditions. Red blocks represent positive correlations; blue, negative correlations. *P < 0.05, **P < 0.01.
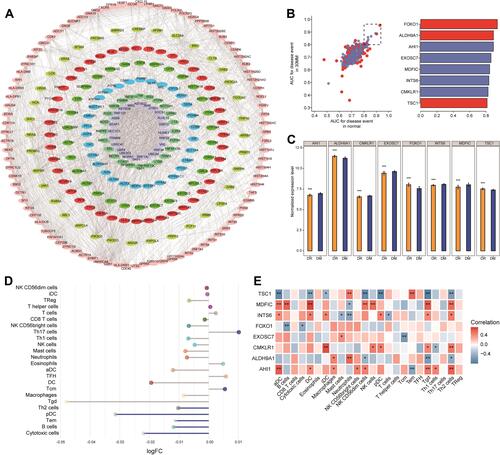
The infiltration by immune cells in DR and DM was also quantified, revealing differences between the two conditions. Th2 and B cells were significantly downregulated in DR compared to DM under both SG () and HG (Figure S2) conditions. Correlation analysis also showed that infiltration by Th2 cells correlated positively with AHI1 expression and negatively with TSC1 expression under both glucose conditions ( and Figure S3). The infiltration by B cells correlated positively with MDFIC expression and negatively with FOXO1 expression.
Enrichment Analysis of Module Genes
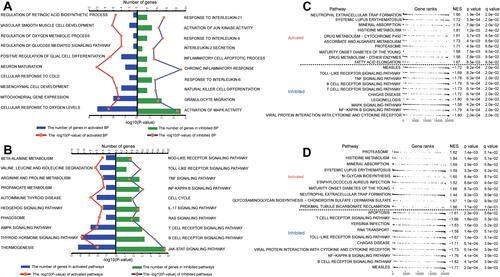
The module genes were studied by enrichment analysis to identify the molecular mechanisms of DR. There were 414 terms in the DAVID analysis results, included 5′‐adenosine monophosphate‐activated protein kinase (AMPK) signaling pathway, cell cycle, and tumor necrosis factor (TNF) signaling pathway (Table S3). In the enrichment results, the activation or inhibition of biological processes and KEGG terms in DR relative to DM was examined under SG conditions using the GSVA package. Specifically, vascular smooth muscle cell development, regulation of retinoic acid biosynthetic process, and regulation of oxygen metabolism were activated in DR and significantly enriched in module genes (). In contrast, the activation of c-Jun N-terminal (JUN) kinase, mitogen‑activated protein kinase (MAPK), and chronic inflammatory response were inhibited in DR. The KEGG pathways of valine, leucine, and isoleucine degradation, AMPK signaling, and β-alanine metabolism were also activated in DR and significantly enriched in module genes (), whereas the cell cycle and signaling pathways of Toll-like receptor (TLR) and TNF were inhibited. Furthermore, GSEA indicated the activation of histidine metabolism, maturity-onset diabetes of the young, and neutrophil extracellular trap formation under SG () and HG () conditions in DR. GSEA also indicated inhibition of the T-cell receptor, TLR, and NFκB signaling pathways in DR.
Figure 4 Module genes involved in biological processes and Kyoto Encyclopedia of Genes and Genomes (KEGG) pathways. (A and B) Numbers of module genes in diabetic retinopathy compared to healthy controls involved in activation or inhibition of (A) biological processes and (B) KEGG pathways, as determined by GSVA. Longer columns indicate the involvement of more genes under the given term. (C and D) Module genes involved in activation or inhibition of KEGG pathways in diabetic retinopathy compared to healthy controls under (C) standard glucose or (D) high glucose conditions, as determined by GSEA. Differences with P < 0.05 were considered statistically significant.
Methylation of Common Genes
The methylation profiles of DR cases and controls in the GSE76169 dataset were studied by differential analysis to determine if the expression of common genes might be regulated by methylation. Genes were considered to be methylation markers regulated by methylation when their expression differed (under SG conditions) in the opposite direction to methylation differed in DR patients compared controls. A total of 2992 differentially methylated probes (DMPs) were identified () and after comparing them with common genes, we found 92 methylation markers that may be involved in the progression of DR ().
Figure 5 Identification of methylation markers for common genes. (A) Differentially methylated positions between diabetic retinopathy and diabetes mellitus. Among them, 71.19% were hypermethylated and 28.81% were hypomethylated. Different colors represent different methylation sites. Labels indicate the 10 sites with the highest methylation levels. (B) Methylation and expression levels of methylation markers. The labels indicate the important genes. (C) Biological functions and (D) KEGG pathways significantly enriched by methylation markers. Thicker lines represent greater correlation between the terms and methylated markers.
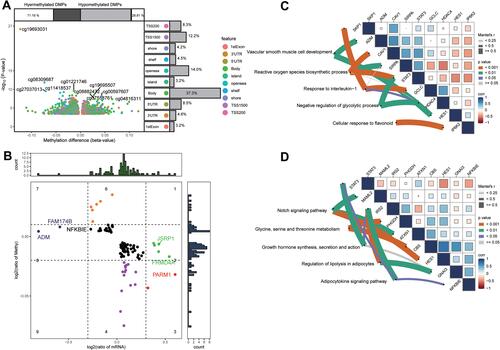
Enrichment analysis revealed that these methylation markers were significantly involved in biological processes, such as “vascular smooth muscle cell development”, “reactive oxygen species biosynthetic process” (), In KEGG results, we identified significantly enriched “Notch signaling pathway”, “Glycine”, “serine and threonine metabolism” ().
Potential Genes Involved in DR Progression
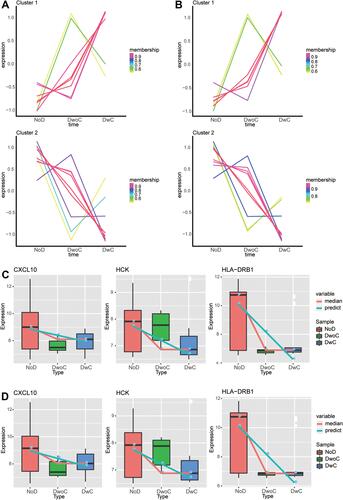
Through STEM analysis, we identified the genes whose persistent expression changes during the progression from healthy controls to DM patients and then to DR patients, under both HG and SG conditions. A total of 18 and 17 common genes showed progressively up- or down-regulated expression under SG and HG conditions, respectively, and the groups of genes fell into two clusters ( and ). Among the two groups of progressively dysregulated genes, three intersection genes were found to be module genes of the PPI network (CXCL10, HCK, and HLA-DRB1), and were therefore considered as key genes. The expression of key genes was progressively downregulated from healthy controls to DM patients and then to DR patients, under both SG () and HG () conditions.
Figure 6 Identification of progressively dysregulated genes during the development of diabetic retinopathy. (A and B) Progressively dysregulated genes under (A) standard glucose (SG) and (B) high glucose (HG) conditions were identified by STEM analysis in the trend: healthy controls < diabetes mellitus < diabetic retinopathy. The genes were then clustered into a progressively upregulated cluster (Cluster 1) and a progressively downregulated cluster (Cluster 2). (C and D) Expression of CXCL10, HCK, and HLA-DRB1 genes among healthy controls, diabetic retinopathy, and diabetes mellitus under (C) SG and (D) HG conditions.
Discussion
The identification of effective biomarkers for DR is particularly important, as such biomarkers may contribute to the early diagnosis and treatment of the disease.Citation15 Although biomarkers with therapeutic potential are commonly used in medicine and especially in oncology,Citation35,Citation36 none has been reported for DR. In the present study, we investigated potential diagnostic and therapeutic biomarkers of DR by comparing gene expression changes in DR and DM cell lines under SG and HG conditions.
Screening of genes with different expression in the same direction under SG and HG conditions revealed that several genes may play a key role in DR diagnosis. In contrast to DM, FOXO1, ALDH9A1, and TSC1 are upregulated in DR, thus promoting the disease. Specifically, the upregulated expression of FOXO1 causes IL-1β-induced autostimulation,Citation37 and its upregulation in endothelial cells significantly contributes to the development of DR.Citation38 In addition, FOXO1 acts downstream of insulin-dependent signaling pathways, which are dysregulated in DM.Citation39 TSC1 is another important gene that contributes to the development of diabetic complications, including DR, by targeting the mechanistic target of rapamycin (mTOR) pathway.Citation40,Citation41 Among the genes downregulated in DR, AHI1 encodes a cilia-localized protein, and its absence promotes retinal degeneration.Citation42 CMKLR1 is activated by the Wnt/β-catenin pathway, which is involved in extracellular matrix accumulation and renal fibrosis in DR.Citation43,Citation44 However, the pathogenic role of CMKLR1 in retinal microvascular function has not been evaluated in vivo or in vitro. EXOSC7 has been reported to be differentially expressed between T1DM and healthy controls,Citation45 but no study has been found showing its altered expression in DR. INTS6 is a glucocorticoid response gene, and glucocorticoids have gluconeogenesis promoting effects on the liver.Citation46 Levels of INTS6 are significantly upregulated after intermittent fasting in patients with metabolic syndrome.Citation47 The glucocorticoid receptor binds to MDFIC, and directly inhibits its expression.Citation48 And MDFIC was significantly downregulated in retinopathy compared with the control.Citation49 Although it is clear that the up- and down-regulation of hub genes plays a significant role in the DR process, their specific roles in the disease remain to be elucidated. In addition, the hub genes may affect the immune response of DR, according to our correlation results between immune cell infiltration and gene expression.
Here, we first performed enrichment analysis of module genes within the PPI network and identified potential biological functions and signaling pathways that may be involved in the pathophysiology of DR. Oxidative metabolic processes are strongly activated in DR cells, as hypoxia in the retina can induce neuronal degeneration.Citation50 Alterations in the excitability of vascular smooth muscle cells play a key role in the development and progression of vascular complications in DM.Citation51,Citation52 Animal studies have shown that hyperglycemia can cause vascular dysfunction in DR,Citation53 while inflammation has also been indicated as a key factor in the development of DR.Citation54 However, here, we found that chronic inflammation is suppressed during DR, suggesting that the inflammatory response of in vitro cultured DR cells may not play a major pathological role in the disease development.
Enrichment analysis of KEGG terms showed that the AMPK signaling pathway is activated in DR. This pathway mediates the stress response, promotes autophagy, and stabilizes hypoxia-inducible factor 1α (HIF-1α), thus enhancing VEGF expression.Citation55 VEGF hypersecretion then leads to irregular retinal vasculature, resulting in edema, hemorrhage, and eventually retinal detachment.Citation56,Citation57 However, we found that inflammatory signaling pathways, such as those involving TLR and TNF, are suppressed in DR, which is inconsistent with previous studies that suggested that HG levels enhance the expression of TLR, NFκB, and TNF-α, thereby exacerbating DR.Citation58 Our results suggest that DR cells cultured in vitro may be more prone to activate oxidative stress-related signals, while suppressing inflammation-related responses. This may be related to the reduced immune cell content in DwC compared to DwoC of GSE146615 dataset.
STEM analysis showed that the expression of CXCL10, a known biomarker for DR,Citation59 as well as expression of HCK and HLA-DRB1 was progressively downregulated from healthy controls to DM patients and then to DR patients. This suggests that the three genes may be involved in the progression of DR in patients with DM. These results are inconsistent with recent studies, where CXCL10 expression was upregulated from DM to DR.Citation5 This may be related to the suppression of inflammatory response in DR in our results. Platelet-derived vesicles seem to regulate hyperglycemia-induced retinal endothelial damage by releasing CXCL10, which can then activate the TLR4 pathway.Citation60 HCK belongs to the Src family kinase involved in regulating endothelial cell proliferation, migration, and angiogenesis,Citation61 and it is differentially expressed between DM and normal subjects, as well as between healthy controls and patients with diabetic peripheral neuropathy.Citation62,Citation63 However, its role in DR progression has not yet been elucidated. HLA-DRB1, for its part, is a vision-related gene that is differentially expressed in proliferative DR lesions,Citation64 while its polymorphisms are known risk factors for DM and its complications.Citation65,Citation66 Based on these earlier findings and our knowledge of DR pathophysiology, we suggest that CXCL10, HCK, and HLA-DRB1 play an important role in the development and progression of the disease.
Differential analysis of the methylation profiles of DR cases and controls in the GSE76169 dataset identified altered DNA methylation of DR-related genes. Consistent with our results, transcription of genes related to redox balance is known to be regulated by cytosine methylation status in DNA. This methylation is involved in retinal development and responds dynamically to environmental changes.Citation67 Indeed, the restoration of proper DNA methylation can restore mitochondrial homeostasis, maintain cellular redox balance, and inhibit or delay DR progression.Citation68 In the KEGG pathways of methylation markers enriched, the balance of Notch signaling controls the formation and degeneration of retinal vessels.Citation9 H2O2 caused a decrease in the concentration of glycine in retina, which is involved in the process of DR.Citation69 Hyperglycemia induced activation of serine/threonine kinase family proteins is one of the factors involved in microvascular alterations in DM that can lead to DR.Citation70
Our results should be interpreted with caution. The small sample in our study means that our findings should be verified and extended in larger studies. Moreover, our findings were not validated through molecular or clinical experiments, which will be performed in subsequent studies to confirm the efficacy of the identified genes as novel diagnostic biomarkers or therapeutic targets in DR. In addition, although T1DM and T2DM overlap in some clinical and pathological features, their molecular mechanisms and genetic basis are different. We only selected T1DM individuals to do the analysis, whether these results are applicable in T2DM needs further study.
Conclusion
Our study on differentially expressed genes between DR and DM showed that oxidative stress may be an important pathological mechanism in DR cells cultured in vitro. A total of eight genes were identified that could be used as valuable biomarkers for DR, while CXCL10, HCK, and HLA-DRB1 could serve as biomarkers of DR severity.
Abbreviations
AMPK, monophosphate‐activated protein kinase; AUC, area under the receiver operating characteristic curve; DAVID, Database for Annotation, Visualization and Integrated Discovery; DCCT, Diabetes Control and Complications Trial; DEGs, differentially expressed genes; DM, diabetes mellitus; DMPs, differentially methylated probes; DR, diabetic retinopathy; DwC, type 1 diabetes individuals with retinopathy; DwoC, type 1 diabetes individuals without retinopathy; EDIC, Epidemiology of Diabetes Interventions and Complications; fgsea, fast preranked gene set enrichment analysis; GO, Gene Ontology; GSEA, gene set enrichment analysis; GSVA, Gene set variation analysis; HG, high glucose; HIF-1α, hypoxia-inducible factor 1α; JUN, c-Jun N-terminal kinase; KEGG, Kyoto Encyclopedia of Genes and Genomes; MAPK, mitogen‑activated protein kinase; MCODE, molecular complex detection; NoD, healthy controls; NPDR, non-proliferative DR; PDR, proliferative DR; PPI, protein–protein interaction; SG, standard glucose; ssGSEA, single-sample gene set enrichment analysis; STEM, Short Time-series Expression Miner; STRING, the Search Tool for Retrieval of Interacting Genes/Proteins; TLR, Toll-like receptor; TNF, tumor necrosis factor; VEGF, vascular endothelial growth factor.
Data Sharing Statement
Data were downloaded from the Gene Expression Omnibus (GEO) database (https://www.ncbi.nlm.nih.gov/geo/).
Disclosure
The authors report no conflicts of interest related to this work.
Additional information
Funding
References
- Ndjaboue R, Farhat I, Ferlatte CA, et al. Predictive models of diabetes complications: protocol for a scoping review. Syst Rev. 2020;9(1):137. doi:10.1186/s13643-020-01391-w
- Ogurtsova K, da Rocha Fernandes JD, Huang Y, et al. IDF Diabetes Atlas: global estimates for the prevalence of diabetes for 2015 and 2040. Diabetes Res Clin Pract. 2017;128:40–50. doi:10.1016/j.diabres.2017.03.024
- Cho NH, Shaw JE, Karuranga S, et al. IDF Diabetes Atlas: global estimates of diabetes prevalence for 2017 and projections for 2045. Diabetes Res Clin Pract. 2018;138:271–281. doi:10.1016/j.diabres.2018.02.023
- Santiago AR, Boia R, Aires ID, Ambrosio AF, Fernandes R. Sweet stress: coping with vascular dysfunction in diabetic retinopathy. Front Physiol. 2018;9:820. doi:10.3389/fphys.2018.00820
- Altmann C, Schmidt MHH. The role of microglia in diabetic retinopathy: inflammation, microvasculature defects and neurodegeneration. Int J Mol Sci. 2018;19(1). doi:10.3390/ijms19010110
- Rossino MG, Dal Monte M, Casini G. Relationships between neurodegeneration and vascular damage in diabetic retinopathy. Front Neurosci. 2019;13:1172. doi:10.3389/fnins.2019.01172
- Fong DS, Aiello L, Gardner TW, et al. Retinopathy in diabetes. Diabetes Care. 2004;27(Suppl 1):S84–87. doi:10.2337/diacare.27.2007.S84
- Yau JW, Rogers SL, Kawasaki R, et al. Global prevalence and major risk factors of diabetic retinopathy. Diabetes Care. 2012;35(3):556–564. doi:10.2337/dc11-1909
- Simo R, Stitt AW, Gardner TW. Neurodegeneration in diabetic retinopathy: does it really matter? Diabetologia. 2018;61(9):1902–1912. doi:10.1007/s00125-018-4692-1
- Schmier JK, Covert DW, Lau EC, Matthews GP. Medicare expenditures associated with diabetes and diabetic retinopathy. Retina. 2009;29(2):199–206. doi:10.1097/IAE.0b013e3181884f2d
- Colin J, Le Gall G, Le Jeune B, Cambrai MD. The prevalence of exfoliation syndrome in different areas of France. Acta Ophthalmol Suppl. 1988;184:86–89. doi:10.1111/j.1755-3768.1988.tb02634.x
- Caprara C, Grimm C. From oxygen to erythropoietin: relevance of hypoxia for retinal development, health and disease. Prog Retin Eye Res. 2012;31(1):89–119.
- Antonetti DA, Klein R, Gardner TW. Diabetic retinopathy. N Engl J Med. 2012;366(13):1227–1239. doi:10.1056/NEJMra1005073
- Kowluru RA. Diabetic retinopathy, metabolic memory and epigenetic modifications. Vision Res. 2017;139:30–38. doi:10.1016/j.visres.2017.02.011
- Jenkins AJ, Joglekar MV, Hardikar AA, Keech AC, O’Neal DN, Januszewski AS. Biomarkers in Diabetic Retinopathy. Rev Diabet Stud. 2015;12(1–2):159–195. doi:10.1900/RDS.2015.12.159
- Potilinski MC, Lorenc V, Perisset S, Gallo JE. Mechanisms behind retinal ganglion cell loss in diabetes and therapeutic approach. Int J Mol Sci. 2020;21(7). doi:10.3390/ijms21072351
- Stitt AW, Lois N, Medina RJ, Adamson P, Curtis TM. Advances in our understanding of diabetic retinopathy. Clin Sci (Lond). 2013;125(1):1–17. doi:10.1042/CS20120588
- Das A, Stroud S, Mehta A, Rangasamy S. New treatments for diabetic retinopathy. Diabetes Obes Metab. 2015;17(3):219–230. doi:10.1111/dom.12384
- Frank RN. Diabetic retinopathy. N Engl J Med. 2004;350(1):48–58. doi:10.1056/NEJMra021678
- Pardue MT, Allen RS. Neuroprotective strategies for retinal disease. Prog Retin Eye Res. 2018;65:50–76.
- Agardh E, Lundstig A, Perfilyev A, et al. Genome-wide analysis of DNA methylation in subjects with type 1 diabetes identifies epigenetic modifications associated with proliferative diabetic retinopathy. BMC Med. 2015;13:182. doi:10.1186/s12916-015-0421-5
- The Diabetes Control and Complications (DCCT) Research Group. Effect of intensive therapy on the development and progression of diabetic nephropathy in the Diabetes Control and Complications Trial. Kidney Int. 1995;47(6):1703–1720. doi:10.1038/ki.1995.236
- Du P, Kibbe WA, Lin SM. lumi: a pipeline for processing Illumina microarray. Bioinformatics. 2008;24(13):1547–1548. doi:10.1093/bioinformatics/btn224
- Nathan DM, Bayless M, Cleary P, et al. Diabetes control and complications trial/epidemiology of diabetes interventions and complications study at 30 years: advances and contributions. Diabetes. 2013;62(12):3976–3986. doi:10.2337/db13-1093
- Tian Y, Morris TJ, Webster AP, et al. ChAMP: updated methylation analysis pipeline for Illumina BeadChips. Bioinformatics. 2017;33(24):3982–3984. doi:10.1093/bioinformatics/btx513
- Ritchie ME, Phipson B, Wu D, et al. limma powers differential expression analyses for RNA-sequencing and microarray studies. Nucleic Acids Res. 2015;43(7):e47. doi:10.1093/nar/gkv007
- Bandettini WP, Kellman P, Mancini C, et al. MultiContrast Delayed Enhancement (MCODE) improves detection of subendocardial myocardial infarction by late gadolinium enhancement cardiovascular magnetic resonance: a clinical validation study. J Cardiovasc Magn Reson. 2012;14:83. doi:10.1186/1532-429X-14-83
- Yu G, Wang LG, Han Y, He QY. clusterProfiler: an R package for comparing biological themes among gene clusters. OMICS. 2012;16(5):284–287. doi:10.1089/omi.2011.0118
- Subramanian A, Tamayo P, Mootha VK, et al. Gene set enrichment analysis: a knowledge-based approach for interpreting genome-wide expression profiles. Proc Natl Acad Sci U S A. 2005;102(43):15545–15550. doi:10.1073/pnas.0506580102
- Sergushichev AAJB. An algorithm for fast preranked gene set enrichment analysis using cumulative statistic calculation. bioRxiv. 2016;060012.
- Hanzelmann S, Castelo R, Guinney J. GSVA: gene set variation analysis for microarray and RNA-seq data. BMC Bioinform. 2013;14:7. doi:10.1186/1471-2105-14-7
- Ernst J, Bar-Joseph Z. STEM: a tool for the analysis of short time series gene expression data. BMC Bioinform. 2006;7:191. doi:10.1186/1471-2105-7-191
- Robin X, Turck N, Hainard A, et al. pROC: an open-source package for R and S+ to analyze and compare ROC curves. BMC Bioinform. 2011;12:77. doi:10.1186/1471-2105-12-77
- Bindea G, Mlecnik B, Tosolini M, et al. Spatiotemporal dynamics of intratumoral immune cells reveal the immune landscape in human cancer. Immunity. 2013;39(4):782–795. doi:10.1016/j.immuni.2013.10.003
- Jayson GC, Zhou C, Backen A, et al. Plasma Tie2 is a tumor vascular response biomarker for VEGF inhibitors in metastatic colorectal cancer. Nat Commun. 2018;9(1):4672. doi:10.1038/s41467-018-07174-1
- Constancio V, Nunes SP, Henrique R, Jeronimo C. DNA methylation-based testing in liquid biopsies as detection and prognostic biomarkers for the four major cancer types. Cells. 2020;9(3). doi:10.3390/cells9030624
- Wu L, Guo F, Wu Y, et al. The role of FoxO1 in interleukin-1beta-induced autostimulation in retina endothelial cells and retinas of diabetic rats. Microvasc Res. 2017;112:93–100. doi:10.1016/j.mvr.2017.03.003
- Shan S, Chatterjee A, Qiu Y, Hammes HP, Wieland T, Feng Y. O-GlcNAcylation of FoxO1 mediates nucleoside diphosphate kinase B deficiency induced endothelial damage. Sci Rep. 2018;8(1):10581. doi:10.1038/s41598-018-28892-y
- Nakae J, Oki M, Cao Y. The FoxO transcription factors and metabolic regulation. FEBS Lett. 2008;582(1):54–67. doi:10.1016/j.febslet.2007.11.025
- Inoki K. Role of TSC-mTOR pathway in diabetic nephropathy. Diabetes Res Clin Pract. 2008;82(Suppl 1):S59–62. doi:10.1016/j.diabres.2008.09.028
- Prado MSG, de Jesus ML, de Goes TC, Mendonca LSO, Kaneto CM. Downregulation of circulating miR-320a and target gene prediction in patients with diabetic retinopathy. BMC Res Notes. 2020;13(1):155. doi:10.1186/s13104-020-05001-9
- Louie CM, Caridi G, Lopes VS, et al. AHI1 is required for photoreceptor outer segment development and is a modifier for retinal degeneration in nephronophthisis. Nat Genet. 2010;42(2):175–180. doi:10.1038/ng.519
- Muruganandan S, Govindarajan R, McMullen NM, Sinal CJ. Chemokine-like receptor 1 is a novel wnt target gene that regulates mesenchymal stem cell differentiation. Stem Cells. 2017;35(3):711–724. doi:10.1002/stem.2520
- Gu P, Wang W, Yao Y, et al. Increased circulating chemerin in relation to chronic microvascular complications in patients with Type 2 diabetes. Int J Endocrinol. 2019;2019:8693516. doi:10.1155/2019/8693516
- Li C, Wei B, Zhao J. Competing endogenous RNA network analysis explores the key lncRNAs, miRNAs, and mRNAs in type 1 diabetes. BMC Med Genomics. 2021;14(1):35. doi:10.1186/s12920-021-00877-3
- Brenner LN, Mercader JM, Robertson CC, et al. Analysis of glucocorticoid-related genes reveal CCHCR1 as a new candidate gene for Type 2 diabetes. J Endocr Soc. 2020;4(11):bvaa121. doi:10.1210/jendso/bvaa121
- Mindikoglu AL, Abdulsada MM, Jain A, et al. Intermittent fasting from dawn to sunset for four consecutive weeks induces anticancer serum proteome response and improves metabolic syndrome. Sci Rep. 2020;10(1):18341. doi:10.1038/s41598-020-73767-w
- Oakley RH, Busillo JM, Cidlowski JA. Cross-talk between the glucocorticoid receptor and MyoD family inhibitor domain-containing protein provides a new mechanism for generating tissue-specific responses to glucocorticoids. J Biol Chem. 2017;292(14):5825–5844. doi:10.1074/jbc.M116.758888
- Su T, Gu C, Draga D, et al. Integrative analysis of miRNA-mRNA network in high altitude retinopathy by bioinformatics analysis. Biosci Rep. 2021;41(1). doi:10.1042/BSR20200776.
- Cecilia OM, Jose Alberto CG, Jose NP, et al. Oxidative stress as the main target in diabetic retinopathy pathophysiology. J Diabetes Res. 2019;2019:8562408. doi:10.1155/2019/8562408
- Nieves-Cintron M, Syed AU, Nystoriak MA, Navedo MF. Regulation of voltage-gated potassium channels in vascular smooth muscle during hypertension and metabolic disorders. Microcirculation. 2018;25(1). doi:10.1111/micc.12423
- Martin-Aragon Baudel M, Espinosa-Tanguma R, Nieves-Cintron M, Navedo MF. Purinergic signaling during hyperglycemia in vascular smooth muscle cells. Front Endocrinol (Lausanne). 2020;11:329. doi:10.3389/fendo.2020.00329
- Liu Z, Khalil RA. Evolving mechanisms of vascular smooth muscle contraction highlight key targets in vascular disease. Biochem Pharmacol. 2018;153:91–122.
- Rubsam A, Parikh S, Fort PE. Role of inflammation in diabetic retinopathy. Int J Mol Sci. 2018;19(4). doi:10.3390/ijms19040942
- Li Y, Sun R, Zou J, Ying Y, Luo Z. Dual roles of the AMP-Activated protein kinase pathway in angiogenesis. Cells. 2019;8(7).
- Joussen AM, Poulaki V, Qin W, et al. Retinal vascular endothelial growth factor induces intercellular adhesion molecule-1 and endothelial nitric oxide synthase expression and initiates early diabetic retinal leukocyte adhesion in vivo. Am J Pathol. 2002;160(2):501–509. doi:10.1016/S0002-9440(10)64869-9
- Cachafeiro M, Bemelmans AP, Samardzija M, et al. Hyperactivation of retina by light in mice leads to photoreceptor cell death mediated by VEGF and retinal pigment epithelium permeability. Cell Death Dis. 2013;4:e781. doi:10.1038/cddis.2013.303
- Zhao M, Li CH, Liu YL. Toll-like receptor (TLR)-2/4 expression in retinal ganglion cells in a high-glucose environment and its implications. Genet Mol Res. 2016;15(2).
- Kastelan S, Oreskovic I, Biscan F, Kastelan H, Gverovic Antunica A. Inflammatory and angiogenic biomarkers in diabetic retinopathy. Biochem Med (Zagreb). 2020;30(3):030502. doi:10.11613/BM.2020.030502
- Martins B, Amorim M, Reis F, Ambrosio AF, Fernandes R. Extracellular vesicles and MicroRNA: putative role in diagnosis and treatment of diabetic retinopathy. Antioxidants (Basel). 2020;9(8). doi:10.3390/antiox9080705
- Li P, Chen D, Cui Y, et al. Src plays an important role in AGE-Induced endothelial cell proliferation, migration, and tubulogenesis. Front Physiol. 2018;9:765. doi:10.3389/fphys.2018.00765
- Yeh SH, Chang WC, Chuang H, Huang HC, Liu RT, Yang KD. Differentiation of type 2 diabetes mellitus with different complications by proteomic analysis of plasma low abundance proteins. J Diabetes Metab Disord. 2015;15:24. doi:10.1186/s40200-016-0246-6
- Jian L, Yang G. Identification of key genes involved in diabetic peripheral neuropathy progression and associated with pancreatic cancer. Diabetes Metab Syndr Obes. 2020;13:463–476. doi:10.2147/DMSO.S235011
- Li J, Lu Q, Lu P. Quantitative proteomics analysis of vitreous body from type 2 diabetic patients with proliferative diabetic retinopathy. BMC Ophthalmol. 2018;18(1):151. doi:10.1186/s12886-018-0821-3
- Howson JM, Roy MS, Zeitels L, Stevens H, Todd JA. HLA class II gene associations in African American type 1 diabetes reveal a protective HLA-DRB1*03 haplotype. Diabet Med. 2013;30(6):710–716. doi:10.1111/dme.12148
- Lipner EM, Tomer Y, Noble JA, et al. HLA class I and II alleles are associated with microvascular complications of type 1 diabetes. Hum Immunol. 2013;74(5):538–544. doi:10.1016/j.humimm.2013.01.013
- Wang L, Hiler D, Xu B, et al. Retinal Cell Type DNA Methylation and histone modifications predict reprogramming efficiency and retinogenesis in 3D organoid cultures. Cell Rep. 2018;22(10):2601–2614. doi:10.1016/j.celrep.2018.01.075
- Kang Q, Yang C. Oxidative stress and diabetic retinopathy: molecular mechanisms, pathogenetic role and therapeutic implications. Redox Biol. 2020;37:101799.
- Lopez-Contreras AK, Martinez-Ruiz MG, Olvera-Montano C, et al. Importance of the use of oxidative stress biomarkers and inflammatory profile in aqueous and vitreous humor in diabetic retinopathy. Antioxidants (Basel). 2020;9(9). doi:10.3390/antiox9090891.
- Barrett EJ, Liu Z, Khamaisi M, et al. Diabetic microvascular disease: an endocrine society scientific statement. J Clin Endocrinol Metab. 2017;102(12):4343–4410.