
Abstract
Purpose
Osteosarcoma is the most common malignant bone cancer affecting adolescents and young adults. This study aimed to screen potential diagnostic and therapeutic markers for osteosarcoma.
Methods
Differential expression analysis between osteosarcoma and control was performed in GSE99671, the differentially expressed genes (DEGs) were subjected to co-expression analysis. Enrichment analysis was employed to identify the biological functions and KEGG signaling pathways of module genes. In addition, a differential analysis was also performed between recurrent and non-recurrent osteosarcoma samples in GSE39055, and enrichment analysis was performed for DEGs. Further, Kaplan–Meier curve analysis was performed on the module genes, and receiver operating characteristic (ROC) curve was drawn. Comparison of the module with the highest correlation to osteosarcoma identified key genes. Cox regression model was utilized to identify the predictive ability of key genes for the prognosis of osteosarcoma.
Results
A total of 13 co-expression modules were identified from 4871 DEGs of GSE99671, module 1 had the highest positive correlation with osteosarcoma. Module genes were mainly enriched in autophagy and macrophage migration functions. A total of 1126 DEGs were obtained from GSE39055, significantly involved in neutrophil mediated immunity. Screening of genes with area under the ROC curve (AUC) values greater than 0.73 in both GSE99671 and GSE39055 identified 5 key genes when compared with genes from module 1. The nomogram results showed that ATF5, CHCHD8, ENOPH1, and LOC286367 might predict 5-year or 8-year survival time of osteosarcoma patients. The Cox model results confirmed that the signals of ATF5, CHCHD8, and LOC286367 were robust, and it may be used in the diagnosis, treatment, and prognosis of osteosarcoma.
Conclusion
We found that ATF5, CHCHD8, and LOC286367 can effectively identify osteosarcoma tumorigenesis and even recurrence status. This is helpful for early diagnosis and treatment, improving the clinical treatment of patients with osteosarcoma.
Introduction
Osteosarcoma is the most common primary bone malignancy, mainly affecting children and young adults.Citation1 Osteosarcoma consists of malignant osteoblasts producing immature bone and bone tissue.Citation2 Although standard treatment with surgical resection and adjuvant chemotherapy has significantly improved the 5-year survival rate of osteosarcoma patients to approximately 60–70%, no significant progress has been made in improving the survival rate of patients with recurrence or metastasis over the past 30 years.Citation3,Citation4 The lack of understanding of the molecular mechanisms underlying the occurrence and recurrence of osteosarcoma has severely hampered improved patient survival. When diagnosed, 40% of metastases occur in patients with advanced osteosarcoma.Citation5 Therefore, elucidating the functions of osteosarcoma-related genes and exploring the possible pathological mechanisms of osteosarcoma initiation, development and recurrence are crucial for the future detection and treatment of osteosarcoma.
Depending on the histological morphology, three main categories can be distinguished: high-grade, which includes most subtypes, and intermediate and low-grade, which include periosteal and periosteal.Citation6 Conventional osteosarcoma refers to high-grade tumors with intramedullary growth and is the most common type, accounting for 85% of all osteosarcoma cases during childhood and adolescence.Citation7 The osteosarcoma tumor microenvironment is composed of osteosarcoma cells, osteocytes, stromal cells, vascular cells, immune cells, and the extracellular matrix (ECM).Citation8 This creates a complex environment for tumor growth. More immune infiltration is found in osteosarcoma tumors to promote a local immune tolerant environment.Citation9 Given the close connection between bone tissue and the immune system, it has been speculated that osteosarcoma may use similar mechanisms to evade immune recognition.Citation10
With the development of molecular biology technology, tumor gene therapy for osteosarcoma has potential clinical applications.Citation11,Citation12 Accumulating evidence indicates that the occurrence, development and prognosis of osteosarcoma are closely related to molecular mechanisms.Citation13,Citation14 Through high-throughput sequencing, gene expression in osteosarcoma can be compared to normal samples, leading to an initial selection of potential targets for anticancer therapy.Citation15 This also includes some common long non-coding RNAs (lncRNAs).Citation16
This study aimed to discover the occurrence- or recurrence-related potential markers according to the osteosarcoma-related gene expression profiles in Gene Expression Omnibus (GEO) database. Multiple differentially expressed genes (DEGs) were screened using the weighted gene co-expression network analysis (WGCNA) algorithm. The main signaling pathways of osteosarcoma were analyzed by Gene Ontology (GO), function and Kyoto Encyclopedia of genes (KEGG) pathways. Subsequently, Kaplan–Meier and Cox models were utilized to screen the key genes related to the prognosis of osteosarcoma. The findings may provide new biomarkers and therapeutic target molecules for the occurrence and recurrence of osteosarcoma.
Materials and Methods
Data Sources
Osteosarcoma data were collected from the gene expression omnibus (GEO) (https://www.ncbi.nlm.nih.gov/geo) databases. GSE99671 included mRNA expression profiling of fresh-frozen bone samples from 18 tumoral samples and 18 non-tumoral paired samples by high throughput sequencing.Citation17,Citation18 The raw data were standardized and normalized through R package DEseq2;Citation19 then, the gene expression profile was provided in Table S1. GSE39055 included mRNA expression profiling of formalin-fixed, paraffin-embedded (FFPE) samples from 37 unique diagnostic biopsy specimens of osteosarcoma with (n=18) or non-recurrence (n=19) by array.Citation20 Expression data were processed using the R package lumiCitation21 and provided in Table S2. All data were obtained from an open-access database, thus, acquiring ethical approval was not necessary.
Differential Analysis
Next, the DEseq2 package was used to identify differentially expressed genes (DEGs) in osteosarcoma (n = 18) and healthy controls (n = 18) in GSE99671 data. The limma packageCitation22 was used to screen DEGs between the recurrent osteosarcoma and non-recurrent osteosarcoma in GSE39055 data. P < 0.05 was set as the screening condition. The expression of DEGs was visualized with volcano plots.
Construction of Networks
The coexpression network for DEGs in GSE99671 was performed using Weighted correlation network analysis (WGCNA) by “WGCNA” R package.Citation23 The samples were used to construct scale-free topology networks, and all gene adjacencies were calculated to make a topological overlap matrix (TOM). The soft-thresholding power was chosen and used as the correlation coefficient threshold. Then, a minimum number of genes in the modules were built. The expression pattern of eigengene in each module is condensed into “module eigengene (ME)”. Genes in MEs were considered had similar expression patterns. The module–trail relationships were demonstrated using Pearson correlation analysis.
Enrichment Analysis
The biological process (BP) in Gene Ontology (GO) and Kyoto Encyclopedia of Genes and Genomes (KEGG) for module genes or DEGs in GSE39055 were performed using R software package clusterProfiler.Citation24 Gene set variation analysis (GSVA) was carried out using the GSVA package.Citation25 For each sample, a score for the enrichment of a set of genes using gene expression profile was obtained. A P value < 0.05 was considered statistical significance. The R package clusterProfiler was used to obtain the background set for gene set enrichment analysis (GSEA). GSEA runs in Java environment and conducted between osteosarcoma and control samples.
Screening of Survival Related Genes
Kaplan–Meier (K-M) survival analysis with the R package survival was applied to identify overall survival (OS) associated genes among the module genes. Prognostic relevant genes among the key genes were determined using Cox regression analysis in a survival package based on gene expression values and survival status data. P < 0.05 was considered to be a statistically significant difference. Based on the correlation coefficients of the risk model, a formula for calculating the prognostic risk score for each patient was established. According to the median value of the risk score, patients were divided into high- and low-risk groups.
ROC Curve
To evaluate whether the identified survival-related genes have significant diagnostic value for osteosarcoma or recurrent osteosarcoma, we performed ROC analysis using the R software package pROC.Citation26 The area under the ROC curve (AUC) was calculated for each gene. The diagnostic accuracy of key biomarkers was evaluated using AUC values. Here, this gene can distinguish osteosarcoma from healthy individuals or recurrent osteosarcoma from non-recurrent osteosarcoma when the AUC value is greater than 0.6.
Single Sample Gene Set Enrichment Analysis (ssGSEA)
The marker gene expression information for immune cell types was obtained by Bindea et al.Citation27 The infiltration scores of immune cells were calculated using ssGSEA in GSVA R software package. Correlations between immune cells and key genes were calculated using Pearson correlation. P value <0.05 was considered significant.
Results
Coexpression of Differentially Expressed Genes
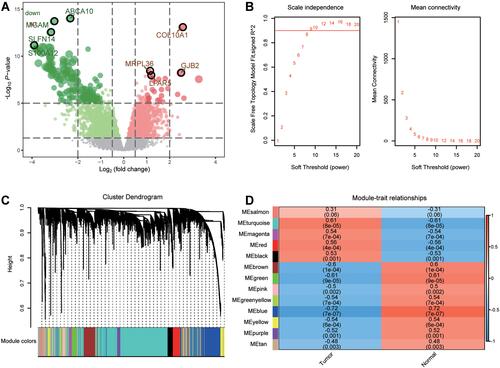
The flowchart of this study is shown in . To identify differences in gene expression between osteosarcoma and controls, we performed a differential analysis of the osteosarcoma and control groups in GSE99671. Using threshold screening, we obtained 4871 differentially expressed genes (DEGs) between osteosarcoma and controls (). The co-expression behaviors of these genes were identified by performing WGCNA on the DEGs. To ensure that the coexpression network could obey the scale-free criterion, we selected β = 9 as a soft-thresholding (). We identified a total of 13 coexpression modules (). Pearson correlation analysis showed that MEturquoise (M1) had the highest positive correlation with osteosarcoma ().
Figure 1 The flowchart of this study. The GSE99671 data and GSE39055 data were used to identify potential biomarkers related to the occurrence and recurrence of osteosarcoma. The module genes identified in GSE99671 were used to evaluate their prognostic and diagnostic value in GSE39055. Further screening of key genes may be a target for diagnosis and treatment of osteosarcoma.
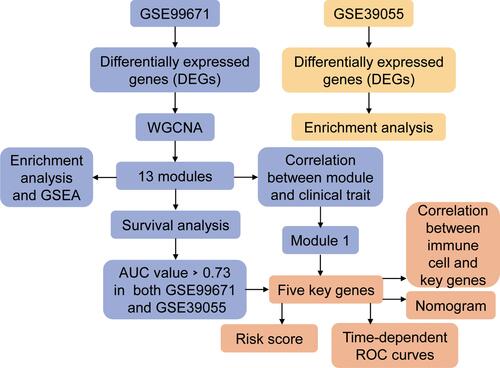
Figure 2 Coexpression modules of differentially expressed genes. (A) The differentially expressed genes between osteosarcoma and controls in GSE99671. (B) The scale-free fit index and the mean connectivity for various soft-thresholding powers. (C) Common genes were identified for thirteen coexpression modules by WGCNA. (D) Correlations between modules and clinical trait were analyzed by Pearson correlation.
Biological Functions of Module Genes
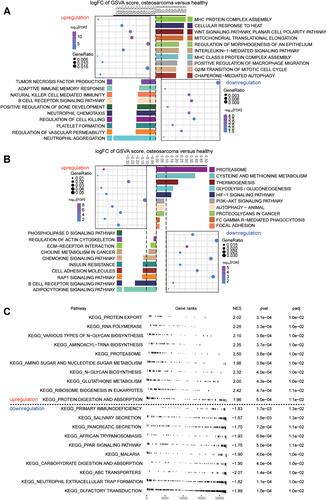
To identify the biological roles of module genes, we performed enrichment analysis. It was found that module genes were significantly enriched in activated “positive regulation of macrophage migration“, “chaperone mediated autophagy“, “MHC protein complex assembly“ biological processes; and inhibited “neutrophil aggregation“, “regulation of vascular permeability“, “regulation of cell killing“ in osteosarcoma (). Using KEGG enrichment results, we found that activated HIF-1 signaling pathway, PI3K-Akt signaling pathway, and autophagy animal were significantly enriched by module genes, and inhibited B cell receptor signaling pathway, Rap1 signaling pathway, and ECM receptor interaction were also significantly enriched in osteosarcoma (). GSEA results showed that protein export, RNA polymerase, and proteasome were significantly enriched in osteosarcoma, primary immunodeficiency, PPAR signaling pathway, and neutrophil extracellular trap formation were significantly enriched in control samples ().
Figure 3 Biological functions of module gene enrichment. (A) Module genes significantly enriched for activated and inhibited biological processes. (B) Module genes significantly enriched for activated and inhibited KEGG pathway. (C) The activated and inhibited KEGG pathways in GSEA of module genes involved. P < 0.05 was considered statistically significant.
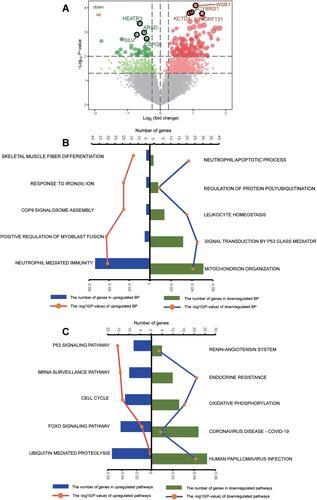
Recurrence Related Changes of Osteosarcoma
To identify molecular alterations associated with osteosarcoma recurrence, we performed a differential analysis of recurrent and non-recurrent osteosarcoma gene expression in GSE39055. A total of 1126 differentially expressed genes were obtained (). In GO enrichment results, the activated “neutrophil mediated immunity“, “skeletal muscle fiber differentiation“, “response to iron (III) ion“ and inhibited “neutrophil apoptotic process“, “leukocyte homeostasis“, “mitochondrial organization“ were significantly enriched by differentially expressed genes (). KEGG enrichment results identified that the differentially expressed genes were significantly involved in the activated “endocrine resistance“, “oxidative phosphorylation“, “renin angiotensin system“; and inhibited “p53 signaling pathway“, “cell cycle“, “FOXO signaling pathway“ in recurrent osteosarcoma ().
Figure 4 The potential molecular changes in osteosarcoma recurrence. (A) Volcano plot of differentially expressed genes between recurrent osteosarcoma and non-recurrent osteosarcoma. Red for activated and green for inhibited. The four genes with the largest fold change of activated or inhibited were labeled. (B) Differentially expressed genes involved in activated and inhibited biological processes quantified by gene set variation analysis (GSVA). The longer the column, the more genes involved in this term. (C) Differentially expressed genes involved in activated and inhibited KEGG pathway quantified by gene set variation analysis (GSVA). The longer the column, the more genes involved in this term.
Identification of Potential Diagnostic Genes
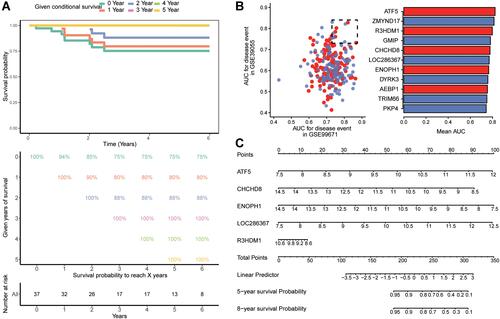
From the survival information of 37 osteosarcoma patients obtained from GSE39055, we found that the patient’s 5-year overall survival (OS) was 35% (). The survival probability increased per year already survival related to the total survival time. To identify key genes involved in the prognosis of osteosarcoma, we performed KM curve analysis of module genes. Among the module genes, we identified 262 genes that significantly affected osteosarcoma survival. By plotting the ROC curves of these survival-related genes, we screened for genes with AUC values greater than 0.73 in both GSE99671 and GSE39055 (). Including AEBP1, ATF5, CHCHD8, DYRK3, ENOPH1, GMIP, LOC286367, PKP4, R3HDM1, TRIM66, and ZMYND17. They were also differentially expressed genes in GSE39055 and thus may predict both osteosarcoma occurrence and recurrence. In addition, five genes (ATF5, CHCHD8, ENOPH1, LOC286367, and R3HDM1) were identified as potentially most strongly associated with osteosarcoma by contrasting with the gene for module 1. They were identified as key genes. Nomograms were constructed using Cox regression analysis results, and differential expression of ATF5, CHCHD8, ENOPH1, and LOC286367 could predict 5 - and 8-year OS of osteosarcoma patients ().
Figure 5 Screening of key genes predicting the occurrence and recurrence of osteosarcoma. (A) Kaplan–Meier estimates for conditional survival up to 6 years in 37 patients given 0–5 years’ survival of osteosarcoma. Each column represents the survival time, and each row represents the percentage reaching the specified survival time. (B) On the left are survival associated genes with AUC values in GSE99671 and GSE39055 and on the right are genes with AUC values greater than 0.73 in both datasets. Red represents up-regulated expression and blue represents down regulated expression. The length of the column represents the mean AUC value. (C) Nomogram for the prediction of overall survival to achieve 5-year or 8-year survival time.
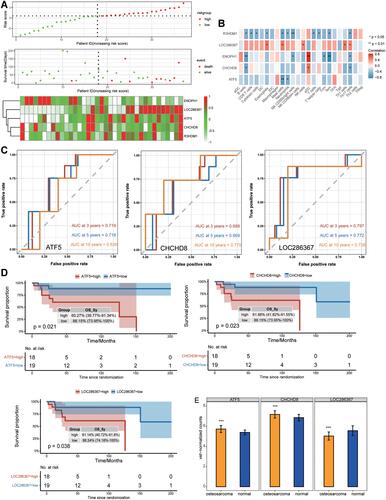
On the other hand, osteosarcoma patients in GSE39055 were divided into high-risk and low-risk groups according to the median risk score which calculated by the Cox model (). The expressions of key genes in the high-risk and low-risk groups were different. Patients with death status were significantly higher in the high-risk group than in the low-risk group. In addition, we calculated the correlation of key genes and immune cells, LOC286367 was positively correlated with most immune cells, other key genes were negatively correlated with more immune cells (). The prediction capability of the key genes was evaluated by calculating the area under the ROC curve (AUC). The AUC values of ATF5, CHCHD8, and LOC286367 for predicting OS were greater than 0.6 in the first, third, and fifth year of osteosarcoma, indicating that they had good performance (). High expression of ATF5, CHCHD8, and LOC286367 was associated with the worst OS in osteosarcoma patients (). ATF5, CHCHD8, and LOC286367 were expressed at significantly higher levels of osteosarcoma compared with the normal group in GSE99671 ().
Figure 6 Diagnostic role of key genes predicting the survival of osteosarcoma. (A) Distribution of risk score, overall survival, and overall survival status and heatmap of the five key genes in the GSE39055. (B) Correlations between immune infiltrating cells and key genes were calculated using Pearson. *P < 0.05, **P < 0.01. (C) Time-dependent ROC curves measuring the predictive value of key genes in GSE39055 for 3-year, 5-year or 10-year survival time. (D) Effect of key genes expression on overall survival by Kaplan–Meier analysis in 37 patients with osteosarcoma. (E) The expression levels of ATF5, CHCHD8, and LOC286367 in osteosarcoma and normal of GSE99671. ***P < 0.001.
Discussion
Osteosarcoma is one of the most common aggressive bone tumors and is currently treated with chemical drugs combined with surgical resection. A major unsolved problem is the poor prognosis characterized by drug resistance, recurrence and metastasis.Citation28 The identification of gene signatures is crucial both for a better understanding of the molecular basis of osteosarcoma progression and for the discovery of novel targets.Citation29 In the present study, we focused on the potential target genes with prognostic value for osteosarcoma. Gene expression profiling of differentially expressed genes detected by GSE99671 in osteosarcoma tissue samples established 13 coexpression modules. Module genes were mainly enriched in immune, inflammatory and metabolic responses. In the gene co-expression network, module 1 was most significantly associated with osteosarcoma, in which genes significantly affecting survival may be potential target genes. Furthermore, combining GSE39055, we identified 5 key genes that may serve as diagnostic markers for the occurrence and recurrence of osteosarcoma. Finally, high expression of ATF5, CHCHD8, and LOC286367 was associated with worse prognosis in osteosarcoma.
WGCNA is a systems biology approach that describes correlation patterns between genes in transcriptome samples with soft threshold algorithms.Citation23 The results of GO and KEGG pathway enrichment analysis of the module genes led us to focus on the biological functions of autophagy and macrophage migration, as well as the HIF-1 signaling pathway and PI3K-Akt signaling pathway. Autophagy promotes the proliferation and development of osteosarcoma cells and resists tumor treatment.Citation30 Autophagy may be involved in drug sensitivity or chemoresistance during osteosarcoma treatment.Citation31 Macrophages are an important immune component in the osteosarcoma microenvironment. Macrophages are highly plastic and the inflammatory phenotype (M1) and anti-inflammatory phenotype (M2) may play opposite roles in the progression of osteosarcoma.Citation32 Activation of the HIF-1 signaling pathway promotes osteosarcoma cell growth and is a promising therapeutic target.Citation33 Accumulating evidence suggests that the PI3K/Akt pathway is involved in cancer initiation and progression, such as tumorigenesis, apoptosis inhibition, proliferation and drug resistance.Citation34
To further identify the underlying molecular mechanisms of osteosarcoma recurrence, we performed enrichment analysis of the differentially expressed genes between recurrence and non-recurrence. We found multiple immune related pathways, neutrophil mediated immunity, neutrophil apoptotic process, and leukocyte homeostasis. They may be associated with metastasis and recurrence of osteosarcoma.Citation35 In addition to a large number of aberrant biological functions, FOXO could control the expression of genes involved in cell death and cell cycle arrest, exerting tumor suppressor activity.Citation36 Tumor suppressor p53 tumor cells have been reported to exert anticancer effects by inducing cell cycle arrest and apoptosis.Citation37
Of the 13 coexpression modules we identified, module 1 was found to be strongly associated with osteosarcoma. Among the module genes identified to be significantly associated with OS of osteosarcoma, 11 genes were screened with high specificity and sensitivity as potential molecular markers for predicting the occurrence and recurrence of osteosarcoma. Among them, 5 genes were genes in module 1 and were considered as key genes. In the Cox regression model, high expression of CHCHD8 or ENOPH1 may benefit the prognosis of osteosarcoma patients, and low expression of ATF5 or LOC286367 may prolong patient survival. However, the K-M curve results differed from the Cox analysis results in that patients with low expression of the CHCHD8 gene had better overall survival. The risk assessment model constructed by 5 key genes clearly distinguished the status of osteosarcoma survival and death. Based on the time-dependent ROC curves results, we identified ATF5, CHCHD8, and LOC286367 as potential diagnostic and prognostic biomarkers for clinical outcome prediction. ATF5 is considered an anti-apoptotic factor because it regulates the expression of the anti-apoptotic components BCL2 and MCL1.Citation38 Studies have reported ATF5 to promote tumor growth and survival and have been reported to be associated with recurrence of osteosarcoma.Citation39,Citation40 CHCHD8 has been reported to be associated with drug resistance in gastric cancer, but the association with osteosarcoma has not been reported.Citation41 LOC286367 was reported to be associated with inflammatory response,Citation42,Citation43 the results of our analysis argued that it may be a potential marker for the occurrence and recurrence of osteosarcoma.
However, the present study has certain limitations. The first and most important is the lack of experimental validation. Second, the lack of detailed clinical data, such as chemotherapy regimens and tumor stages, limits in-depth association analyses. Finally, whether the biomarkers we identified can be applied in the clinic also needs a large number of samples to validate, which will be the focus of our future studies.
Conclusion
The present study identified potential diagnostic markers and useful therapeutic targets for osteosarcoma patients, and they may be able to predict patient prognosis. The mechanism of recurrence of osteosarcoma may be associated with neutrophil immunity and cell cycle arrest. In-depth exploration of the potential target genes and molecular deregulation mechanisms to develop corresponding prevention and treatment countermeasures can achieve breakthrough progress in the prognosis of osteosarcoma.
Data Sharing Statement
Data were downloaded from the Gene Expression Omnibus (GEO) database (https://www.ncbi.nlm.nih.gov/geo/).
Acknowledgments
This study was supported by the Scientific Research Project of Guangxi Health Commission (Z20180799).
Disclosure
The authors report no conflicts of interest related to this work.
References
- Zhao Z, Jin G, Yao K, et al. Aurora B kinase as a novel molecular target for inhibition the growth of osteosarcoma. Mol Carcinog. 2019;58(6):1056–1067. doi:10.1002/mc.22993
- Kansara M, Teng MW, Smyth MJ, Thomas DM. Translational biology of osteosarcoma. Nat Rev Cancer. 2014;14(11):722–735. doi:10.1038/nrc3838
- Mirabello L, Troisi RJ, Savage SA. Osteosarcoma incidence and survival rates from 1973 to 2004: data from the surveillance, epidemiology, and end results program. Cancer. 2009;115(7):1531–1543. doi:10.1002/cncr.24121
- Isakoff MS, Bielack SS, Meltzer P, Gorlick R. Osteosarcoma: current treatment and a collaborative pathway to success. J Clin Oncol. 2015;33(27):3029–3035. doi:10.1200/JCO.2014.59.4895
- Taran SJ, Taran R, Malipatil NB. Pediatric osteosarcoma: an updated review. Indian J Med Paediatr Oncol. 2017;38(1):33–43. doi:10.4103/0971-5851.203513
- Lindsey BA, Markel JE, Kleinerman ES. Osteosarcoma overview. Rheumatol Ther. 2017;4(1):25–43. doi:10.1007/s40744-016-0050-2
- Rickel K, Fang F, Tao J. Molecular genetics of osteosarcoma. Bone. 2017;102:69–79. doi:10.1016/j.bone.2016.10.017
- Corre I, Verrecchia F, Crenn V, Redini F, Trichet V. The osteosarcoma microenvironment: a complex but targetable ecosystem. Cells. 2020;9(4). doi:10.3390/cells9040976
- Heymann MF, Lezot F, Heymann D. The contribution of immune infiltrates and the local microenvironment in the pathogenesis of osteosarcoma. Cell Immunol. 2019;343:103711. doi:10.1016/j.cellimm.2017.10.011
- Lilienthal I, Herold N. Targeting molecular mechanisms underlying treatment efficacy and resistance in osteosarcoma: a review of current and future strategies. Int J Mol Sci. 2020;21(18):6885. doi:10.3390/ijms21186885
- Fan H, Lu S, Wang S, Zhang S. Identification of critical genes associated with human osteosarcoma metastasis based on integrated gene expression profiling. Mol Med Rep. 2019;20(2):915–930. doi:10.3892/mmr.2019.10323
- Zhang Y, Zvi YS, Batko B, et al. Down-regulation of Skp2 expression inhibits invasion and lung metastasis in osteosarcoma. Sci Rep. 2018;8(1):14294. doi:10.1038/s41598-018-32428-9
- Li Z, Jia M, Wu X, Cui J, Pan A, Li L. Overexpression of Trps1 contributes to tumor angiogenesis and poor prognosis of human osteosarcoma. Diagn Pathol. 2015;10:167. doi:10.1186/s13000-015-0401-2
- Wang S, Gao H, Zuo J, Gao Z. Cyclooxygenase-2 expression correlates with development, progression, metastasis, and prognosis of osteosarcoma: a meta-analysis and trial sequential analysis. FEBS Open Bio. 2019;9(2):226–240. doi:10.1002/2211-5463.12560
- Czarnecka AM, Synoradzki K, Firlej W, et al. Molecular biology of osteosarcoma. Cancers (Basel). 2020;12(8):2130. doi:10.3390/cancers12082130
- Li Y, Zhang T, Zhang Y, Zhao X, Wang W. Targeting the FOXM1-regulated long noncoding RNA TUG1 in osteosarcoma. Cancer Sci. 2018;109(10):3093–3104. doi:10.1111/cas.13765
- Ho XD, Phung P, Ql V, et al. Whole transcriptome analysis identifies differentially regulated networks between osteosarcoma and normal bone samples. Exp Biol Med (Maywood). 2017;242(18):1802–1811. doi:10.1177/1535370217736512
- Ho XD, Nguyen HG, Trinh LH, et al. Analysis of the expression of repetitive DNA elements in osteosarcoma. Front Genet. 2017;8:193. doi:10.3389/fgene.2017.00193
- Love MI, Huber W, Anders S. Moderated estimation of fold change and dispersion for RNA-seq data with DESeq2. Genome Biol. 2014;15(12):550. doi:10.1186/s13059-014-0550-8
- Kelly AD, Haibe-Kains B, Janeway KA, et al. MicroRNA paraffin-based studies in osteosarcoma reveal reproducible independent prognostic profiles at 14q32. Genome Med. 2013;5(1):2. doi:10.1186/gm406
- Du P, Kibbe WA, Lin SM. lumi: a pipeline for processing Illumina microarray. Bioinformatics. 2008;24(13):1547–1548. doi:10.1093/bioinformatics/btn224
- Ritchie ME, Phipson B, Wu D, et al. limma powers differential expression analyses for RNA-sequencing and microarray studies. Nucleic Acids Res. 2015;43(7):e47. doi:10.1093/nar/gkv007
- Langfelder P, Horvath S. WGCNA: an R package for weighted correlation network analysis. BMC Bioinform. 2008;9:559. doi:10.1186/1471-2105-9-559
- Yu G, Wang LG, Han Y, He QY. clusterProfiler: an R package for comparing biological themes among gene clusters. OMICS. 2012;16(5):284–287. doi:10.1089/omi.2011.0118
- Hanzelmann S, Castelo R, Guinney J. GSVA: gene set variation analysis for microarray and RNA-seq data. BMC Bioinform. 2013;14:7. doi:10.1186/1471-2105-14-7
- Robin X, Turck N, Hainard A, et al. pROC: an open-source package for R and S+ to analyze and compare ROC curves. BMC Bioinform. 2011;12:77. doi:10.1186/1471-2105-12-77
- Bindea G, Mlecnik B, Tosolini M, et al. Spatiotemporal dynamics of intratumoral immune cells reveal the immune landscape in human cancer. Immunity. 2013;39(4):782–795. doi:10.1016/j.immuni.2013.10.003
- Ritter J, Bielack SS, Osteosarcoma. Ann Oncol. 2010;21 Suppl 7:vii320–325. doi:10.1093/annonc/mdq276
- Ma H, Seebacher NA, Hornicek FJ, Duan Z. Cyclin-dependent kinase 9 (CDK9) is a novel prognostic marker and therapeutic target in osteosarcoma. EBioMedicine. 2019;39:182–193. doi:10.1016/j.ebiom.2018.12.022
- Camuzard O, Santucci-Darmanin S, Carle GF, Pierrefite-Carle V. Role of autophagy in osteosarcoma. J Bone Oncol. 2019;16:100235. doi:10.1016/j.jbo.2019.100235
- Kim M, Jung JY, Choi S, et al. GFRA1 promotes cisplatin-induced chemoresistance in osteosarcoma by inducing autophagy. Autophagy. 2017;13(1):149–168. doi:10.1080/15548627.2016.1239676
- Cersosimo F, Lonardi S, Bernardini G, et al. Tumor-associated macrophages in osteosarcoma: from mechanisms to therapy. Int J Mol Sci. 2020;21(15):5207. doi:10.3390/ijms21155207
- Li T, Xiao Y, Huang T. HIF1alphainduced upregulation of lncRNA UCA1 promotes cell growth in osteosarcoma by inactivating the PTEN/AKT signaling pathway. Oncol Rep. 2018;39(3):1072–1080. doi:10.3892/or.2018.6182
- Zhu J, Sun Y, Lu Y, et al. Glaucocalyxin A exerts anticancer effect on osteosarcoma by inhibiting GLI1 nuclear translocation via regulating PI3K/Akt pathway. Cell Death Dis. 2018;9(6):708. doi:10.1038/s41419-018-0684-9
- Masucci MT, Minopoli M, Carriero MV. Tumor associated neutrophils. their role in tumorigenesis, metastasis, prognosis and therapy. Front Oncol. 2019;9:1146. doi:10.3389/fonc.2019.01146
- Farhan M, Wang H, Gaur U, Little PJ, Xu J, Zheng W. FOXO signaling pathways as therapeutic targets in cancer. Int J Biol Sci. 2017;13(7):815–827. doi:10.7150/ijbs.20052
- Sun Y, Xia P, Zhang H, Liu B, Shi Y. P53 is required for Doxorubicin-induced apoptosis via the TGF-beta signaling pathway in osteosarcoma-derived cells. Am J Cancer Res. 2016;6(1):114–125.
- Deng P, Haynes CM. Mitochondrial dysfunction in cancer: potential roles of ATF5 and the mitochondrial UPR. Semin Cancer Biol. 2017;47:43–49. doi:10.1016/j.semcancer.2017.05.002
- Greene LA, Lee HY, Angelastro JM. The transcription factor ATF5: role in neurodevelopment and neural tumors. J Neurochem. 2009;108(1):11–22. doi:10.1111/j.1471-4159.2008.05749.x
- Zhang S, Ding L, Li X, Fan H. Identification of biomarkers associated with the recurrence of osteosarcoma using ceRNA regulatory network analysis. Int J Mol Med. 2019;43(4):1723–1733. doi:10.3892/ijmm.2019.4108
- Kim HK, Choi IJ, Kim CG, et al. A gene expression signature of acquired chemoresistance to cisplatin and fluorouracil combination chemotherapy in gastric cancer patients. PLoS One. 2011;6(2):e16694. doi:10.1371/journal.pone.0016694
- Ma X, Wang T, Zhao ZL, Jiang Y, Ye S. Propofol suppresses proinflammatory cytokine production by increasing ABCA1 expression via mediation by the long noncoding RNA LOC286367. Mediators Inflamm. 2018;2018:8907143. doi:10.1155/2018/8907143
- Yan Y, Song D, Wu J, Wang J. Long non-coding RNAs link oxidized low-density lipoprotein with the inflammatory response of macrophages in atherogenesis. Front Immunol. 2020;11:24. doi:10.3389/fimmu.2020.00024