
Abstract
Purpose
Type 2 diabetes mellitus (T2DM) increases the risk of ischemic stroke and poor prognosis. This study aimed to identify molecular mechanisms that are dysregulated in T2DM-associated ischemic stroke and candidate genes that might serve as biomarkers.
Methods
The top 25% variance genes in the GSE21321 and GSE22255 datasets were analyzed for coexpression. The differentially expressed mRNAs (DEmRs) between patients with T2DM or ischemic stroke and controls were analyzed. Then, the union of overlapping coexpressed genes and overlapping DEmRs was analyzed. The miRNAs differentially expressed in T2DM-associated ischemic stroke were also analyzed. CIBERSORT was used to evaluate the levels of infiltration by immune cells in T2DM-associated stroke.
Results
Thirteen coexpression modules were identified in T2DM and 10 in ischemic stroke, and 594 module genes were shared between the two conditions. A total of 4452 mRNAs differentially expressed between T2DM patients and controls were identified, as were 2390 mRNAs differentially expressed between ischemic stroke and controls. The 771 union genes were enriched mainly in immune-related biological functions and signaling pathways. UBE2N, TGFB3, EXOSC1, and VIM were identified as candidate markers. In addition, we identified miR-576-3p as having the most regulatory roles in both T2DM and ischemic stroke. Mast cell activation was significantly down-regulated in T2DM but up-regulated in ischemic stroke.
Conclusion
These findings provide numerous testable hypotheses about the pathways underlying T2DM-associated ischemic stroke, which may help identify therapeutic targets.
Introduction
Diabetes mellitus, the most common form of which is type 2 diabetes (T2DM), is a major public health problem. It is estimated that the number of people in the world with the condition will reach 642 million by 2040.Citation1,Citation2 The rising prevalence of diabetes mellitus means rising prevalence of numerous health complications such as retinopathy, nephropathy, neuropathy, cognitive impairment and ischemic stroke.Citation3 Ischemic stroke is the leading cause of death and disability worldwide, affecting about 30 million people.Citation4 It is the second most frequent cause of death in the world, after heart disease.Citation5
T2DM increases the risk of ischemic stroke by nearly 2 to 3 times, thereby increasing the risk of associated mortality.Citation6–Citation8 Ischemic stroke can cause more serious micro- and macrovascular damage when it occurs in a diabetes background, profoundly impacting multiple organs and aggravating pathological cascades after stroke.Citation9 Diabetes can aggravate the acute inflammatory response after ischemic stroke and increase levels of inflammatory factors in the brain.Citation10 Ischemic stroke can induce or aggravate cerebrovascular damage, especially in diabetic patients under 65 years old.Citation11
Antihypertensive, antiplatelet, and hypolipidemic agents can reduce the risk of ischemic stroke in diabetic patients,Citation12 but even with treatment, individuals with diabetes are at higher risk of cerebrovascular accidents than individuals without diabetes.Citation13 In fact, up to 80% of individuals with diabetes eventually die of macrovascular complications.Citation14 The clinical symptoms of ischemic stroke appear late in the course of the disease, and given the limited therapeutic options, effective preventive treatments and early diagnostic markers are urgently needed.Citation15 In addition, more effective risk stratification may lead to better management and even prevention of ischemic stroke.Citation16
Identifying molecular pathways involved in ischemic stroke means examining gene expression, reflected in levels of mRNAs, but also levels of microRNAs (miRNAs). These regulatory molecules interact with the 3ʹ untranslated region (3ʹUTR) of the target mRNA to inhibit translation.Citation17 Various stages of cerebral ischemic injury and various types of brain injury involve miRNAs.Citation18,Citation19 In fact, ischemic stroke has been linked to dysregulation of miRNAs, which have been proposed as potential therapeutic strategies.Citation10,Citation20
The present study aimed to explore molecular mechanisms and potential markers of ischemic stroke in patients with T2DM, based on analysis of differential mRNA and miRNA expression profiles in patients and controls.
Materials and Methods
Data Collection
All data were obtained from the Gene Expression Omnibus (GEO) database (https://www.ncbi.nlm.nih.gov/geo). The GSE21321 dataset included mRNA expression profiles derived from blood samples of nine men with T2DM and eight men with no history of T2DM based on the GPL6883 platform. The GSE21321 dataset included miRNA expression profiles derived from blood samples of nine men with T2DM and 10 healthy men with no history of T2DM, based on the GPL10322 platform. The GSE22255 dataset included mRNA expression profiles derived from peripheral blood mononuclear cells from 20 ischemic stroke patients and 20 sex- and age-matched controls, based on the GPL570 platform. The GSE110993 dataset included miRNA expression profiles derived from peripheral blood samples from 20 ischemic stroke patients and 20 matched healthy control subjects according to age and sex, based on the GPL15456 platform.
Construction of a Coexpression Network
Weighted gene co-expression network analysis (WGCNA), a method that identifies gene coexpression networks based on topological overlap,Citation20 was performed on the top 25% of genes explaining the observed expression differences in the GPL6883 and GPL570 platforms. Coexpression network modules were constructed using the WGCNA package in the R suite,Citation21 as follows. Pairwise correlations between genes were used to generate a similarity matrix, then soft threshold power values were calculated to generate a scale-free network topology. The topological overlap matrix (TOM) similarity functionCitation20 was used to convert adjacency values into a TOM matrix, which was used to cluster genes into different modules.
Analysis of Differential Expression
The limma package inRCitation22 was used to identify mRNAs and miRNAs differentially expressed between T2DM patients and controls in the GSE21321 dataset, as well as mRNAs differentially expressed between ischemic stroke patients and controls in the GSE22255 dataset. The DESeq2 package inRCitation23 was used to identify miRNAs differentially expressed between ischemic stroke patients and controls in the GSE110993 dataset. Differences associated with P < 0.05 were considered significant and included in subsequent analyses.
Functional and Pathway Enrichment of Differentially Expressed mRNAs
The clusterProfiler package inRCitation24 was used to examine functional enrichment of differentially expressed mRNAs based on Gene Ontology (GO) and the Kyoto Encyclopedia of Genes and Genomes (KEGG). The GO terms included biological processes (BPs), cellular components (CCs), and molecular functions (MFs). Enrichment results were visualized using the ggplot2 package in R.Citation25 Gene set enrichment analysis (GSEA) was carried out for mRNAs differentially expressed in both T2DM and ischemic stroke using the fgsea package in R.Citation26 Enrichment was considered significant if it was associated with P < 0.05.
CIBERSORT Analysis of Immune Cell Infiltration
CIBERSORT (https://cibersort.stanford.edu/) was used to assess the levels of infiltration by 22 types of immune cells in T2DM and ischemic stroke. Immune cells expressed as 0 were excluded from the analysis. The limma package in R was used to calculate differences in infiltration levels between T2DM patients and controls, as well as between ischemic stroke patients and controls. We also explored potential correlations between hub gene expression and immune cell infiltration using Pearson correlation analysis. Results associated with P < 0.05 were considered significant.
Prediction Genes Regulated by Differentially Expressed miRNAs
The target genes regulated by differentially expressed miRNAs were predicted using Targetscan (http://www.targetscan.org/vert_72/). Targets were defined as those with a total context++ score greater than 0.1. These target genes were assessed for their ability to diagnose ischemic stroke in T2DM patients based on the area under the receiver operating characteristic curve (AUC), which was calculated using the pROC package in R.Citation27
Results
Construction of Coexpression Network Linking T2DM and Ischemic Stroke
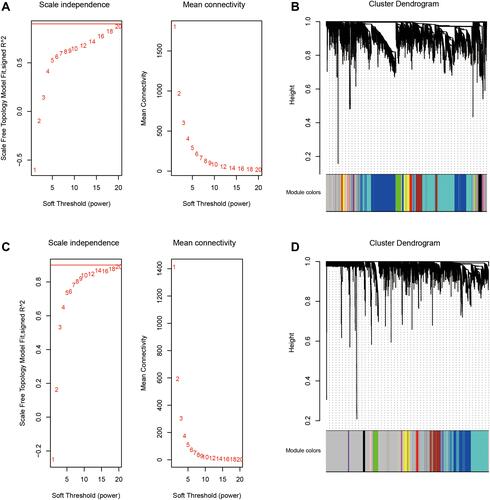
To explore gene expression relationships between T2DM and ischemic stroke, we performed WGCNA (). In the case of T2DM, 4658 genes explaining the top 25% in observed expression variance were assigned to 13 coexpression modules based on a soft power threshold β = 20 () and the TOM matrix (). In the case of ischemic stroke, 5116 genes were assigned to 10 coexpression modules based on a soft power threshold of β = 20 ( and ). A total of 594 genes were found to overlap between the coexpression modules in T2DM and ischemic stroke, and these genes were considered to be associated with both conditions.
Figure 1 Flowchart of the study.
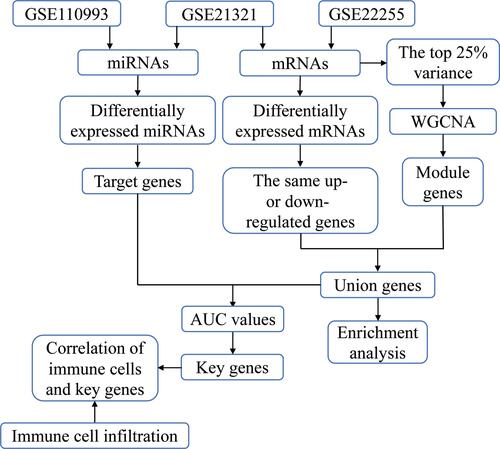
Figure 2 WGCNA of the top 25% variance genes in T2DM and ischemic stroke. (A) Scale independence and mean connectivity were used to obtain a scale-free fit index of network topology for T2DM. (B) Clustering dendrograms of coexpressed genes in T2DM. Each color represents a module in the coexpression network from the WGCNA. (C) Scale independence and mean connectivity were used to obtain the scale-free fit index of network topology for ischemic stroke. (D) Clustering dendrograms of coexpressed genes in ischemic stroke. Each color represents a module in the coexpression network from the WGCNA.
Differentially Expressed mRNAs in T2DM and Ischemic Stroke
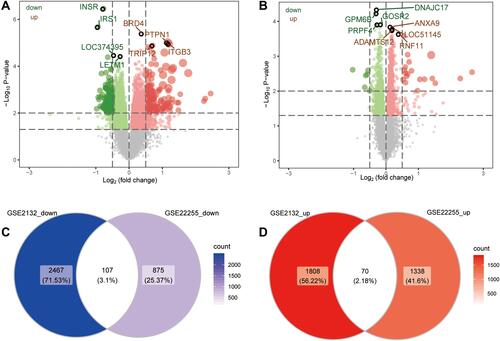
A total of 4452 mRNAs were differentially expressed between T2DM patients and controls (), of which 1878 were up-regulated and 2574 down-regulated in the disease. A total of 2390 mRNAs were differentially expressed between ischemic stroke patients and controls (), of which 1408 were up-regulated and 982 down-regulated in the condition. We identified 70 genes that were up-regulated in both T2DM and ischemic stroke, and 107 that were down-regulated in both conditions (). We defined these genes as potentially associated with T2DM and ischemic stroke.
Figure 3 Genes differentially expressed in T2DM and ischemic stroke. (A) Genes differentially expressed between T2DM patients and controls (red, up-regulated in the disease; blue, down-regulated). (B) Genes differentially expressed between ischemic stroke and controls (red, up-regulated in the disease; blue, down-regulated). (C) Genes differentially expressed in the same direction in both T2DM and ischemic stroke.
Functional Enrichment of Genes Associated with T2DM and Ischemic Stroke
To begin to elucidate biological processes and signaling pathways that might be associated with both T2DM and ischemic stroke, we performed enrichment analysis on the union genes which were common across coexpression modules in the two conditions, as well as on the genes differentially expressed in the two conditions. These genes were enriched for the following GO BPs: neutrophil activation, regulation of leukocyte activation, and T cell activation (). The genes were enriched for the following CCs: adherens junction, receptor complex, and membrane region (). They were enriched for the following MFs: protein heterodimerization, cell adhesion molecule binding, and cytokine receptor binding (). The genes were significantly enriched in the following KEGG signaling pathways: cytokine-cytokine receptor interaction, hematopoietic cell lineage, and Th17 cell differentiation ().
Figure 4 Gene Ontology functions and Kyoto Encyclopedia of Genes and Genomes (KEGG) signaling pathways involving genes differentially expressed in T2DM and ischemic stroke. (A) Main biological processes (BPs). (B) Main cellular components (CCs). (C) Molecular functions (MFs). (D) KEGG pathways. (E and F) GSEA to identify genes involved in activation or inhibition of KEGG pathways dysregulated in T2DM or ischemic stroke.
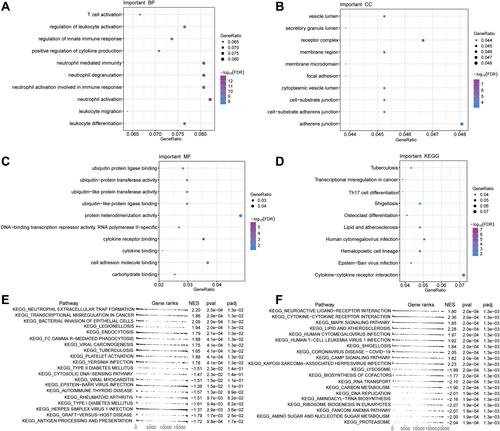
GSEA showed that genes differentially expressed in T2DM were involved in neutrophil extracellular trap formation and bacterial invasion of epithelial cells (). Genes differentially expressed in ischemic stroke were involved in cytokine-cytokine receptor interaction and MAPK signaling ().
Construction of an miRNA Regulatory Network
We identified 29 miRNAs that were differentially expressed between T2DM patients and controls and 4446 differentially expressed between ischemic stroke patients and controls. The two sets of miRNAs shared four miRNAs: hsa-miR-299-3p, hsa-miR-320a, hsa-miR-576-3p, and hsa-miR-665. These four miRNAs were predicted to target the mRNAs of 134 union genes. These genes were significantly enriched in 83 KEGG pathways, primarily apoptosis, FoxO signaling, and cytokine-cytokine receptor interaction (Figure S1).
The following seven genes in the GSE21321 and GSE22255 datasets were involved in the four signaling pathways mentioned above, and their expression levels were able to predict T2DM and ischemic stroke with an AUC > 0.75 (): UBE2N, TGFB3, EXOSC1, VIM, PTGS2, IL10RB, and CXCL3. In addition, the expression of the first four genes was altered in the same direction in both T2DM and ischemic stroke, so they were considered candidate markers ().
Figure 5 Regulation of mRNAs by miRNAs in T2DM and ischemic stroke. (A) Areas under the receiver operating characteristic curves (AUCs) describing the ability of mRNAs regulated by differentially expressed miRNAs from the GSE21321 and GSE22255 datasets to predict T2DM or ischemic stroke (red, mRNA up-regulated in the disease condition; blue, mRNA down-regulated). (B) Differences in key gene expression between controls and patients with T2DM (left) or ischemic stroke (right). ***P < 0.001. (C) Comprehensive network diagram of target genes regulated by miRNAs involved in KEGG signaling pathways.
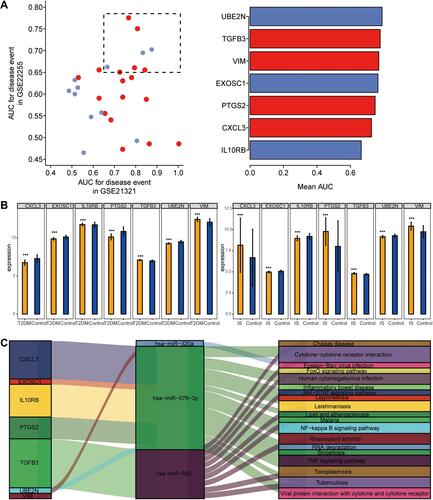
Based on these results, we generated a regulatory network of miRNAs in the two conditions (). In this network, miR-576-3p emerged as regulating the most target genes and affecting the most KEGG pathways.
Immune Cell Infiltration in T2DM and Ischemic Stroke
The enrichment analysis suggested that genes differentially expressed in T2DM and ischemic stroke were enriched in immune-related functions. Therefore, we compared levels of immune cells in T2DM patients () and ischemic stroke patients (). T2DM patients showed a higher proportion of resting mast cells, while ischemic stroke patients showed a higher proportion of monocytes.
Figure 6 Differences of immune cell infiltration between controls and patients with T2DM or ischemic stroke. (A) Bar plot of levels of infiltration by 22 types of immune cells in patients with T2DM. (B) Bar plot of levels of infiltration by 22 types of immune cells in patients with ischemic stroke. (C) Differences in immune cell infiltration between T2DM patients and controls (red, significant up-regulation in patients; blue, significant down-regulation). (D) Differences in immune cell infiltration between ischemic stroke patients and controls. The blue line represents significant down-regulation in patients. (E) Correlations between immune cell infiltration and hub gene expression in T2DM. *P < 0.05, **P < 0.01. (F) Correlations between immune cell infiltration and hub gene expression in ischemic stroke. *P < 0.05, **P < 0.01.
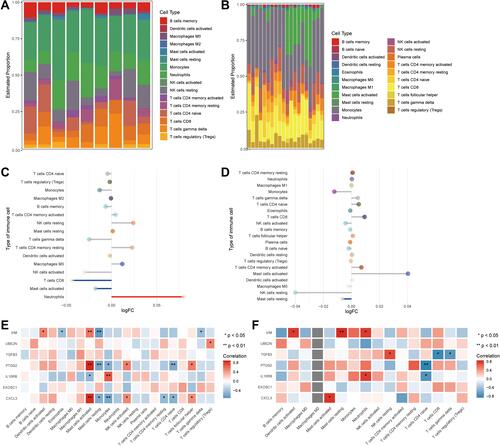
Compared to controls, T2DM patients showed significantly higher levels of neutrophils, lower levels of CD8+ T cells, and higher levels of activated mast cells (). Compared to controls, ischemic stroke patients showed significantly lower levels of resting mast cells ().
The strongest correlations between differentially expressed genes and immune cell infiltration were the positive correlation of TGS2 and CXCL3 with mast cell activation in T2DM (), and the positive correlation of VIM with levels of resting mast cells in ischemic stroke ().
Discussion
The rising prevalence of T2DM worldwide means rising risk of ischemic stroke. To enable screening of diabetic patients for stroke risk and to guide appropriate management and treatment strategies, we identified numerous candidate markers and their potential miRNA regulators in T2DM-associated ischemic stroke. The findings from this study will guide future experimental and bioinformatics analyses that may help treat and even prevent ischemic stroke among individuals with diabetes.
To maximize the probability of identifying genes associated with T2DM-related ischemic stroke, we searched for genes whose expression was up- or down-regulated in both conditions. Our enrichment analysis suggests that many immune responses may be altered in the two conditions. Weak immune activation is a risk factor for T2DM onset and for T2DM-associated ischemic stroke.Citation28 In ischemic stroke patients, an excessive number of neutrophils infiltrate ischemic brain tissue, which can lead to systemic inflammation and breakdown of the blood-brain barrier.Citation29 Acute ischemic stroke patients show an elevated ratio of neutrophils to lymphocytes and worse prognosis.Citation30 T cells are involved in the late phase of cerebral ischemia, and different T cell subtypes play different roles in ischemic stroke.Citation31 Our results link down-regulation of resting mast cells with greater risk of ischemic stroke. Animal models of ischemic stroke showed elevated numbers of activated mast cells, and activation of mast cells can increase angiogenesis by increasing proinflammatory monocyte responses,Citation32,Citation33 which in turn can promote the progression of diabetes and increase risk of ischemic stroke.Citation4,Citation34 Our work may help guide further research into how immune cell changes, immune responses, and inflammatory events interact to contribute to ischemic stroke in T2DM patients.
Several studies have suggested that in T2DM and ischemic stroke, miRNAs regulate the expression of target genes that mediate inflammatory responses, cell proliferation and apoptosis.Citation35–Citation37 We identified four miRNAs that may be associated with the occurrence of ischemic stroke among T2DM patients: hsa-miR-299-3p, hsa-miR-320a, hsa-miR-576-3p, and hsa-miR-665. The miR-299-3p target is associated with N-terminal pro brain natural peptide, levels of which can predict in-hospital mortality of patients with acute ischemic stroke.Citation38,Citation39 Levels of miR-320 can discriminate between diabetic and non-diabetic patients and are significantly reduced in stroke patients, especially those with good prognosis.Citation40,Citation41 The miR-576-3p has been reported to induce interferon production, and gene therapy to restore interferon production may improve prognosis after ischemic stroke.Citation42,Citation43 The miR-665 is down-regulated in T2DM patients and up-regulated in stroke patients.Citation44,Citation45 This suggests that the four miRNAs that we identified – especially miR-576-3p, with the most target genes – may be risk factors and markers for the development of ischemic stroke in T2DM patients.
Among the target genes of these miRNAs linked to T2DM and ischemic stroke, we identified several that showed particularly high AUCs for predicting disease: UBE2N, TGFB3, PTGS2, IL10RB, EXOSC1, CXCL3, and VIM. In particular, the differential expression of UBE2N, TGFB3, EXOSC1, and VIM was similar in T2DM and ischemic stroke, so we consider them candidate markers. UBE2N, an E2 ubiquitin-conjugating enzyme, is a key enzyme in Parkin-dependent mitophagy.Citation46 It plays a key role in synaptosomal accumulation of mutant huntingtin and is involved in multiple neurodegenerative disease processes.Citation47 Transforming growth factor-β (TGF-β) is a multifunctional inflammatory cytokine that is produced by a variety of inflammatory cells, including leukocytes and macrophages.Citation48 TGF-β and interleukin-10 (IL-10) drive damage to the blood-brain barrier in ischemic stroke and may have neuroinflammatory effects.Citation49 Expression of the IL10RB gene has been associated with the risk of ischemic stroke.Citation50 EXOSC1 has been associated with intracerebral hemorrhage,Citation51 though it appears never to have been linked to risk of ischemic stroke. CXCL3 is up-regulated in ischemic brain tissue and can predict stroke.Citation52 Up-regulation of VIM, which encodes vimentin, can drive injury after ischemic stroke by triggering reactive gliosis and scar formation.Citation53
The findings from our study require validation in additional, larger samples and in experimental studies. This work should begin to test the ability of miRNAs to regulate the expression of certain differentially expressed genes and thereby contribute to risk of ischemic stroke in T2DM.
Conclusion
This study explored molecular mechanisms that may be dysregulated in ischemic stroke associated with T2DM, and it identified potential diagnostic markers of such stroke. Potential candidate driver genes and regulatory miRNAs were identified, which will help guide further studies into this debilitating complication of T2DM as well as efforts to develop effective therapies.
Data Sharing Statement
The raw analyses from this study and codes can be obtained from the corresponding author upon reasonable request.
Disclosure
The authors declare that this research was conducted in the absence of any commercial or financial relationships that could be construed as a potential conflict of interest.
Additional information
Funding
References
- Li W, Valenzuela JP, Ward R, et al. Post-stroke neovascularization and functional outcomes differ in diabetes depending on severity of injury and sex: potential link to hemorrhagic transformation. Exp Neurol. 2019;311:106–114. doi:10.1016/j.expneurol.2018.09.013
- Ogurtsova K, da Rocha Fernandes JD, Huang Y, et al. IDF diabetes atlas: global estimates for the prevalence of diabetes for 2015 and 2040. Diabetes Res Clin Pract. 2017;128:40–50. doi:10.1016/j.diabres.2017.03.024
- Mizrahi EH, Waitzman A, Blumstein T, Arad M, Adunsky A. Diabetes mellitus predicts cognitive impairment in patients with ischemic stroke. Am J Alzheimers Dis Other Demen. 2010;25(4):362–366. doi:10.1177/1533317510365343
- Hong P, Gu RN, Li FX, et al. NLRP3 inflammasome as a potential treatment in ischemic stroke concomitant with diabetes. J Neuroinflammation. 2019;16(1):121. doi:10.1186/s12974-019-1498-0
- Benjamin EJ, Virani SS, Callaway CW, et al. Heart disease and stroke statistics-2018 update: a report from the American heart association. Circulation. 2018;137(12):e67–e492.
- Almdal T, Scharling H, Jensen JS, Vestergaard H. The independent effect of type 2 diabetes mellitus on ischemic heart disease, stroke, and death: a population-based study of 13,000 men and women with 20 years of follow-up. Arch Intern Med. 2004;164(13):1422–1426. doi:10.1001/archinte.164.13.1422
- Rehni AK, Liu A, Perez-Pinzon MA, Dave KR. Diabetic aggravation of stroke and animal models. Exp Neurol. 2017;292:63–79.
- Huang Q, Deng G, Wei R, Wang Q, Zou D, Wei J. Comprehensive identification of key genes involved in development of diabetes mellitus-related atherogenesis using weighted gene correlation network analysis. Front Cardiovasc Med. 2020;7:580573. doi:10.3389/fcvm.2020.580573
- Venkat P, Chopp M, Chen J. Cell-based and exosome therapy in diabetic stroke. Stem Cells Transl Med. 2018;7(6):451–455. doi:10.1002/sctm.18-0014
- Cai F, Wu F, Cao J, Chen X. MicroRNA-146b-3p regulates the development and progression of cerebral infarction with diabetes through RAF1/P38MAPK/COX-2 signaling pathway. Am J Transl Res. 2018;10(2):618–628.
- Deng D, Qu Y, Sun L, et al. Fuyuan Xingnao decoction promotes angiogenesis through the Rab1/AT1R pathway in diabetes mellitus complicated with cerebral infarction. Front Pharmacol. 2021;12:616165. doi:10.3389/fphar.2021.616165
- Phipps MS, Jastreboff AM, Furie K, Kernan WN. The diagnosis and management of cerebrovascular disease in diabetes. Curr Diab Rep. 2012;12(3):314–323. doi:10.1007/s11892-012-0271-x
- Zhao W, Katzmarzyk PT, Horswell R, et al. Blood pressure and stroke risk among diabetic patients. J Clin Endocrinol Metab. 2013;98(9):3653–3662. doi:10.1210/jc.2013-1757
- Shi R, Zhang T, Sun H, Hu F. Establishment of clinical prediction model based on the study of risk factors of stroke in patients with type 2 diabetes mellitus. Front Endocrinol. 2020;11:559. doi:10.3389/fendo.2020.00559
- Hu K, Jiang M, Zhou Q, et al. Association of diabetic retinopathy with stroke: a systematic review and meta-analysis. Front Neurol. 2021;12:626996. doi:10.3389/fneur.2021.626996
- Yang T, Fan K, Cao Y, Yan J, Han Z. Stroke type, etiology, clinical features and prognosis of diabetic patients in Southern China. Clin Appl Thromb Hemost. 2020;26:1076029620973090. doi:10.1177/1076029620973090
- Bielska A, Niemira M, Kretowski A. Recent highlights of research on miRNAs as early potential biomarkers for cardiovascular complications of type 2 diabetes mellitus. Int J Mol Sci. 2021;22(6):3153. doi:10.3390/ijms22063153
- Ghafouri-Fard S, Shoorei H, Taheri M. Non-coding RNAs participate in the ischemia-reperfusion injury. Biomed Pharmacother. 2020;129:110419. doi:10.1016/j.biopha.2020.110419
- Zou D, Liu C, Zhang Q, et al. Association between polymorphisms in microRNAs and ischemic stroke in an Asian population: evidence based on 6,083 cases and 7,248 controls. Clin Interv Aging. 2018;13:1709–1726. doi:10.2147/CIA.S174000
- Cai G, Cai G, Zhou H, et al. Mesenchymal stem cell-derived exosome miR-542-3p suppresses inflammation and prevents cerebral infarction. Stem Cell Res Ther. 2021;12(1):2. doi:10.1186/s13287-020-02030-w
- Langfelder P, Horvath S. WGCNA: an R package for weighted correlation network analysis. BMC Bioinform. 2008;9:559. doi:10.1186/1471-2105-9-559
- Ritchie ME, Phipson B, Wu D, et al. limma powers differential expression analyses for RNA-sequencing and microarray studies. Nucleic Acids Res. 2015;43(7):e47. doi:10.1093/nar/gkv007
- Love MI, Huber W, Anders S. Moderated estimation of fold change and dispersion for RNA-seq data with DESeq2. Genome Biol. 2014;15(12):550. doi:10.1186/s13059-014-0550-8
- Yu G, Wang LG, Han Y, He QY. clusterProfiler: an R package for comparing biological themes among gene clusters. OMICS. 2012;16(5):284–287. doi:10.1089/omi.2011.0118
- Ito K, Murphy D. Application of ggplot2 to pharmacometric graphics. CPT Pharmacometrics Syst Pharmacol. 2013;2:e79. doi:10.1038/psp.2013.56
- Sergushichev AA. An algorithm for fast preranked gene set enrichment analysis using cumulative statistic calculation. BioRxiv. 2016;060012.
- Robin X, Turck N, Hainard A, et al. pROC: an open-source package for R and S+ to analyze and compare ROC curves. BMC Bioinform. 2011;12:77. doi:10.1186/1471-2105-12-77
- López-de-andrés A, Jimenez-Garcia R, Hernández-Barrera V, et al. Sex-related disparities in the incidence and outcomes of ischemic stroke among type 2 diabetes patients. A matched-pair analysis using the Spanish national hospital discharge database for years 2016–2018. Int J Environ Res Public Health. 2021;18(7):3659. doi:10.3390/ijerph18073659
- Weisenburger-Lile D, Dong Y, Yger M, et al. Harmful neutrophil subsets in patients with ischemic stroke: association with disease severity. Neurol Neuroimmunol Neuroinflamm. 2019;6(4):e571. doi:10.1212/NXI.0000000000000571
- Lin SK, Chen PY, Chen GC, et al. Association of a high neutrophil-to-lymphocyte ratio with hyperdense artery sign and unfavorable short-term outcomes in patients with acute ischemic stroke. J Inflamm Res. 2021;14:313–324. doi:10.2147/JIR.S293825
- Maida CD, Norrito RL, Daidone M, Tuttolomondo A, Pinto A. Neuroinflammatory mechanisms in ischemic stroke: focus on cardioembolic stroke, background, and therapeutic approaches. Int J Mol Sci. 2020;21(18):6454. doi:10.3390/ijms21186454
- Blasco MP, Chauhan A, Honarpisheh P, et al. Age-dependent involvement of gut mast cells and histamine in post-stroke inflammation. J Neuroinflammation. 2020;17(1):160. doi:10.1186/s12974-020-01833-1
- Bot I, Velden DV, Bouwman M, et al. Local mast cell activation promotes neovascularization. Cells. 2020;9:3. doi:10.3390/cells9030701
- Carandina A, Lazzeri G, Villa D, et al. Targeting the autonomic nervous system for risk stratification, outcome prediction and neuromodulation in ischemic stroke. Int J Mol Sci. 2021;22(5):2357. doi:10.3390/ijms22052357
- De Rosa S, Arcidiacono B, Chiefari E, Brunetti A, Indolfi C, Foti DP. Type 2 diabetes mellitus and cardiovascular disease: genetic and epigenetic links. Front Endocrinol. 2018;9:2. doi:10.3389/fendo.2018.00002
- Eyileten C, Wicik Z, De Rosa S, et al. MicroRNAs as diagnostic and prognostic biomarkers in ischemic stroke-a comprehensive review and bioinformatic analysis. Cells. 2018;7:12. doi:10.3390/cells7120249
- Bulygin KV, Beeraka NM, Saitgareeva AR, et al. Can miRNAs be considered as diagnostic and therapeutic molecules in ischemic stroke pathogenesis?-Current status. Int J Mol Sci. 2020;21(18):6728. doi:10.3390/ijms21186728
- Cakmak HA, Coskunpinar E, Ikitimur B, et al. The prognostic value of circulating microRNAs in heart failure: preliminary results from a genome-wide expression study. J Cardiovasc Med. 2015;16(6):431–437. doi:10.2459/JCM.0000000000000233
- Naveen V, Vengamma B, Mohan A, Vanajakshamma V. N-terminal pro-brain natriuretic peptide levels and short term prognosis in acute ischemic stroke. Ann Indian Acad Neurol. 2015;18(4):435–440. doi:10.4103/0972-2327.165478
- Benameur T, Osman A, Parray A, Ait Hssain A, Munusamy S, Agouni A. Molecular mechanisms underpinning microparticle-mediated cellular injury in cardiovascular complications associated with diabetes. Oxid Med Cell Longev. 2019;2019:6475187. doi:10.1155/2019/6475187
- Tan KS, Armugam A, Sepramaniam S, et al. Expression profile of MicroRNAs in young stroke patients. PLoS One. 2009;4(11):e7689. doi:10.1371/journal.pone.0007689
- Meydan C, Madrer N, Soreq H. The Neat Dance of COVID-19: NEAT1, DANCR, and co-modulated cholinergic RNAs link to inflammation. Front Immunol. 2020;11:590870. doi:10.3389/fimmu.2020.590870
- Wanve M, Kaur H, Sarmah D, et al. Therapeutic spectrum of interferon-beta in ischemic stroke. J Neurosci Res. 2019;97(2):116–127. doi:10.1002/jnr.24333
- Yang ZM, Chen LH, Hong M, et al. Serum microRNA profiling and bioinformatics analysis of patients with type 2 diabetes mellitus in a Chinese population. Mol Med Rep. 2017;15(4):2143–2153. doi:10.3892/mmr.2017.6239
- Jamaluddin MS, Weakley SM, Zhang L, et al. miRNAs: roles and clinical applications in vascular disease. Expert Rev Mol Diagn. 2011;11(1):79–89. doi:10.1586/erm.10.103
- Geisler S, Vollmer S, Golombek S, Kahle PJ. The ubiquitin-conjugating enzymes UBE2N, UBE2L3 and UBE2D2/3 are essential for Parkin-dependent mitophagy. J Cell Sci. 2014;127(Pt 15):3280–3293. doi:10.1242/jcs.146035
- Yin P, Tu Z, Yin A, et al. Aged monkey brains reveal the role of ubiquitin-conjugating enzyme UBE2N in the synaptosomal accumulation of mutant huntingtin. Hum Mol Genet. 2015;24(5):1350–1362. doi:10.1093/hmg/ddu544
- Rath D, Chatterjee M, Muller I, et al. Platelet expression of transforming growth factor beta 1 is enhanced and associated with cardiovascular prognosis in patients with acute coronary syndrome. Atherosclerosis. 2014;237(2):754–759. doi:10.1016/j.atherosclerosis.2014.10.021
- Yang C, Hawkins KE, Dore S, Candelario-Jalil E. Neuroinflammatory mechanisms of blood-brain barrier damage in ischemic stroke. Am J Physiol Cell Physiol. 2019;316(2):C135–C153. doi:10.1152/ajpcell.00136.2018
- Park HK, Kim DH, Yun DH, Ban JY. Association between IL10, IL10RA, and IL10RB SNPs and ischemic stroke with hypertension in Korean population. Mol Biol Rep. 2013;40(2):1785–1790. doi:10.1007/s11033-012-2232-5
- Dykstra-Aiello C, Jickling GC, Ander BP, et al. Intracerebral hemorrhage and ischemic stroke of different etiologies have distinct alternatively spliced mRNA profiles in the blood: a pilot RNA-seq study. Transl Stroke Res. 2015;6(4):284–289. doi:10.1007/s12975-015-0407-9
- Martha SR, Cheng Q, Fraser JF, et al. Expression of cytokines and chemokines as predictors of stroke outcomes in acute ischemic stroke. Front Neurol. 2019;10:1391. doi:10.3389/fneur.2019.01391
- Jayaraj RL, Azimullah S, Beiram R, Jalal FY, Rosenberg GA. Neuroinflammation: friend and foe for ischemic stroke. J Neuroinflammation. 2019;16(1):142.