
Abstract
Background
Gastric cancer (GC) is the third most frequent malignant tumour in the Chinese population, let alone the whole world. Recently, most prognostic models have only focused on the levels of several genes, miRNAs, lncRNAs, gene mutations, or DNA methylation; however, the activation status of biological pathways is more stable and can reflect the comprehensive inner conditions of tumours.
Methods
We collected samples from the Cancer Genome Atlas Stomach Adenocarcinoma (TCGA-STAD) cohort and GSE62254 cohort, with a total of 594 patients. We employed GSEA to first compare the diverse activated signalling pathways between dead GC patients and living patients. The least absolute shrinkage and selection operator (LASSO) regression analysis was subsequently performed by the “glmnet” package to generate a prognostic signature.
Results
We extracted a total of 218 genes from the KEGG Focal Adhesion and KEGG ECM Receptor Interaction pathways, which showed significant activation in dead GC patients in two enrolled cohorts, for subsequent LASSO analysis. In the TCGA-STAD cohort, patients in the high-risk group faced a significantly poorer prognosis than those in the low-risk group (P < 0.001, HR: 4.62, 95% CI: 3.447–6.183), with an AUC of 0.694. In the GSE62254 cohort, the HR value was 4.94 (95% CI: 3.413–7.165), and the AUC value was as high as 0.834. A high-risk score and poor prognosis correlated with infiltrated dendritic cells, and the receptor of IFN-α was also positively linked with the risk score, as well as poor prognosis. GC patients with high-risk scores were more likely to respond to CTLA4 treatment but not PD1 treatment.
Conclusion
Taken together, we established and verified an extracellular matrix prognostic model of gastric cancer patients. The model can be used to evaluate the risk of death of GC patients, as well as the response to anti-CTLA4 immunotherapy.
Introduction
In summary, gastric cancer (GC) is the 6th leading cause of cancer morbidity and the 5th leading cause of cancer-specific mortality.Citation1 Additionally, GC is the third most frequent malignant tumour in Chinese men and fourth most frequent in Chinese women in recent decades.Citation2 The clinical symptoms of GC are frequently confused with benign gastric disease, including indigestion, heartburn, loss of appetite, and bloating of the stomach after meals; therefore, more than 60% of GC patients are diagnosed only at an advanced tumour stage, which limits clinical treatment.Citation3 Clinical treatment with surgery, radiotherapy, or chemotherapy cannot provide satisfactory effectiveness for GC patients, and the 5-year survival rate of GC is less than 30% due to advanced metastatic tumours or resistance to radio-/chemotherapy.Citation4,Citation5 Moreover, GC is a heterogeneous cancer, and several genes and biological pathways alter the process of tumorigenesis. Therefore, it is necessary to construct a stable biological pathway-based prediction model to lead to diagnosis and prognosis prediction for clinical work.
Several studies have already reported the activation of diverse biological processes via experimental results or bioinformatic analysis. Yeon et alCitation6 reported that the miR-181b-5p/CAGE/S1PR1 axis can alter autophagic flux, resulting in enhanced sensitivity to anticancer drugs. Wang et alCitation7 revealed that cisplatin resistance was transmitted by the exosomal lncRNA HOTTIP, which targets the miR-218/HMGA1 axis in cisplatin-sensitive cells. Other studies also illustrated a prognostic model for GC patients. Wang et alCitation8 revealed that early B cell factors are prognostic biomarkers for GC patients, and 5-fluorouracil, methotrexate, and vorinostat are suitable to inhibit the function of early B cell factors and suppress the process of tumorigenesis. Li et alCitation9 developed a prognostic model, IDOScore, based on the expression levels of TAP2, SERPINB5, LTBP1 and LAMC1. IDOScore inversely reflects the response to immunotherapy in GC patients and acts as a harmful prognostic factor.
Recently, most prognostic models have only focused on the levels of several genes, miRNAs, lncRNAs, gene mutations, or DNA methylation; however, the activation status of biological pathways is more stable and can reflect the comprehensive inner condition of tumours. In the current study, we first identified the most highly activated pathways in two datasets of GC patients and further constructed a prognostic model based on the hub genes in the pathways to establish a stable prognostic model for GC patients.
Methods
Summary of Patients
We collected samples from the Cancer Genome Atlas Stomach Adenocarcinoma cohort (TCGA-STAD cohort, https://www.cancer.gov) and GSE62254 cohort (Gene Expression Omnibus, http://www.ncbi.nlm.nih.gov/geo/). The mRNA expression of the TCGA-STAD cohort was downloaded from the Genomic Data Commons (GDC) via the “TCGAbiolinks” package. The clinical information, especially the overall survival (OS) time and status, was also obtained through the “TCGAbiolinks” package. For the GSE62254 cohort, we downloaded the original expression data and annotated the gene symbols via the corresponding GPL570 platform. After the filtration of patients with the available data for both gene expression and clinical information, a total of 294 GC patients from the TCGA-STAD cohort and 300 GC patients from GSE62254 were enrolled for subsequent analysis. The immunohistochemistry slide was obtained from the Human Protein Atlas (https://www.proteinatlas.org/).
GSEA
Gene set enrichment analysis (GSEA) is a computational method that determines whether a set of genes shows statistically significant differences between two groups. We employed GSEA to first compare the diverse activated signalling pathways between dead GC patients and living patients in the TCGA-STAD cohort and GSE62254 cohort. The background file of molecular signature gene sets was downloaded from MSigDB, C2, and KEGG. Then, the pathways that were both activated or inactivated in the two cohorts were considered for subsequent calculation.
Removal of Batch Effects
When obtaining the gene expression profile, batch effects will occur due to differences in nonbiological factors. To make the gene expression profiles of the two cohorts more similar, we used the ComBat method described in the “sva” package to remove the batch effects between these two cohorts.
Identification of the GC Prognostic Index
A total of 218 genes from the ECM receptor interaction pathway and focal adhesion pathway were extracted for the identification of the GC prognostic index (GCPI). The least absolute shrinkage and selection operator (LASSO) regression analysis was subsequently performed by the “glmnet” package to generate a statistical model with high prediction accuracy and interpretability. The LASSO analysis selected genes, and corresponding coefficients were used to calculate the risk score via the following formula:
where is the coefficient of the gene and
is the expression value of the corresponding gene.
Search for Potential Therapeutic Strategies
We obtained the gene expression profile of 47 melanoma patients who received anti-cytotoxic T lymphocyte-associated protein 4 (anti-CTLA4) or anti-programmed death-1 (anti-PD1) and collected the response information. Meanwhile, the gene expression profile and clinical response information from another cohort were also recorded, comprising 248 bladder cancer patients.Citation10–Citation13 Submap analysis via the GenePattern platform was applied to compare the gene expression distribution between the defined subgroups in the current study and the responders to immunotherapy to reveal the patients who might respond to immunotherapy.
Statistics
All statistical analyses were conducted by R (Version: 4.0.2) using a two-sample Mann–Whitney test for continuous data, which is represented as the mean ± standard deviation (SD), and Fisher’s exact test for categorical data. A two-tailed P value less than 0.05 was considered statistically significant. For survival analyses, a Kaplan–Meier curve was generated for survival rates of patients with difference detection by the Log rank test. Cox regression was used to calculate the hazard ratios (HRs) and 95% confidence intervals (CIs) for OS. In addition, the prediction efficiency of GCPI for OS was examined using ROC analyses with the R package “pROC”.Citation14 The forest displayed the prognostic value of GCPI, and other features were assessed by the function ggforest in the R package “surviminer”. The heatmap displayed the selected genes and clinical features performed by the R package “pheatmap”. We reproduced the risk subtypes with the minimal gene set in the training TCGA-STAD cohort by the random forest (RF) algorithm via “varSelRF” R package. The correlation between two continuous data points was evaluated by Pearson correlation analysis.
Results
Activation of Extracellular Matrix-Associated Pathways in GC Patients
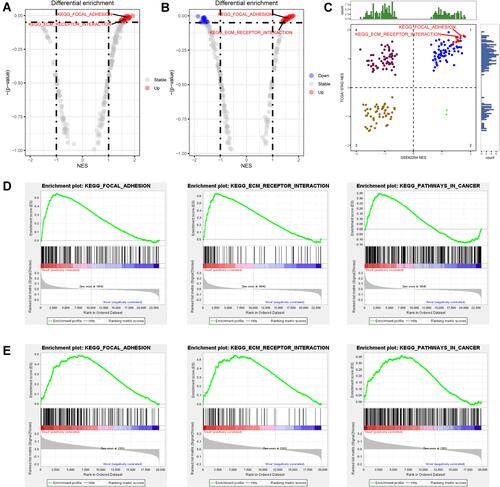
We first revealed the activated signalling pathways in dead GC patients compared with living GC patients in both the GSE62254 and TCGA-STAD datasets. With the GSEA and a nominal P value less than 0.05, we obtained 24 pathways that were significantly activated in the GSE62254 dataset (), as well as 21 pathways in the TCGA-STAD dataset (). The detailed count number, normalized enrichment score (NES) and nominal P value are displayed in . After merging the coactivated pathways in both the GSE62254 and TCGA-STAD cohorts, we selected the KEGG Focal Adhesion and KEGG ECM Receptor Interaction pathways for subsequent analysis (). The detailed display of three key pathways in these two cohorts is given in and .
Table 1 Activated Pathways in Patients That Died from Gastric Cancer
Figure 1 Identify the most functional signalling pathways in GC. (A) The different activated pathways of dead and living GC patients in the GSE62254 cohort. (B) The different activated pathways of dead and living GC patients in TCGA-STAD cohort. (C) The distribution of pathways activated in both cohorts in four quadrants. (D) The GSEA plot of three selected pathways in the GSE62254 cohort. (E) The GSEA plot of three selected pathways in the TCGA-STAD cohort.
Construction of the Prognostic Model for GC Patients
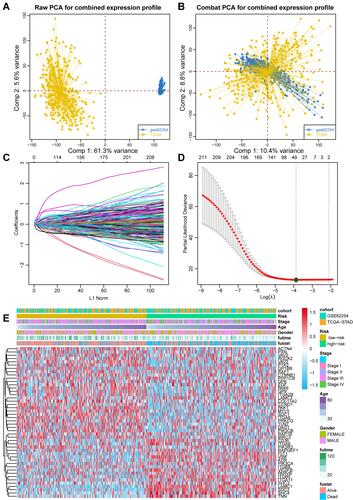
We obtained the gene symbols of Focal Adhesion and ECM Receptor Interaction pathways from KEGG. After removing the duplicated genes, a total of 218 genes were enrolled for the LASSO analysis. At the beginning of the analysis, we removed the batch effect to make the selection of genes available in both cohorts. As shown via the principal component analysis (PCA) plot, we observed gaps between the GSE62254 and TCGA-STAD cohorts before removal () and after removal (). The minimum lambda value of 0.02076 was defined as the cut-off point to minimize the mean cross-validated error (), and a total of 46 genes were identified (). The expression distribution of the 46 genes and clinical features in both the GSE62254 and TCGA-STAD cohorts are illustrated in . The 46 genes automatically separated into two groups, oncogenes and tumour suppressors. Regarding the clinical features, it was also clear that more dead patients in the high-risk group accounted for 54.5% (P < 0.001), and the average OS time for low-risk patients was 40.00 ± 34.44 months but sharply decreased to only 23.52 ± 27.01 months among patients with high-risk scores (P < 0.001). The distribution of sex and age showed no difference between these two subgroups, while more patients with advanced tumour stage belonged to the high-risk group, such as Stage IV (23.2% vs 13.1, P value for Chi square test: 0.004, ).
Table 2 Summary of the Clinical Features in Low-Risk and High-Risk Groups
Figure 2 Constructing the prognostic index for GC patients. (A) PCA plot showing the batch effect between TCGA-STAD and GSE62254 cohorts. (B) PCA plot showing the distribution of two cohorts after removing the batch effect. (C) The optimal tuning parameter (Lambda) in the LASSO analysis selected with the 5-fold cross-validation and one standard error rule. (D) LASSO coefficient profiles of the 211 genes. (E) Heatmap showing the expression distribution of LASSO analysis selected genes and corresponding clinical features among two cohorts.
The High-Risk Group Demonstrated a Significantly Lower OS Time
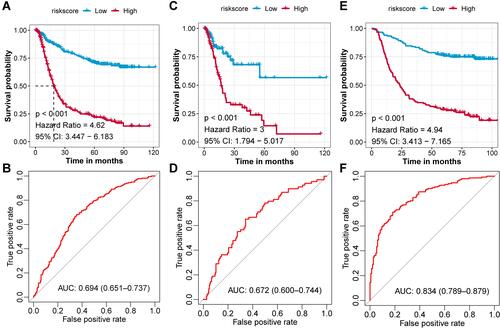
To evaluate the prognostic value of these 46 genes and the LASSO analysis integrated risk score, we employed the K-M plot, Cox regression test and ROC curve. The prognostic value of each single gene is shown in Figure S1. The integrative risk score had wonderful prognostic value, and patients were separated into high-risk and low-risk groups based on the median value of the risk score. Then, we observed that patients in the high-risk group faced a significantly poorer prognosis than those in the low-risk group (P < 0.001, HR: 4.62, 95% CI: 3.447–6.183, ), and the AUC value reflected the moderate prognostic value of the score (AUC: 0.694, 95% CI: 0.651–0.737, ). We also evaluated the prognostic value in different clinical subgroups. It is promising that the risk score can reveal the high-risk patients among all patients in any of the clinical subgroups, including age ≤ 65 (P < 0.001), age > 65 (P < 0.001), male sex (P < 0.001), female sex (P < 0.001), and stage I (P = 0.002)/II (P < 0.001)/III (P < 0.001)/IV (P < 0.001, Figure S2). Furthermore, we evaluated the prognostic value of the risk score in the TCGA-STAD and GSE62254 cohorts. Patients in the high-risk group of the TCGA-STAD cohort had an approximately 3-fold higher risk of death than the low-risk group, with a 95% CI of 1.794 to 5.017 (P < 0.001, ), and an AUC value of 0.672, with a 95% CI of 0.600 to 0.744 (). For the GSE62254 cohort, the prognostic function was more effective, the HR value was 4.94 (95% CI: 3.413–7.165, ), and the AUC value was as high as 0.834 (95% CI: 0.789–0.879, ).
Figure 3 Prognostic value of the GCPI in combined and separated GC cohorts. (A) K-M plot showing the divergent overall survival in the dichotomized risk groups in the combined cohort. (B) ROC curve showing the prognostic value of GCPI in the combined cohort. (C) K-M plot showing the divergent overall survival in the dichotomized risk groups in the TCGA-STAD cohort. (D) ROC curve showing the prognostic value of GCPI in the TCGA-STAD cohort. (E) K-M plot showing the divergent overall survival in the dichotomized risk groups in the GSE62254 cohort. (F) ROC curve showing the prognostic value of GCPI in the GSE62254 cohort.
Risk Score is an Independent Prognostic Factor for GC Prognosis
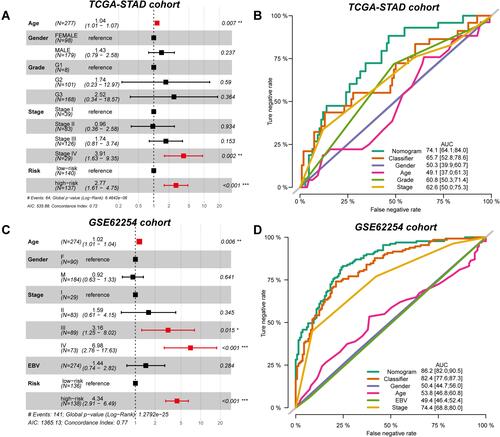
To further investigate whether the prognostic value of the risk score might be impacted by other clinical features, we performed multi-Cox regression analysis and proposed the combined nomogram of risk score and clinical features to elevate the performance. For the TCGA-STAD cohort, risk score (P < 0.001, HR: 2.77, 95% CI: 1.61–4.75), tumour stage IV (P = 0.002, HR: 3.91, 95% CI: 1.63–9.45), and age (P = 0.007, HR: 1.04, 95% CI: 1.01–1.07) were independent prognostic factors, as obtained from the results of multi-Cox regression analysis (). After combining the clinical features, the prognostic value of the single risk score increased from 0.657 to 0.741 (). Similar results were also observed in the GSE62254 cohort. The independent prognostic factors included age (P = 0.006, HR: 1.02, 95% CI: 1.01–1.04), stage III (P = 0.015, HR: 3.16, 95% CI: 1.25–8.02), stage IV (P < 0.001, HR: 6.98, 95% CI: 2.76–17.63) and risk score (P < 0.001, HR: 4.34, 95% CI: 2.91–6.49) (). The combined nomogram elevated the prognostic AUC value from 0.824 to 0.862 ().
Figure 4 Independent prognostic value of GCPI to patients. (A) Forest plot showing the independent prognostic value of GCPI after adjusting for clinicopathological factors in the TCGA-STAD cohort. (B) ROC curve showing the single and integrative prognostic value of features in the TCGA-STAD cohort. (C) Forest plot showing the independent prognostic value of GCPI after adjusting for clinicopathological factors in the GSE62254 cohort. (D) ROC curve showing the single and integrative prognostic value of features in the GSE62254 cohort. *P < 0.05; **P < 0.01; ***P < 0.001; ****P < 0.0001.
Increased Risk Score Positively Associated with the Infiltration of Dendritic Cells
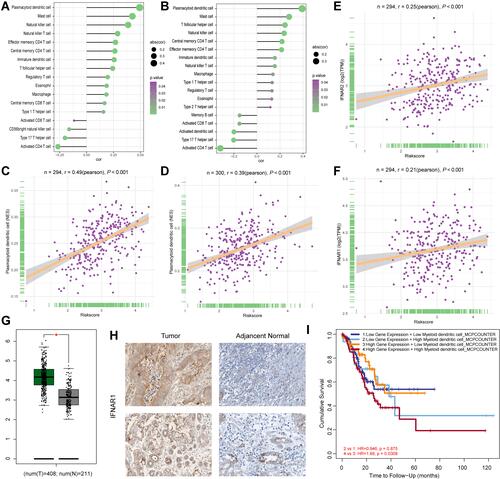
Several studies have already reported the association between poor prognosis of GC patients and immune infiltration. We calculated the correlation between the risk score and infiltration of 28 immunocytes in both the TCGA-STAD () and GSE62254 () cohorts. Most of the immunocytes were positively associated with an increased risk score, and there is no doubt that macrophages were included. We focused on the infiltration of dendritic cells, which displayed the highest correlation in both cohorts (TCGA-STAD: P < 0.001, R = 0.49, ; GSE62254: P < 0.001, R = 0.39, ). We also revealed that the activation of extracellular matrix pathways was positively associated with the infiltration of dendritic cells (Figure S3). In the tumour microenvironment, IFN-α is mostly secreted by dendritic cells, and the IFNAR1 and IFNAR2 genes encode the protein subunit of the receptor of IFN-α.Citation15,Citation16 Therefore, we also assessed the association of IFNAR1 and IFNAR2 with the risk score in the TCGA-STAD cohort and obtained positive results (IFNAR2: P < 0.001, R = 0.25, ; IFNAR1: P < 0.001, R = 0.21, ), which means that the 46 tumour genes promoted the tumorigenesis of GC via the infiltration of dendritic cells and the IFN-α axis. Moreover, we observed that both the mRNA level () and protein level () of IFNAR1 increased in GC tumour tissues compared with normal tissues, indicating the participation of IFNAR1 in GC tumorigenesis. We also found that patients with a high level of IFNAR1 and high infiltration of dendritic cells had the worst clinical outcome ().
Figure 5 Dendritic cells promote the progression of GC patients. (A) The correlations between immunocytes and GCPI in the TCGA-STAD cohort. (B) The correlations between immunocytes and GCPI in the GSE62254 cohort. (C) The infiltration of plasmacytoid dendritic cells positively associated with GCPI in the TCGA-STAD cohort. (D) The infiltration of plasmacytoid dendritic cells positively associated with GCPI in the GSE62254 cohort. (E) GCPI positively associated with the increased expression of IFNAR2. (F) GCPI positively associated with the increased expression of IFNAR1. (G) mRNA expression of IFNAR1 was significantly higher in tumour tissue than adjacent normal tissue. (H) Protein level of IFNAR1 was significantly higher in tumour tissue than normal tissue. (I) Patients with high expression of IFNAR1 and high infiltration of dendritic cells had the worst prognosis. *P < 0.05.
GC Patients with High-Risk Scores are More Effective at Anti-CTLA4 Therapy
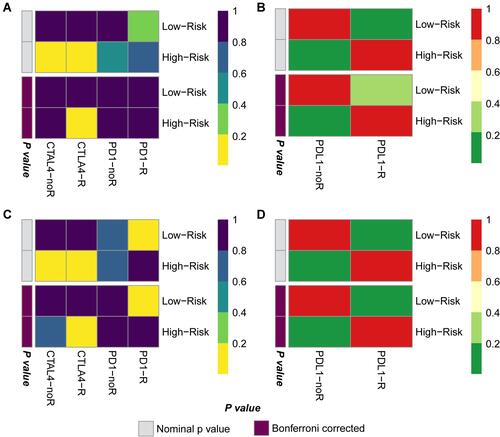
Subsequently, we performed Submap analysis to reveal the response to potential immunotherapy in GC patient subgroups, which is widely used in several published studies. The gene expression profiles of 47 melanoma patients and 248 bladder cancer patients were downloaded as the background comparison, and then we compared the expression of key component genes in the GC patient subgroups with the gene expression of responders and nonresponders. In the TCGA-STAD cohort, we found that compared with melanoma patients, melanoma patients were more likely to respond to CTLA4 treatment but not PD1 treatment () and showed no response to PD-L1 treatment (). Submap analysis in the GSE62254 cohort showed similar results; GC patients seemed to benefit more from anti-CTLA4 therapy but not PD1 or PD-L1 therapy ( and ).
Figure 6 CTLA4 immunotherapy is a potential treatment for GC patients with high GCPI. (A) Submap results showing the potential response to CTLA4 treatment of the TCGA-STAD cohort compared with the melanoma cohort. (B) Submap results showing no response to PDL1 treatment of the TCGA-STAD cohort compared with the IMvigor210 cohort. (C) Submap results showing the potential response to CTLA4 treatment of the GSE62254 cohort compared with the melanoma cohort. (D) Submap results showing no response to PDL1 treatment of the GSE62254 cohort compared with the IMvigor210 cohort.
Newly Defined Signature Can Identify the High-Risk Patients in Proposed GC Molecular Subtypes
We compared the high- and low-risk groups with the pre-reported four GC molecular subtypes generated by the Cancer Genome Atlas Research Network. We observed that low-risk group contained more patients belonged to EBV and MSI group, while high-risk group contained more CIN and GS patients (P < 0.001, and ). After reviewed the prognosis results of four TCGA molecular types, we found that the EBV, CIN, MSI and GS types did not reveal the diverse prognosis of GC patients. But the current study provides new sight for the prognosis of different molecular types. We found that although patients in the low-risk group contained less CIN and GS molecular subtype, but these two subtypes’ patients met the poor prognosis (). As to high-risk group, patients with the MSI features met the poor prognosis (). From the cross classification of risk score and TCGA-STAD molecular subtypes, we provided the new sight that the risk score can help to identify the patients with terrible prognosis in the inner of each molecular subtype.
Figure 7 Compared the risk groups with proposed GC molecular subtypes and reproduced the risk groups with minimal genes. Comparing the distribution of GC patients in risk groups and proposed GC molecular subtypes by Sanky plot (A) and Stacking histogram (B). (C) K-M plot showing the diverse clinical prognosis of GC patients in eight subgroups. (D) Comparison of subtypes reproduced with 11 genes and defined by LASSO analysis in TCGA-STAD cohort. (E) Comparison of subtypes reproduced with 11 genes and defined by LASSO analysis in GSE62254 cohort. (F) ROC curve showing the accuracy of the predicting risk groups by 11 genes.
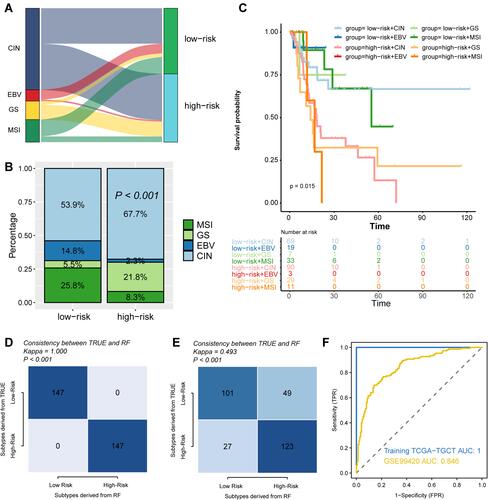
We also used the RF method to select the minimal number of genes to reflect the diverse risk groups generated in our study. Finally, a total of 11 genes remained, including EGF, FLT1, GP9, ITGA2B, LAMC1, PAK6, SDC2, SHC4, TNN, VEGFB, VWF. We revealed the 11 genes in the TCGA-STAD training cohort, and further validated in the GSE62254 cohort, with an AUC value of 0.846, which reflected the stable value to identify patients with high- or low-risk (–).
Discussion
The advanced tumour stage at first diagnosis and high resistance rate to radio-/chemotherapy result in a huge health burden of GC around the world. In the current study, we aimed to construct a stable prognostic model to identify GC patients with a high-risk of cancer-specific death to guide early intervention and precision treatment for GC patients.
In the GSE62254 and TCGA-STAD cohorts, we revealed that extracellular matrix-associated pathways were significantly activated in dead GC patients. The genes encoding ECM proteins and ECM-associated proteins are collectively known as the matrisome, which encompasses two main groups of genes: the core matrisome genes encoding collagens, glycoproteins, and proteoglycans, or matrisome-associated genes encoding ECM-affiliated proteins, ECM regulators, and secreted factors that are involved in the regulation or modulation of ECM functions.Citation17,Citation18 Several studies have already reported the function of the extracellular matrix in GC carcinogenesis. Han et alCitation19 revealed that the inhibitory function of sulforaphane is achieved by boosting the maturation of miR-29a-3p to further downregulate two extracellular matrix components, COL3A1 and COL5A1. Liu et alCitation20 found that high or low expression of ECM-related genes revealed different levels of tumour aggressiveness, and the zinc finger protein CTCF regulates ECM-related genes, thereby promoting GC cell growth and migration. Wei et alCitation21 found that HOTAIR and COL5A1 were overexpressed in GC compared to normal controls, and HOTAIR regulates GC growth by sponging miR-1277-5p and upregulating COL5A1 via effects on the tumour microenvironment.
After the selection of LASSO analysis, a total of 46 genes were revealed to establish the prognostic models, such as PIK3CA, PIK3CB, ITGA11, and TNN. The PIK3CA and PIK3CB genes encode phosphatidylinositol-3-kinase (PI3K), and the PI3K axis has been shown to be activated in approximately one-third of human cancers. One of the malignancies that is most affected by this axis is GC. Zhao et alCitation22 found that miR-522 can accelerate the progression of GC by targeting FOXO1 and regulating PI3K/AKT signalling. Among the different mechanisms that regulate EMT, IGF-1 signalling is the main regulator of this process in GC cells. Li et alCitation23 reported that IGF-1 activation could increase the expression of ZEB2, and abrogation of the PI3K/AKT axis could downregulate ZEB2, resulting in the suppression of IGF-1-mediated EMT. Lu et alCitation24 also found that abrogation of the PI3K/Akt axis could attenuate the oncogenic effect of miR-19a and thereby prevent the incidence of EMT in GC. As for ITGA11, Meng et alCitation25 revealed its function in prostate cancer. ITGA11 protein levels were positively associated with advanced-stage disease, and silencing ITGA11 expression decreased cell migration and invasion.
The prognostic model was successfully established and validated in the TCGA-STAD and GSE62254 cohorts, especially in the GSE62254 cohort, and we obtained an AUC value as high as 0.834. Recently, several studies have reported prognostic models for GC patients based on gene expression profiles. Sun et alCitation26 constructed a genomic instability-associated six-lncRNA signature with an integral AUC value of 0.681 that lacked external validation. Chen et alCitation27 reported a ten-immune-related gene signature with a 1-year AUC of 0.681 and even failed to reach 0.57 in the GSE15459 cohort and 0.559 in the GSE84437 cohort; these results are not acceptable. Zhang et alCitation28 reported an immune signature in the GSE62254 cohort, with an AUC value of only 0.793 in the entire cohort. Izumi et alCitation29 constructed a gene expression-based 15-gene signature to distinguish lymph node status and obtained an AUC value of only 0.829 in the GSE62254 cohort. Li et alCitation30 constructed a six gene-based prognostic model in the TCGA-STAD cohort; however, the AUC value they validated in GSE62254 was only 0.60–0.63. In addition, the prognostic model we established was an independent prognostic factor after adjusting for the clinical features of age, sex, stage, grade, and EBV status.
Immunotherapy is already applied in the clinical treatment of GC patients; therefore, it is important to select the appropriate patient to receive the therapy. In the KEYNOTE-059 trial, only 11.6% of recruited patients with advanced gastric/gastroesophageal junction cancer receiving pembrolizumab monotherapy were responders,Citation31 and the objective response rate (ORR) of nivolumab in the ATTRACTION-2 trial was 11.2% for Asian patients.Citation32 Zhou et al introduced a novel immunogenomic classification of the GC microenvironment and reported that patients with the immune activation subtype were ideal candidates to receive anti-PD-(L)1 immunotherapy, and those with the immunosuppressive subtype may be responders to combination therapy with anti-TGF-β antibodies. In the current study, we first compared the association of the risk score and 28 immunocytes and observed the highest association of dendritic cells. Further research revealed that the IFNAR1 protein was highly expressed in GC, and patients with high expression of IFNAR1 and infiltration of dendritic cells had the worst prognosis. In addition, we revealed that patients with a high-risk score were more suitable for anti-CTLA4 immunotherapy but not anti-PD1 or anti-PDL1 therapy.
This is the first study to generate a prognostic model with an activated signalling pathway for GC patients. We revealed that ECM-associated pathways were significantly activated in the two GC cohorts and then constructed a prognostic model similar to reeling silk from cocoons. Another advantage is that the newly defined risk score can act as the filter for patients who are more suitable for anti-CTLA4 immunotherapy. In contrast, several limitations should also be pointed out. First, these new findings need further validation in real-world patients, especially patients who receive immunotherapy. Second, biological experiments to confirm the function of dendrites and IFNAR1 are also necessary. We hope the findings in the current study can provide new insight for clinical treatment and basic research on GC patients.
Conclusion
We established and verified an extracellular matrix prognostic model of gastric patients. The model can be used to evaluate the risk of death of GC patients, as well as the response to anti-CTLA4 immunotherapy.
Data Sharing Statement
All data used in this work can be acquired from the GDC portal (https://portal.gdc.cancer.gov/), Gene-Expression Omnibus (GEO; https://www.ncbi.nlm.nih.gov/geo/).
Ethical Approval and Consent to Participate
Extra informed consent is not essential as the data were all obtained from a public database.
Author Contributions
All authors made a significant contribution to the work reported, whether that is in the conception, study design, execution, acquisition of data, analysis and interpretation, or in all these areas; took part in drafting, revising or critically reviewing the article; gave final approval of the version to be published; have agreed on the journal to which the article has been submitted; and agree to be accountable for all aspects of the work.
Acknowledgments
This work was supported by the Natural Science Foundation of Anhui Province,1808085MH247.
Disclosure
The authors have declared no conflicts of interest.
References
- Bray F, Ferlay J, Soerjomataram I, Siegel RL, Torre LA, Jemal A. Global cancer statistics 2018: GLOBOCAN estimates of incidence and mortality worldwide for 36 cancers in 185 countries. CA Cancer J Clin. 2018;68(6):394–424. doi:10.3322/caac.21492
- Chen W, Zheng R, Baade PD, et al. Cancer statistics in China, 2015. CA Cancer J Clin. 2016;66(2):115–132. doi:10.3322/caac.21338
- Thrift AP, El-Serag HB. Burden of gastric cancer. Clin Gastroenterol Hepatol. 2020;18(3):534–542. doi:10.1016/j.cgh.2019.07.045
- Zheng P, Chen L, Yuan X, et al. Exosomal transfer of tumor-associated macrophage-derived miR-21 confers cisplatin resistance in gastric cancer cells. J Exp Clin Cancer Res. 2017;36(1):53. doi:10.1186/s13046-017-0528-y
- Wei L, Sun J, Zhang N, et al. Noncoding RNAs in gastric cancer: implications for drug resistance. Mol Cancer. 2020;19(1):62. doi:10.1186/s12943-020-01185-7
- Yeon M, Kim Y, Pathak D, et al. The CAGE-MiR-181b-5p-S1PR1 axis regulates anticancer drug resistance and autophagy in gastric cancer cells. Front Cell Dev Biol. 2021;9:666387. doi:10.3389/fcell.2021.666387
- Wang J, Lv B, Su Y, Wang X, Bu J, Yao L. Exosome-mediated transfer of lncRNA HOTTIP promotes cisplatin resistance in gastric cancer cells by regulating HMGA1/miR-218 axis. Onco Targets Ther. 2019;12:11325–11338. doi:10.2147/OTT.S231846
- Wang Q, Liang J, Hu X, Gu S, Xu Q, Yan J. Early B cell factors involve in the tumorigenesis and predict the overall survival of gastric cancer. Biosci Rep. 2021;41(7). doi:10.1042/BSR20210055
- Li L, Wang X. Identification of gastric cancer subtypes based on pathway clustering. NPJ Precis Oncol. 2021;5(1):1–17. doi:10.1038/s41698-021-00186-z
- Lu X, Jiang L, Zhang L, et al. Immune signature-based subtypes of cervical squamous cell carcinoma tightly associated with human papillomavirus type 16 expression, molecular features, and clinical outcome. Neoplasia. 2019;21(6):591–601. doi:10.1016/j.neo.2019.04.003
- Necchi A, Joseph RW, Loriot Y, et al. Atezolizumab in platinum-treated locally advanced or metastatic urothelial carcinoma: post-progression outcomes from the Phase II IMvigor210 study. Ann Oncol. 2017;28(12):3044–3050. doi:10.1093/annonc/mdx518
- Meng J, Zhou Y, Lu X, et al. Immune response drives outcomes in prostate cancer: implications for immunotherapy. Mol Oncol. 2020. doi:10.1002/1878-0261.12887
- Roh W, Chen PL, Reuben A, et al. Integrated molecular analysis of tumor biopsies on sequential CTLA-4 and PD-1 blockade reveals markers of response and resistance. Sci Transl Med. 2017;9(379):eaah3560. doi:10.1126/scitranslmed.aah3560
- Heagerty PJ, Lumley T, Pepe MS. Time‐dependent ROC curves for censored survival data and a diagnostic marker. Biometrics. 2000;56(2):337–344. doi:10.1111/j.0006-341X.2000.00337.x
- Liao AP, Salajegheh M, Morehouse C, et al. Human plasmacytoid dendritic cell accumulation amplifies their type 1 interferon production. Clin Immunol. 2010;136(1):130–138. doi:10.1016/j.clim.2010.02.014
- Wimmers F, Subedi N, van Buuringen N, et al. Single-cell analysis reveals that stochasticity and paracrine signaling control interferon-alpha production by plasmacytoid dendritic cells. Nat Commun. 2018;9(1):3317. doi:10.1038/s41467-018-05784-3
- Socovich AM, Naba A. The cancer matrisome: from comprehensive characterization to biomarker discovery. Semin Cell Dev Biol. 2019;89:157–166. doi:10.1016/j.semcdb.2018.06.005
- Naba A, Clauser KR, Ding H, Whittaker CA, Carr SA, Hynes RO. The extracellular matrix: tools and insights for the “omics” era. Matrix Biol. 2016;49:10–24. doi:10.1016/j.matbio.2015.06.003
- Han S, Wang Z, Liu J, Wang HD, Yuan Q. miR-29a-3p-dependent COL3A1 and COL5A1 expression reduction assists sulforaphane to inhibit gastric cancer progression. Biochem Pharmacol. 2021;188:114539. doi:10.1016/j.bcp.2021.114539
- Liu C, Deng L, Lin J, et al. Zinc finger protein CTCF regulates extracellular matrix (ECM)-related gene expression associated with the Wnt signaling pathway in gastric cancer. Front Oncol. 2020;10:625633. doi:10.3389/fonc.2020.625633
- Wei Z, Chen L, Meng L, Han W, Huang L, Xu A. LncRNA HOTAIR promotes the growth and metastasis of gastric cancer by sponging miR-1277-5p and upregulating COL5A1. Gastric Cancer. 2020;23(6):1018–1032. doi:10.1007/s10120-020-01091-3
- Zhao Y, Zhang J, Yang W, Yang Z, Zhou K. MicroRNA-552 accelerates the progression of gastric cancer by targeting FOXO1 and regulating PI3K/AKT pathway. J Oncol. 2021;2021:9966744. doi:10.1155/2021/9966744
- Li H, Xu L, Zhao L, et al. Insulin-like growth factor-I induces epithelial to mesenchymal transition via GSK-3β and ZEB2 in the BGC-823 gastric cancer cell line. Oncol Lett. 2015;9(1):143–148. doi:10.3892/ol.2014.2687
- Lu WD, Zuo Y, Xu Z, Zhang M. MiR-19a promotes epithelial-mesenchymal transition through PI3K/AKT pathway in gastric cancer. World J Gastroenterol. 2015;21(15):4564–4573. doi:10.3748/wjg.v21.i15.4564
- Meng J, Guan Y, Wang Bet al. Molecular subtyping and prognostic assessment of prostate cancer based on consensus genes. Research Square. 2021. doi:10.21203/rs.3.rs-413181/v1
- Sun J, Jiang Q, Chen H, et al. Genomic instability-associated lncRNA signature predicts prognosis and distinct immune landscape in gastric cancer. Ann Transl Med. 2021;9(16):1326. doi:10.21037/atm-21-3569
- Chen T, Yang C, Dou R, Xiong B. Identification of a novel 10 immune-related genes signature as a prognostic biomarker panel for gastric cancer. Cancer Med. 2021;10(18):6546–6560. doi:10.1002/cam4.4180
- Zhang C, Li D, Yu R, et al. Immune landscape of gastric carcinoma tumor microenvironment identifies a peritoneal relapse relevant immune signature. Front Immunol. 2021;12:651033. doi:10.3389/fimmu.2021.651033
- Izumi D, Gao F, Toden S, et al. A genomewide transcriptomic approach identifies a novel gene expression signature for the detection of lymph node metastasis in patients with early stage gastric cancer. EBioMedicine. 2019;41:268–275. doi:10.1016/j.ebiom.2019.01.057
- Li J, Pu K, Li C, Wang Y, Zhou Y. A novel six-gene-based prognostic model predicts survival and clinical risk score for gastric cancer. Front Genet. 2021;12:615834. doi:10.3389/fgene.2021.615834
- Fuchs CS, Doi T, Jang RW, et al. Safety and efficacy of pembrolizumab monotherapy in patients with previously treated advanced gastric and gastroesophageal junction cancer: phase 2 clinical KEYNOTE-059 trial. JAMA Oncol. 2018;4(5):e180013. doi:10.1001/jamaoncol.2018.0013
- Kang YK, Boku N, Satoh T, et al. Nivolumab in patients with advanced gastric or gastro-oesophageal junction cancer refractory to, or intolerant of, at least two previous chemotherapy regimens (ONO-4538-12, ATTRACTION-2): a randomised, double-blind, placebo-controlled, Phase 3 trial. Lancet. 2017;390(10111):2461–2471. doi:10.1016/S0140-6736(17)31827-5