
Abstract
Background
There are more than 228,394,572 confirmed cases and 4,690,186 confirmed deaths caused by COVID-19 worldwide. The magnitude of the COOVID-19 pandemic has stimulated research on the treatment and diagnosis of COVID-19 patients.
Objective
In this report, a battery of specific parameters was used to develop a model that allows prediction of the outcome of the COVID-19 treatment. These parameters are C-reactive protein, procalcitonin, fibrinogen, D-dimers, immature granulocytes, and interleukin-6.
Methods
The study was carried out on a sample of N = 49 survivors (22 men, 27 women) and 83 deceased patients (62 men, 21 women). The distribution of means and differences in means of the parameters studied between survivors and deceased patients were evaluated using the bootstrap method.
Results
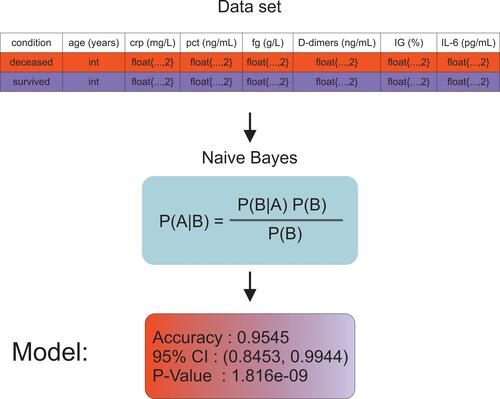
A mathematical model that allows for the prediction of hospitalization outcome was obtained using the Naive Bayes model. The results demonstrated a statistically significant difference between survivors and deceased patients in all parameters studied. A mathematical model employing a battery of parameters provided a 97% precision in predicting the outcome of hospitalization.
Conclusion
This study showed that the cross-correlation of survivability with absolute levels of C-reactive protein, procalcitonin, fibrinogen, D-dimers, immature granulocytes, and interleukin-6 could be used successfully in the hospital setting as a diagnostic tool.
Introduction
The world has been plagued by coronavirus disease (COVID-19) for the past 2 years. Globally, there are 228,394,572 confirmed cases with 4,690,186 confirmed deaths.Citation1 Coronaviruses are part of the Coronaviridae subfamilyCitation2 and belong to the family of positive-sense RNA viruses responsible for respiratory diseases in mammals and birds.Citation3 In the Coronaviridae subfamily, there are three groups. The viruses of Groups 1 and 2 have only mammalian hosts, whereas the viruses of Group 3 have only been found in birds.Citation4
Methods for diagnosing COVID-19 include 1) nucleic acid amplification test (NAAT), 2) the serological test, and 3) the hematologic test.Citation5 Hematologic disorders can be divided into typical, most common, and hematologic abnormalities in conjunction with coagulopathy.Citation6 For example, a typical abnormality of COVID-19 disease is high levels of C-reactive protein (CRP)Citation7 and D-dimer.Citation8 Furthermore, serum procalcitonin (PCT)Citation9 and fibrinogen (Fg)Citation10 also have diagnostic value for patients with COVID-19.
Studies on COVID-19, a detrimental influence on medical services induced by the Covid-19 outbreak, indicate the need for robust and quick methods to predict Covid-19 mortality. Among such, one may distinguish study of Castelnuovo et al,Citation11 who employed a machine learning tool to predict cardiovascular risk factors on Covid-19 mortality. Furthermore, machine-supported decision increases the speed of decisions on Covid-19 treatment, which is extremely important because Covid-19 outburst delayed the diagnosis of other diseases.Citation12
The purpose of this report is to evaluate the relative differences in CRP, PCT, Fg, D-dimers, immature granulocytes (IG), and interleukin-6 (IL-6) in subjects who recovered or died from COVID-19 and to provide a robust mathematical model for the prediction of COVID-19 mortality and treatment outcome. The mathematical model used for the estimation of COVID-19 rendered mortality was the Naive Bayes classification. Consequently, this report is among a few that use mathematical modelling to test a wide range of blood markers to predict the outcome of the disease.
Methods
The study was performed accordingly to World Medical Association (WMA) declaration of Helsinki. Data were collected on the date of death or discharge from the hospital. Institutional Ethics Clearance (IEC) granted by the Regional Ethics Committee of Medical Chamber in Gdańsk, Poland, was obtained for this study: KB-29/21. Additionally, each person provided a signed informed consent form.
Study Subjects
The data used in this study included blood tests from patients admitted to Dr. Tytus Chałubiński Specialist Hospital in Radom, Poland. In this study, a total of N = 132 subjects were used: N = 49 survivors (22 men, 27 women) and N = 83 deceased patients (62 men, 21 women).
Experimental Methods
CRP protein concentration was measured using an in vitro immunoturbidimetric assay (Tina-quant C-reactive protein IV) in serum.Citation13 It is a latex particle-enhanced immunoturbidimetric assay that consists of TRIS buffer with bovine serum albumin (BSA) with preservatives R2 and latex particles coated with mouse anti-CRP glycine buffer and mouse immunoglobulins with preservative. Human CRP was agglutinated with latex particles covered with anti-CRP monoclonal antibodies, and the precipitate was measured by turbidimetry.
PCT concentration was determined in vitro using the Elecsys BRAHMS PCT serum assay.Citation14 The test was carried out in three steps. The first step was to incubate a complex composed of sample antigen, biotinylated PCT-specific monoclonal antibodies, and PCT-specific monoclonal antibodies labeled with a ruthenium complex. The second step involved adding labeled microparticles to streptavidin to bind the complex to the solid phase using the affinity of biotin and streptavidin. The third step was to transfer the reaction mixture to the measuring chamber, where the microparticles were attracted to the electrode surface by a magnet. The unbound particles were processed using the ProCell/ProCell M method. Electrochemiluminescence and photon emission were induced by the applied voltage and measured using a photomultiplier. The results were quantified by reference to the calibration curve.
Fg was quantified using Dia-FIB.Citation15 In principle, the method allows measuring the clotting time after adding a high concentration of thrombin to the diluted plasma. Plasma fibrinogen concentration is inversely correlated with clotting time.
The concentration of D-dimers was measured using the photometric Dia-D-DIMER method.Citation16 Dia-D-DIMER is an immunoturbidimetric test reinforced with latex particles. The method uses the binding of the sample to antibodies directed at D-dimers and the coating of latex particles. The concentration of D-dimers was determined by an antigen–antibody photometric reaction.
IG analysis was performed automatically using a Sysmex XN-550 multiparameter hematology analyzerCitation17 from blood samples obtained by venipuncture in EDTA vacutainer tubes.
IL-6 concentration was measured in serum collected from separation gel tubes. The procedure was a four-step process that included 1) first incubation: 30 μL of a sample were incubated with a biotinylated monoclonal IL6-specific antibody, 2) second incubation: After the addition of a monoclonal IL6-specific antibody labeled with a ruthenium complex and streptavidin-coated microparticles, the antibodies form a sandwich complex with the antigen of the sample, 3) the reaction mixture was aspirated into the measuring cell where the microparticles are magnetically captured on the surface of the electrode. The unbound substances were then removed with Procell/ProCell M. The application of a voltage to the electrode then induced chemiluminescent emission, which was measured by a photomultiplier, and 4) the results were determined by a calibration curve that is instrument-specific generated by a 2-point calibration and a master curve.
Statistical Analysis
The distribution of means and differences in means between survivors and deceased patients were tested using a bootstrap test consisting of 10,000 repeats with replacement.Citation18
The Naive Bayes-supervised nonlinear classification algorithm was implemented using the R language.Citation19 The characteristics used in the construction of the model were following: age, PRC, PCT, Fg, D-dimers, IG%, and IL-6. The data set was divided into training and testing sets, where the number of cases in the training data was 71 and the number of cases in the testing data was 45. The data set was divided into two classes: survivors and deceased patients. The scheme of the model construction procedure, including the structure of the input database, is illustrated in .
Figure 1 The scheme of Naive Bayes model building process.
Results
provides an age distribution of survivors and deceased patients. The means of CRP, PCT, Fg, D-dimers, IG, and IL-6 stratified by hospitalization outcome are collected in and shown in – to –.
Table 1 Mean (x) and Confidence Intervals (5%, 95%) at a = 0.05, for C-Reactive Protein (CRP) [mg/L], Procalcitonin (PCT) [ng/mL], Fibrinogen (Fg) [g/L] and D-dimers [ng/mL], Immature Globulins (IG) [%], and Interleukin 6 (IL-6) [pg/mL] Stratified by Survival Status
Figure 2 Age distribution differences between the survived and deceased subjects.
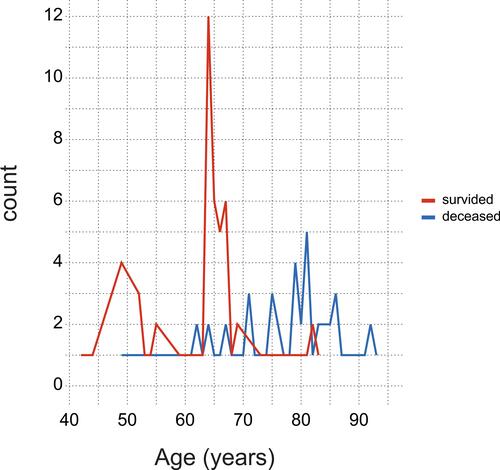
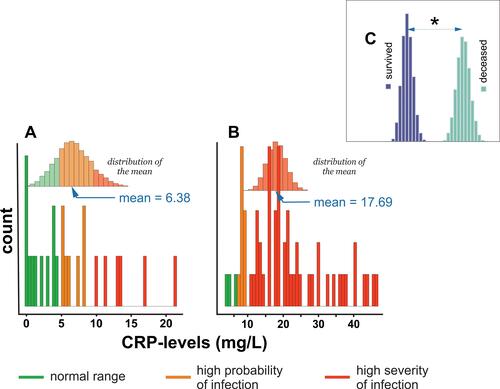
Figure 3 Histogram of CRP levels distribution in (A) subjects who survived COVID-19 infection, (B) deceased subjects, and (C) comparison of differences in means between survived and deceased subjects. * - denotes P < 0.05.
Analysis of data collected in shows that survivors were defined by three times higher CRP levels, two times higher PCT levels, six times higher D-dimers levels, five times higher in IG% and three times higher IL-6 levels than deceased subjects. Twofold lower Fg levels were observed between the respective groups.
shows that the mean distribution of CRP in survivors included normal (<4.1 mg/L),Citation20 high probability (>4.1 mg/L),Citation21 and high severity (>8.7 mg/L)Citation22 of the COVID-19 infection reference range. shows that the distribution of CRP concentration among deceased subjects fell within the high-severity range of COVID-19 infection. reveals a statistically significant difference in mean CRP levels between survivors and deceased subjects.
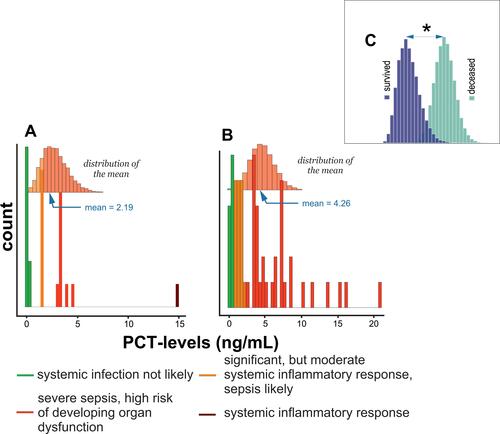
shows that the mean distribution of PCT among survivors was in a significant but moderate systemic inflammatory response, a likely range of sepsis and severe sepsis, and a high-risk range of developing organ dysfunction.Citation23 shows that the distribution of PCT in the deceased patient group ranged from a nonprobable systemic infection to severe sepsis and a high risk of developing organ dysfunction. Finally, shows statistically significant differences in mean PCT between survivors and deceased subjects.
Figure 4 Histogram of PCT levels distribution in (A) subjects who survived COVID-19 infection, (B) deceased subjects, and (C) comparison of differences in means between survived and deceased subjects. * - denotes P < 0.05.
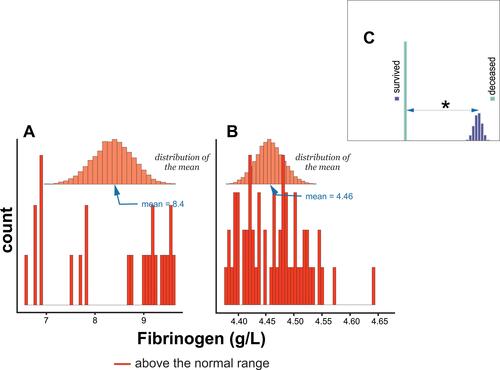
and show that the distribution of Fg means among survivors and deceased groups was in the normal range (>4 g/L).Citation24 Furthermore, there was a statistically significant difference in the means of Fg between survivors and deceased patients, .
Figure 5 Histogram of Fibrinogen levels distribution in (A) subjects who survived COVID-19 infection, (B) deceased subjects, and (C) comparison of differences in means between survived and deceased subjects. * - denotes P < 0.05.
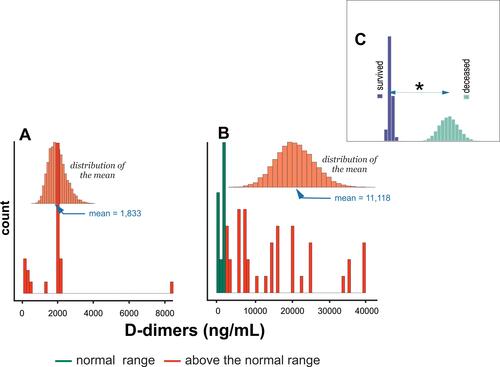
The distribution of the mean concentration of D dimers among survivors and the deceased group, and , respectively, was above the normal range (>250 ng/mL).Citation25 shows statistically significant differences in the mean of D dimers between survivors and deceased subjects.
Figure 6 Histogram of D-dimers levels distribution in (A) subjects who survived COVID-19 infection, (B) deceased subjects, and (C) comparison of differences in means between survived and deceased subjects. * - denotes P < 0.05.
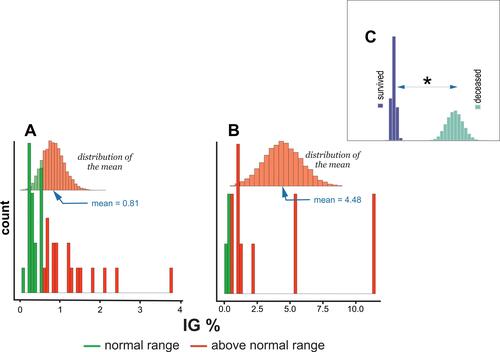
shows that the IG distribution in survivors encompassed the normal range (<1%) and above the normal range (≥1%) range.Citation26,Citation27 The distribution of the mean IG% among the deceased patients included levels above only the normal range, . shows a statistically significant difference in the means of IG% between survivors and deceased subjects.
Figure 7 Histogram of IG% levels distribution in (A) subjects who survived COVID-19 infection, (B) deceased subjects, and (C) comparison of differences in means between survived and deceased subjects. * - denotes P < 0.05.
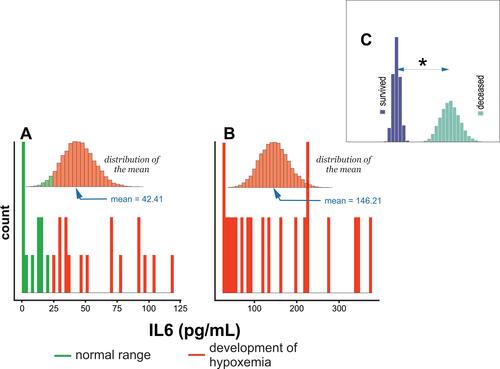
reveals that the distributions of IL-6 among survivors encompassed values within (≤24 pg/mL) and above the normal range (>24 pg/mL).Citation28 The deceased groups covered values above the normal range, . Moreover, a statistically significant difference in the mean levels of IL-6 between survivors and deceased subjects is observed, .
Figure 8 Histogram of IL6 levels distribution in (A) subjects who survived COVID-19 infection, (B) deceased subjects, and (C) comparison of differences in means between survived and deceased subjects. * - denotes P < 0.05.
Discussion
To the best of our knowledge, the present study is among the first to prove the usefulness of a combination of a battery of blood test parameters and a machine learning model to predict the outcome of COVID-19 treatment.
Several reports showed that C-reactive protein (CRP) levels increase significantly in response to injury,Citation29 infection,Citation30 and inflammationCitation31 and participate in the inflammation process.Citation31 Furthermore, CRP can recognize self- and foreign molecules by pattern recognition.Citation32 Therefore, its mode of action is different from that of immunoglobulins, which recognize only distinct antigenic epitopes. A recent study also demonstrated CRP usability as a predictor of the severity of COVID-19.Citation7 This report confirmed a correlation between survival status and CRP levels in subjects infected with COVID-19.Citation11 A three-times higher level of CRP defined patients who died from COVID-19 than subjects who survived infection and disease: 17.7 vs 6.4 mg/L (–). PCT, the precursor of calcitonin,Citation33,Citation34 is the hormone responsible for calcium homeostasis.Citation35 Its levels increase substantially in sepsis,Citation36 systemic infections,Citation37 and severe inflammation.Citation38 A recent study also showed that PCT concentration is significantly higher in patients with COVID-19.Citation39 This observation is in agreement with the results of this report (, –). Therefore, patients who died of COVID-19 were defined by a mean PCT equal to 4.3 ng/mL, while the PCT level equal to 2.19 ng/mL defined patients who survived COVID-19.
This study also found an inverse correlation between Fg and D-dimers as a function of the severity of COVID-19. Deceased subjects were defined by two times lower levels of Fg and six times higher levels of D-dimers compared to patients who recovered from COVID-19 infection. Therefore, the levels of the Fg and D dimers were equal to 4.5 g/L and 11,118 ng/mL, vs 8.4 g/L and 1833 ng/mL for the subjects deceased and survived, respectively (– and –).
Some studies showed a reciprocal relationship between inflammation severity and IG number.Citation40–Citation42 Furthermore, elevated levels of IG were also discovered among COVID-19 patients.Citation43 The results of this study confirmed a statistically significant increase in IG% levels among patients who died of COVID-19. Thus, a mean IG% equal to 4.5 defined deceased subjects, while survivors are defined by a mean IG% equal to 0.8 (–).
IL-6 synthesized by an organism in response to infection,Citation44 tissue injury,Citation45 or inflammation,Citation46 was also used as a predictor of the severity of COVID-19.Citation28 This study confirmed this observation and found a direct correlation between IL-6 concentration and COVID-19 survival status. Therefore, patients who died of COVID-19 were defined by a mean IL-6 concentration equal to 146.2 pg/mL, while survivors were defined by a mean IL-6 concentration equal to 42.4 pg/mL (–).
This study focuses on the problem of predicting standard government-approved COVID-19 treatmentCitation47 versus mortality. However, it must be noted that other approaches of COVID-19 treatment using, for example, heparinCitation48 were also studied. Furthermore, the means of education on vaccination against COVID-19 should also be taken into account for the prevention and treatment of COVID-19.Citation49 The relationship described above allows us to conclude that all parameters investigated differentiate the survivability of patients with COVID-19. Therefore, they could be the appropriate parameters for mathematical models predicting recovery after COVID-19 infection and disease.
Naive Bayes (NB) is a popular machine learning technique that offers a highly effective probabilistic classifier with a solid mathematical foundationCitation50,Citation51 and has been shown to perform well in medical diagnosis.Citation52 Furthermore, a recent study has shown that it is suitable for the detection of patients with COVID-19.Citation53 Using our findings, we attempted to build a mathematical model using the NB algorithm to predict the survivability of patients with COVID-19. However, the model presented in this study differs from the model previously proposed by Mansour et al.Citation53 Thus, the following numerical characteristics (concentrations) were used in the construction of the model: CRP, PCT, Fg, D-dimers, IL-6, and %IG, as well as the chronological age of a patient. Consistent application of these parameters allowed us to elucidate a model that allowed us to predict the outcomes of COVID-19 with 97% precision.
The limitation of this study is the size of the study sample. However, the provided model can be easily updated for much larger datasets.
Conclusions
The results of the study show the direct usability of serum C-reactive protein concentrations, procalcitonin, fibrinogen, D-dimers, immature globulin percentage, and interleukin 6 to evaluate the probability of survival of COVID-19 patients in the hospital environment. The obtained Naive Bayes model may be used per se for prediction of the COVID-19 outcome or further tuned by incorporating additional parameters to increase its predictive power. In brief, inclusion of laboratory-derived data on C-reactive protein, procalcitonin, fibrinogen, D-dimer, immature globulin percentage, and interleukin 6 to the provided model predicts the probable outcome of the treatment. Although some may view the presumption on treatment outcome as unethical, it is the tool that can be used to intensify treatment of change of treatment to change predicted unsuccessful outcome.
Data Sharing Statement
Model and the data are available upon request.
Disclosure
The authors report no conflicts of interest in this work.
References
- World Health Organization. WHO Coronavirus (COVID-19) dashboard. Available from: https://covid19.who.int/. Accessed September 21, 2021.
- King AM, Lefkowitz E, Adams MJ, Carstens EB. Virus Taxonomy: Ninth Report of the International Committee on Taxonomy of Viruses. Vol. 9. Elsevier; 2011.
- Lai M, Holmes K. Fields Virology. Knipe DM, Howley PM, edited by. Philadelphia: Lippincott Williams & Wilkins; 2001.
- Masters PS. The molecular biology of coronaviruses. Adv Virus Res. 2006;66:193–292. doi:10.1016/S0065-3527(06)66005-3
- Kaye AD, Cornett EM, Brondeel KC, et al. Biology of COVID-19 and related viruses: epidemiology, signs, symptoms, diagnosis, and treatment. Best Pract Res Clin Anaesthesiol. 2020;35(3):269–292 doi:10.1016/j.bpa.2020.12.003
- Fu L, Wang B, Yuan T, et al. Clinical characteristics of coronavirus disease 2019 (COVID-19) in China: a systematic review and meta-analysis. J Infect. 2020;80(6):656–665. doi:10.1016/j.jinf.2020.03.041
- Ahnach M, Zbiri S, Nejjari S, Ousti F, Elkettani C. C-reactive protein as an early predictor of COVID-19 severity. J Med Biochem. 2020;39(4):500–507. doi:10.5937/jomb0-27554
- Yu HH, Qin C, Chen M, Wang W, Tian D-S. D-dimer level is associated with the severity of COVID-19. Thromb Res. 2020;195:219–225. doi:10.1016/j.thromres.2020.07.047
- Ahmed S, Jafri L, Hoodbhoy Z, Siddiqui I. Prognostic value of serum procalcitonin in COVID-19 patients: a systematic review. Indian J Crit Care Med. 2021;25(1):77–84. doi:10.5005/jp-journals-10071-23706
- Osawa I, Okamoto K, Ikeda M, et al. Dynamic changes in fibrinogen and D-dimer levels in COVID-19 patients on nafamostat mesylate. J Thromb Thrombolysis. 2021;51(3):649–656. doi:10.1007/s11239-020-02275-5
- Di Castelnuovo A, Bonaccio M, Costanzo S, et al. Common cardiovascular risk factors and in-hospital mortality in 3894 patients with COVID-19: survival analysis and machine learning-based findings from the multicentre Italian CORIST Study. Nutr Metab Cardiovasc Dis. 2020;30(11):1899–1913. doi:10.1016/j.numecd.2020.07.031
- Di Gennaro F, Gualano G, Timelli L, et al. Increase in tuberculosis diagnostic delay during first wave of the COVID-19 pandemic: data from an Italian infectious disease referral hospital. Antibiotics. 2021;10(3):272. doi:10.3390/antibiotics10030272
- Tina-quant C-reactive protein IV. Available from: https://diagnostics.roche.com/global/en/products/params/tina-quant-c-reactive-protein-gen-3. Accessed December 6, 2021.
- Elecsys BRAHMS PCT serum assay. Available from: https://diagnostics.roche.com/nl/en/products/params/elecsys-brahms-procalcitonin-pct.html. Accessed December 6, 2021.
- Dia-FIB. Available from: http://www.diagon.com/en/screen/dia-fib. Accessed December 6, 2021.
- Dia-D-DIMER. Available from: http://www.diagon.com/en/ddi/diaddinagy. Accessed December 6, 2021.
- Sysmex XN-550. Available from: https://www.sysmex-ap.com/product/xn-550/. Accessed December 6, 2021.
- Efron B. Bootstrap methods: another look at the Jackknife. Ann Stat. 1979;7(1):1–26. doi:10.1214/aos/1176344552
- R: a language and environment for statistical computing. R Foundation for Statistical Computing; 2020. Available from: https://www.R-project.org/. Accessed December 6, 2021.
- Ridker P, Cook N. Clinical usefulness of very high and very low levels of C-reactive protein across the full range of Framingham risk scores. Circulation. 2004;109(16):1955–1959. doi:10.1161/01.CIR.0000125690.80303.A8
- Povoa P, Coelho L, Almeida E, et al. Early identification of intensive care unit-acquired infections with daily monitoring of C-reactive protein: a prospective observational study. Crit Care. 2006;10(2):R63. doi:10.1186/cc4892
- Lelubre C, Anselin S, Zouaoui Boudjeltia K, Biston P, Piagnerelli M. Interpretation of C-reactive protein concentrations in critically ill patients. Biomed Res Int. 2013;2013:124021. doi:10.1155/2013/124021
- Harbarth S, Holeckova K, Froidevaux C, et al. Diagnostic value of procalcitonin, interleukin-6, and interleukin-8 in critically ill patients admitted with suspected sepsis. Am J Respir Crit Care Med. 2001;164(3):396–402. doi:10.1164/ajrccm.164.3.2009052
- Miesbach W, Schenk J, Alesci S, Lindhoff-Last E. Comparison of the fibrinogen Clauss assay and the fibrinogen PT derived method in patients with dysfibrinogenemia. Thromb Res. 2010;126(6):e428–33. doi:10.1016/j.thromres.2010.09.004
- Pagana K, Pagana T, Pagana T. Mosby’s Diagnostic and Laboratory Test Reference. 15th ed. Elsevier, Inc; 2020.
- Roehrl MH, Lantz D, Sylvester C, Wang JY. Age-dependent reference ranges for automated assessment of immature granulocytes and clinical significance in an outpatient setting. Arch Pathol Lab Med. 2011;135(4):471–477. doi:10.5858/2010-0258-oa.1
- Pastoret C, Ly Sunnaram B, Fest T, Roussel M. Integration of Immature granulocytes quantification with the version 2.0 UniCel DxH 800 in the hematoFlow strategy. Am J Clin Pathol. 2016;145(4):552–559. doi:10.1093/ajcp/aqw035
- Sabaka P, Koščálová A, Straka I, et al. Role of interleukin 6 as a predictive factor for a severe course of Covid-19: retrospective data analysis of patients from a long-term care facility during Covid-19 outbreak. BMC Infect Dis. 2021;21(1):308. doi:10.1186/s12879-021-05945-8
- Pritchett JW. C-reactive protein levels determine the severity of soft-tissue injuries. Am J Orthop. 1996;25(11):759–761.
- Melbye H, Hvidsten D, Holm A, Nordbø SA, Brox J. The course of C-reactive protein response in untreated upper respiratory tract infection. Br J Gen Pract. 2004;54(506):653–658.
- Luan -Y-Y, Yao Y-M. The clinical significance and potential role of C-reactive protein in chronic inflammatory and neurodegenerative diseases. Front Immunol. 2018;9:1302. doi:10.3389/fimmu.2018.01302
- Du Clos TW. Function of C-reactive protein. Ann Med. 2000;32(4):274–278. doi:10.3109/07853890009011772
- Roos B, Okano K, Deftos L. Evidence for a pro-calcitonin. Biochem Biophys Res Commun. 1974;60(3):1134–1140. doi:10.1016/0006-291X(74)90430-6
- Jullienne A, Segond N, Calmettes C, Moukhtar MS, Milhaud G. Biosynthesis of human calcitonin: evidence for a prohormone. Biochem Biophys Res Commun. 1980;95(3):932–937. doi:10.1016/0006-291x(80)91562-4
- Zaidi M, Alam AS, Shankar VS, et al. A quantitative description of components of in vitro morphometric change in the rat osteoclast model: relationships with cellular function. Eur Biophys J. 1992;21(5):349–355. doi:10.1007/bf00188348
- Müller B, Becker KL, Schächinger H, et al. Calcitonin precursors are reliable markers of sepsis in a medical intensive care unit. Crit Care Med. 2000;28(4):977–983. doi:10.1097/00003246-200004000-00011
- Hausfater P, Garric S, Ayed SB, Rosenheim M, Bernard M, Riou B. Usefulness of procalcitonin as a marker of systemic infection in emergency department patients: a prospective study. Clin Infect Dis. 2002;34(7):895–901. doi:10.1086/339198
- Reinhart K, Karzai W, Meisner M. Procalcitonin as a marker of the systemic inflammatory response to infection. Intensive Care Med. 2000;26(9):1193–1200. doi:10.1007/s001340000624
- Hu R, Han C, Pei S, Yin M, Chen X. Procalcitonin levels in COVID-19 patients. Int J Antimicrob Agents. 2020;56(2):106051. doi:10.1016/j.ijantimicag.2020.106051
- Korkut M, Bedel C, Selvi F. Are immature granulocytes and derivatives early predictors of acute appendicitis and acute complicated appendicitis in adults? Formos J Surg. 2020;53(4):123–127. doi:10.4103/fjs.fjs_111_19
- Incir S. The role of immature granulocytes and inflammatory hemogram indices in the inflammation. Int J Med Biochem. 2020. doi:10.14744/ijmb.2020.02986
- Lima LR, Cunha GS, Nogueira KS, Comar SR. Automated immature granulocyte count in patients of the intensive care unit with suspected infection/Contagem automatizada de granulócitos imaturos em pacientes de uma unidade de terapia intensiva com suspeita de infecção. J Bras Patol Med Lab. 2019;55(3):267–280.
- Karimi Shahri M, Niazkar HR, Rad F. COVID-19 and hematology findings based on the current evidences: a puzzle with many missing pieces. Int J Lab Hematol. 2021;43(2):160–168. doi:10.1111/ijlh.13412
- Velazquez-Salinas L, Verdugo-Rodriguez A, Rodriguez LL, Borca MV. The role of interleukin 6 during viral infections. Front Microbiol. 2019;10:1057. doi:10.3389/fmicb.2019.01057
- Gebhard F, Pfetsch H, Steinbach G, Strecker W, Kinzl L, Brückner UB. Is interleukin 6 an early marker of injury severity following major trauma in humans? Arch Surg. 2000;135(3):291–295. doi:10.1001/archsurg.135.3.291
- Del Giudice M, Gangestad SW. Rethinking IL-6 and CRP: Why they are more than inflammatory biomarkers, and why it matters. Brain Behav Immun. 2018;70:61–75. doi:10.1016/j.bbi.2018.02.013
- Flisiak R, Arczewski M, Horban A, et al. Zalecenia diagnostyki i terapii zakażeń SARS-CoV-2 Polskiego Towarzystwa Epidemiologów i Lekarzy Chorób Zakaźnych [Recommendations for diagnosis and therapy of SARS-CoV-2 infections of the Polish society of epidemiologists and infectious disease physicians]; 2020.
- Di Castelnuovo A, Costanzo S, Antinori A, et al. Heparin in COVID-19 patients is associated with reduced in-hospital mortality: the multicenter Italian CORIST Study. Thromb Haemost. 2021;121(8):1054–1065. doi:10.1055/a-1347-6070
- Di Gennaro F, Murri R, Segala FV, et al. Attitudes towards anti-SARS-CoV2 vaccination among healthcare workers: results from a national survey in Italy. Viruses. 2021;13(3):371. doi:10.3390/v13030371
- Rabie AH, Ali SH, Ali HA, Saleh AI. A fog based load forecasting strategy for smart grids using big electrical data. Cluster Comput. 2019;22(1):241–270. doi:10.1007/s10586-018-2848-x
- Praveen Kumar D, Amgoth T, Annavarapu CSR. Machine learning algorithms for wireless sensor networks: a survey. Inf Fusion. 2019;49:1–25. doi:10.1016/j.inffus.2018.09.013
- Shen Y, Li Y, Zheng H-T, Tang B, Yang M. Enhancing ontology-driven diagnostic reasoning with a symptom-dependency-aware Naïve Bayes classifier. BMC Bioinform. 2019;20(1):330. doi:10.1186/s12859-019-2924-0
- Mansour NA, Saleh AI, Badawy M, Ali HA. Accurate detection of Covid-19 patients based on Feature Correlated Naïve Bayes (FCNB) classification strategy. J Ambient Intell Humaniz Comput. 2021. doi:10.1007/s12652-020-02883-2