
Abstract
Background
Melanoma is one of the most malignant and aggressive skin tumors, and its incidence is increasing worldwide. However, few studies have investigated the process of tumorigenesis from normal skin to melanoma.
Methods
Several bioinformatics analyses, including GEO databases, Oncomine database, TCGA database, STRING, MCODE and cytoHubba plug-ins, GEPIA, TIMER and TRRUST and DGIdb, were performed to disclose the hub genes and immunology implicated in primary melanoma tumorigenesis. Finally, immunohistochemistry (IHC) and quantitative real-time PCR (qPCR) were used to validate the results of bioinformatics analysis in vitro.
Results
A total of 295 overlapping DEGs (ODEGs) (157 upregulated and 138 downregulated) and 9 hub genes were identified between primary melanoma and normal skin tissues. Functional analysis of these 9 hub genes indicated that the genes were primarily enriched in cell chemotaxis, the chemokine-mediated signaling pathway, the extracellular region, the extracellular space, chemokine activity and CXCR3 chemokine receptor binding. KEGG pathway enrichment showed that these genes were primarily involved in the chemokine signaling pathway, cytokine–cytokine receptor interaction, the toll-like receptor signaling pathway, the cytosolic DNA-sensing pathway and the TNF signaling pathway. Upregulated CCL5, CCL4, CXCL9 and CXCL10 demonstrated good overall survival (OS), and most of them have a higher expression in stage 0 and 1 of melanoma. Moreover, immune infiltration analysis showed that the above hub genes showed a strong positive correlation between their expression and infiltration of the six immune cell subsets. Transcription factor regulation network suggested that RELA and NFKB1 are the transcription factors of CCL4, CCL5, CXCL10 and CXCL2, while IRF7, IRF3 and IRF1 are the transcription factors of CCL5 and CXCL10. Drug–gene interaction analysis identified 46 drug–gene interactions. In vitro data demonstrated that the level of CCL4, CCL5, CXCL9 and CXCL10 is higher in melanoma than that in normal skin tissues, either at tissue or cell lines level.
Conclusion
In summary, we identified 4 key chemokine members related to tumorigenesis and progression in primary melanoma, and these results may help to elucidate melanoma tumorigenesis and facilitate its treatment.
Introduction
Melanoma represents one of the most malignant skin cancers; although it only accounts for approximately 4% of skin tumors, it causes an overwhelming 75% of skin-cancer deaths worldwide.Citation1 Epidemiological survey revealed that the incidence of melanoma is increasing year by year, bringing a heavy economic burden to families and society.Citation2 At present, while there are numerous treatment strategies, such as surgery, radiotherapy, chemotherapy and targeted therapy,Citation3–Citation5 aimed at controlling the disease, the death rate from melanoma is still high due to late-stage diagnosis, thus resulting in poor response to treatment strategies.Citation6,Citation7 Novel melanoma tumorigenesis genes are required to improve the clinical management and increase life expectancy of patients. Therefore, identifying and analyzing putative candidate genes associated with the transition from normal skin to primary melanoma is particularly urgent.
In recent years, advances in microarray technology coupled with bioinformatics analysis have given researchers the ability to detect putative candidate genes associated with several disease occurrence and tumorigenesis.Citation8–Citation13 By analyzing the gene expression profiles from 2 GEO databases, Wei et al found that RNF128 in melanoma patients was significantly downregulated in both datasets, indicating that RNF128 is a reliable diagnostic and prognostic biomarker for melanoma.Citation14 Luan et al found that LncRNA, LICN00520, was significantly overexpressed in melanoma tissue. LICN00520 upregulation was negatively correlated with prognosis of melanoma patients. Their in-vitro study demonstrated that LINC00520 overexpression promotes melanoma cells proliferation, invasion and migration, suggesting that LINC00520 may act as a novel melanoma patient survival biomarker or/and therapeutic target.Citation15 Another research conducted by Su detected those three genes, CXCL8, THBS1 and KIT, may be the key genes for metastasis melanoma and thus may be the novel therapeutic targets for metastasis melanoma in the future.Citation16 Taken together, data on melanoma tumorigenesis genes can provide important information to guide treatment, pointing the way for future melanoma research.
In this study, three gene expression profiles, GSE15605, GSE46517 and GSE114445, were reanalyzed and utilized to screened or compare DEGs between primary melanoma and normal skin. Further analysis was performed through bioinformatics to identify the overlapping DEGs (ODEGs) among these three databases. Gene Ontology (GO) and Kyoto Encyclopedia of Genes and Genomes (KEGG) enrichment analyses were performed to characterize the important functional annotations and pathways of the ODEGs involved. Also, a PPI network of the ODEGs was constructed. The MCODE and CytoHubba plug-ins were used to screen the hub genes from the ODEGs. Gene Expression Profile Interactive Analysis (GEPIA) was utilized to evaluate the expression and prognosis of the hub genes in tumor samples. Subsequently, we further analyzed the hub genes related to immune cell infiltration in melanoma and explored the targeted drugs that may have therapeutic effects on melanoma. In summary, our results may provide several reliable immune-related candidate genes and drugs that could be employed to target them, which may help to establish a foundation for the treatment of melanoma.
Materials and Methods
Microarray Data
The Gene Expression Omnibus (GEO) (https://www.ncbi.nlm.nih.gov/geo/) database is a public functional genomics database of array- and sequence-based data.Citation17 Therefore, based on search term containing melanoma and inclusion criteria: (1) research type was expression profiling by array, (2) organism was restricted to Homo sapiens, (3) samples contained primary melanoma and normal skin tissue, (4) detection of gene level in tissue samples, (6) studies no less than fifteen samples in each profile. Exclusion criteria: (1) organism was from animal sapiens, (2) samples are at the stage of melanoma tissue with distant metastasis, (3) studies contain less than fifteen samples in each profile, (4) clinical data lack survival time and outcome, as well as detection of gene level. Finally, Gene expression data for primary melanoma and normal skin (GSE15605, GSE46517 and GSE114445) were obtained from GEO database. Specifically, there were 46 primary melanoma and 16 normal skin control samples in GSE15605, 31 primary melanoma and 7 normal skin control samples in GSE46517, and 16 primary melanoma and 6 normal skin control samples in GSE114445. In total, we analyzed 93 primary melanoma and 29 normal skin samples in this study. The microarray data of GSE15605, GSE114445, and GSE46517 were based on an Affymetrix U133 PLUS 2.0 array and an Affymetrix U133A microarray chip, respectively.
Identification of DEGs
The DEGs (GSE15605, GSE114445, and GSE46517) between primary melanoma and normal skin were analyzed by GEO2R (https://www.ncbi.nlm.nih.gov/geo/geo2r/). GEO2R is an interactive online tool that enables users to identify DEGs in one or more datasets,Citation18 which compare the gene expression differences between primary melanoma and normal samples with the R language GEOquery package and the limma package. And those with the threshold of |logFC|>1 and P-value <0.05 were identified as significantly differentially expressed. Next, the volcano plot was constructed at http://www.bioinformatics.com.cn, an online platform for data analysis and visualization. The Venn tool was used to obtain the ODEGs in these three databases. The common DEGs in GSE15605, GSE114445, and GSE46517 were filtered by an interactive tool for comparing lists using Venn diagrams (https://bioinfogp.cnb.csic.es/tools/venny/index.html).
GO and KEGG Pathway Enrichment Analysis
GO term enrichment analysis and KEGG pathway analysis among DEG genes were performed using the Database for Annotation, Visualization and Integrated Discovery (DAVID 6.8) tool (https://david.ncifcrf.gov/), which is an online gene enrichment tool, providing a comprehensive set of functional annotation tools for investigators to understand the biological meaning behind large list of genes.Citation19 GO consisted of three items, namely, the enriched biological process (BP), cellular component (CC) and molecular function (MF). P < 0.05 was set as the threshold value. A heatmap was plotted by online tool software http://www.ehbio.com/Cloud_Platform/front/.
Interaction Analysis of DEGs
A PPI network of the DEGs was constructed using STRING (http://string-db.org/) (version 11.0);Citation20 the data were input in the multiple protein mode, with all parameters using default values. The credibility was 0.70. The PPI network was visually analyzed using Cytoscape 3.6.1 software. Cytoscape’s plug-in Molecular Complex Detection (MCODE) (version 1.4.2) is an application that is used to cluster a given network and find densely connected regions.Citation21 After the PPI network is drawn, MCODE is used to identify the most important modules in the PPI network. The selection criteria were as follows: MCODE score > 9, node score cutoff = 0.2, degree cutoff = 2, k score = 2, and maximum depth = 100. KEGG and GO enrichment analyses were performed on the genes in this module.
Hub Gene Selection and Analysis
Hub gene selection was performed using cytoHubba, a plug-in application of Cytoscape. CytoHubba computes 11 methods to identify important nodes in PPI networks.Citation22 Genes appearing at least twice in the top 15 results of each computation method were considered hub genes. GO term and KEGG pathway enrichment further analyses were performed on the results. P < 0.05 was identified as the threshold for significant enrichment.
Expression Level of Hub Genes and Survival Analysis
GEPIA (http://gepia.cancer-pku.cn/) is an interactive online server for analyzing the RNA sequencing expression data of 9736 tumors and 8587 normal samples from the TCGA (The Cancer Genome Atlas) and the GTEx (Genotype-Tissue Expression) projects by a standard processing pipeline. We therefore used these databases to assess the hub genes expression and analysis the association between the hub genes and the overall survival (OS), as well as disease-free survival (DFS) of melanoma samples. By GEPIA, box plot graphs and survival curves were constructed to visualize the expression patterns of the hub genes and their association with prognosis. Log rank test was used to analyses the differences between the two groups. P-values <0.05 were considered to be significant.
cBioPortal Database Analysis
The cBioPortal database (www.cbioportal.org) for Cancer Genomics is an open-source resource that allows users to interactively explore multidimensional cancer genomics data sets. Based on 287 SKCM samples in TCGA, the genetic changes of hub genes were acquired via cBioPortal.
TIMER Database Analysis
Tumor Immune Estimation Resource (TIMER) is a comprehensive online resource for systematical analysis of immune infiltrates across diverse cancer types, allowing users to input specific genes to explore the correlation between gene expression and abundance of immune infiltrates (https://cistrome.shinyapps.io/timer/).Citation23 Therefore, the 9 hub genes were used to analyze particular immune cell subset (B cells, CD4+ T cells, CD8+ T cells, neutrophils, macrophages, and dendritic cells) infiltrates in SKCM samples through the TIMER database. P-values < 0.05 were considered to be significant.
Transcription Factor Regulation Network
TRRUST (https://www.grnpedia.org/trrust/) is a database of human and mouse transcriptional regulatory networks, contains 8,444 and 6552 transcription factor (TF)-target regulatory relationships of 800 human TFs and 828 mouse TFs, respectively.Citation24 The TF regulation networks of the hub genes were predicted through the TRRUST database.
Drug–Gene Interaction Analysis
The Drug–Gene Interaction Database (DGIdb) (https://www.dgidb.org/) is an online resource that consolidates disparate data sources describing drug-gene interactions and gene druggability, for mining the druggable genome for precision medicine hypothesis generation.Citation25 Next, the 9 hub genes were used to identify existing and/or potential drug substances associated with these genes through the DGIdb database.
Flowchart of Materials and Methods
The flow diagram of the analysis procedure can be found in the supplementary material Figure S1.
Quantitative Real-Time PCR (qPCR)
Total RNA was isolated using Trizol (Vazyme, China) according to the manufacturer’s instructions. Approximately 1 mg of total RNA from each sample was subjected to first-strand cDNA synthesis using a HiScript III 1st Strand cDNA Synthesis Kit (+gDNA wiper) (Vazyme, China). Real-time PCR was conducted using a SYBR Green qPCR Master Mix according to the manufacturer’s instructions (Bimake, USA). The primers for human were as follows: CCL4 forward (F)-CTCCTCATGCTAGTAGCTGCCTTC, reverse (R)-GGTGTAAGAAAAGCAGCAGGCGGT; CCL5 F: 5-GGCAGCCCTCGCTGTCATCCTCA-3, R: 5-CTTGATGTGGGCACGGGGCAGTG-3; CXCL9 F: 5-GAGTGCAAGGAACCCCAGTAG-3, R: 5-GGTGGATAGTCCCTTGGTTGG-3; CXCL10 F: 5-TGGCATTCAAGGAGTACCTCTC-3, R: 5-GGACAAAATTGGCTTGCAGGA-3; GAPDH F: 5-GGAGTCCACTGGCGTCTTCA-3, R: 5-GTCATGAGTCCTTCCACGATACC-3. Relative mRNA expression levels were calculated using the 2−ΔΔCt method and normalized to GAPDH expression levels.
Tissue Samples
Ten pairs of human melanoma tissues and adjacent normal tissues were all obtained from the Department of Dermatology, Union Hospital, Tongji Medical College (Wuhan, China) during 2020–2021. They were at least 5 cm away from the tumor site in adjacent normal tissues. And they were stored at −80°C for IHC staining. This process had fully informed consent of the patients. And this study was approved by the Institutional Review Board of Huazhong University of Science and Technology.
Immunohistochemistry (IHC)
All tissues were fixed in 4% paraformaldehyde overnight at 4°C, processed, and cut into 5-μm sections. Masked antigens were uncovered by microwaving the sections for 20 min in citrate buffer, pH 6.0. Then, endogenous peroxidases were quenched, and nonspecific antigen-binding was blocked. The slides were incubated with anti-CCL4 antibody (bs-2475R, Bioss, China), anti-CCL5 antibody (bs-1324R, Bioss, China), anti-CXCL9 antibody (bs-2551R, Bioss, China) and anti-CXCL10 (bs-1502R, Bioss, China) at 4°C overnight. After being washed with PBS (pH 7.6), the slides were treated with streptavidin peroxidase-biotinylated immunoglobulin (Thermo, USA), washed again in PBS. Staining was visualized using 3,3′-diaminobenzidine tetrahydrochloride (Servicebio, China). Counterstaining of the tissue sections was performed with hematoxylin.
Results
Identification of ODEGs
The microarray datasets GSE15605, GSE46517 and GSE114445 were obtained from the public database GEO. Overall, 3270 DEGs (including 1446 upregulated and 1824 downregulated), 1093 DEGs (including 513 upregulated and 580 downregulated), and 1241 DEGs (including 645 upregulated and 596 downregulated) were identified in the GSE15605, GSE46517 and GSE114445 datasets, respectively (supplementary material Table S1). Next, the volcano plots of DEGs are shown in –, and the expression profiles of the top 10 dysregulated genes between primary melanoma and normal skin in each sample were visualized in a heatmap (–).
Figure 1 Identification and analysis of ODEGs. (A–C) Volcano plot of the DEGs in GSE15605, GSE46517 and GSE114445. Red and green indicate upregulated and downregulated genes (P < 0.05, Log2FC ≥ 1 or ≤ −1, FC, fold-change threshold), respectively. (D–F) Heatmaps of the top 10 dysregulated genes in each sample of the three datasets. The color scale represents the upregulation (red) or downregulation (blue) of expression. (G) Venn diagram of the ODEGs in the three datasets. (H–I) GO enrichment analyses of the upregulated (H) and downregulated (I) ODEGs. (J and K) KEGG pathway enrichment analyses of the upregulated (J) and downregulated (K) ODEGs. Count, number of DEGs.
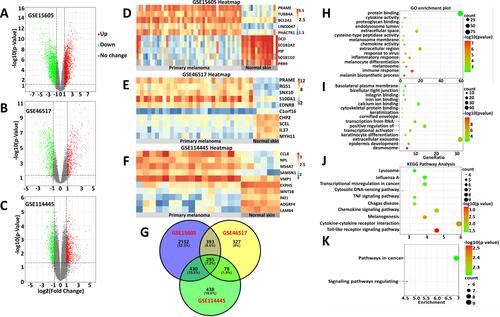
Based on these DEGs from the three datasets, we detected 295 ODEGs (157 upregulated and 138 downregulated), as illustrated by a Venn diagram (). Furthermore, these ODEGs were analyzed by GO enrichment (Table S1) and demonstrated that the upregulated genes were primarily enriched in the melanin biosynthetic process, the immune response, melanosomes, melanocyte differentiation and the inflammatory response (); the downregulated genes were primarily enriched in desmosomes, epidermis development, extracellular exosomes, keratinocyte differentiation and transcriptional activator activity, and RNA polymerase II core promoter proximal region sequence-specific binding (). Further KEGG pathway (Table S1) analysis of these DEGs primarily revealed enrichment of the upregulated genes in the Toll-like receptor signaling pathway, cytokine-–cytokine receptor interactions, melanogenesis and the chemokine signaling pathway (); the downregulated genes were primarily enriched in signaling pathways regulating the pluripotency of stem cells and pathways in cancer (). These results suggested that melanogenesis-relevant biological behavior, the immune response and several signaling pathways play a significant role in primary melanoma tumorigenesis.
PPI Network Construction and the Hub Genes Analysis
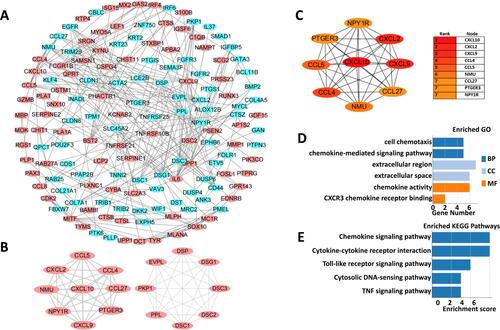
To further explore the interactions among melanoma tumorigenesis related ODEGs, all the ODEGs of three datasets were inputted and analyzed by the online website STRING, with 0.700 (high confidence) as the minimum required interaction score, and the effect of free proteins was removed. Then, a PPI (Protein–Protein Interaction Networks) network was constructed through Cytoscape software. The network consisted of 149 nodes and 510 lines (). Next, the PPI network was further analyzed among the ODEGs through MCODE with a threshold of MCODE score ≥ 8 and nodes ≥ 8; thus, 2 most important modules were extracted from the PPI network, including module 1 (Score = 9, nodes = 9) and module 2 (Score = 8, nodes = 8) (). Next, the most important modules were selected for further analysis and identification of hub genes through CytoHubba, and the top 10 results in each of the 12 methods (ie, MCC, DMNC, MNC, Degree, EPC, Bottleneck, Eccentricity, Closeness, Radiality, Betweenness, Stress, and Clustering Coefficient) in parameters were sorted, and genes appearing at least third in the top 10 results of each computation method and MCODE score ≥ 8 were considered to be hub genes; thus, 9 hub genes were identified, specifically CXCL10, CXCL9, CCL4, CXCL2, CCL5, NPY1R, PTGER3, NMU, CCL27 (). Next, functional analysis of these 9 hub genes indicated that the genes were primarily enriched in cell chemotaxis, the chemokine-mediated signaling pathway, the extracellular region, the extracellular space, chemokine activity and CXCR3 chemokine receptor binding (). KEGG pathway enrichment showed that these genes were primarily involved in the chemokine signaling pathway, cytokine–cytokine receptor interaction, the Toll-like receptor signaling pathway, the cytosolic DNA-sensing pathway and the TNF signaling pathway (). All these results further suggested that the inflammatory response, immune response and transcriptional activity play an important role in primary melanoma tumorigenesis.
Figure 2 PPI networks of ODEGs and hub genes analysis (A) the PPI network of the ODEGs, Red and blue indicate upregulated and downregulated genes, respectively. (B) The two modules extracted from the PPI network with the highest score. (C) The 9 hub genes were analyzed using CytoHubba. (D and E) GO function and KEGG pathway analysis of hub genes.
Verification of the Expression Patterns and Prognostic Values of Hub Genes
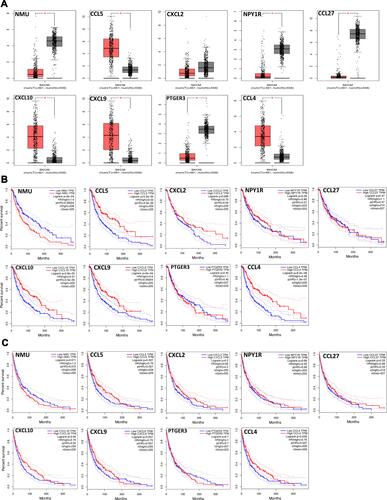
Based on the above results, we found that 9 key genes may play an important role in the switching process from normal skin to primary melanoma tumorigenesis. Thus, to further verify them, the expression patterns of 9 genes in melanoma and normal skin samples were evaluated, and the association of the 9 genes with prognosis was determined using the GEPIA database. The results showed that CCL5, CCL4, CXCL10, and CXCL9 were upregulated () and demonstrated good OS () in melanoma samples, while NMU, CXCL2, NPY1R, CCL27, and PEGER3 were downregulated (), and only NMU was associated with worse OS () in melanoma samples. Moreover, CCL5, CCL4, CXCL10, and CXCL9 upregulation in melanoma samples was associated with good DFS (), although no significance of CXCL10 or CXCL9 was observed in DFS. These results were further validated by Oncomine database (supplementary material Figure S2). In addition, we further analyzed the relationship of between hub genes with better OS and clinical stage of melanoma. Our results indicated that CCL4, CCL5, CXCL9 and CXCL10 are closely related to the clinical stage of melanoma (p < 0.05), while NMU is not (p > 0.05). Notably, CCL4, CXCL9 and CXCL10 have a higher expression in stage 0 and I (supplementary material Figure S3). The relationship of these molecules, CCL4, CCL5, CXCL9, and CXCL10, with the BRAF mutation in melanoma was then investigated further using the cBioPortal database, and the results revealed that there was no link between the expression level of CCL4, CXCL9/10 and the BRAF mutation in melanoma, while CCL5 expression was negatively related to BRAF mutation (supplementary material Figure S4). Our data reveal that these chemokines mainly played their roles in primary melanoma.
Figure 3 Validation of the 9 hub genes in TCGA. (A) The expression patterns of 9 hub genes in melanoma vs normal skin samples. (B) OS curves of 9 hub genes in melanoma samples; (C) DFS curves of 9 hub genes in melanoma samples. P-values < 0.05 were considered to be significant.
Immune Infiltration Analysis
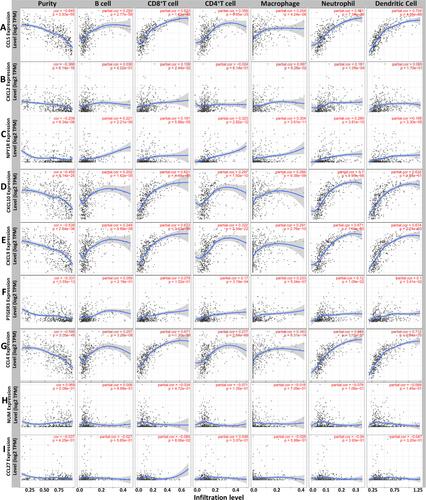
Our results revealed that the inflammatory and immune response may play an important role in this process. An increasing body of evidence suggests that the tumorigenesis, progression and metastasis of melanoma are closely associated with tumor microenvironment.Citation26–Citation30 Thus, the 9 hub genes and immune infiltration levels were further analyzed through the TIMER database to assess the correlation between them in melanoma. The results of this analysis indicated that there was a positive correlation between CXCL2 expression and the infiltration of CD8+ T cells (Cor = 0.108, p = 2.44e−02) and neutrophils (Cor = 0.181, p = 1.05e−04; ). PTGER3 expression was positively associated with the infiltration of CD4+ T cells (Cor = 0.17, p = 3.19e-04), macrophage cells (Cor = 0.233, p = 5.04e-07), neutrophil cells (Cor = 0.12, p = 1.09e-02) and dendritic cells (Cor = 0.1, p = 3.41e-02; ), while a correlation between NMU and CCL27 and the immune cell infiltration level was not observed (–). However, five genes, CCL5, NPY1R, CXCL10, CXCL9, and CCL4, showed a strong positive correlation between their expression and infiltration of the six immune cell subsets (, – and ). These results showed that 7 genes are closely associated with the immune infiltration process of melanoma.
Figure 4 Differently expressed prognostic genes are correlated with the level of immune infiltration. The correlation between the differentially expressed prognostic genes and immune cell infiltration of (A–I) CCL5, CXCL2, NPY1R, CXCL10, CXCL9, PTGER3, CCL4, NMU and CCL27.
Transcription Factor Regulation Network
Based on our results, the transcriptional regulation was also enriched during the initiation of melanoma. The dysregulation of numerous signaling pathways can induce changes in mRNA transcription and drive melanoma initiation and progression.Citation31 Next, we further identified the potential transcriptional regulatory networks associated with the hub genes through TRRUST (version 2), which is an open database of human transcriptional regulatory networks. We determined that CCL4, CCL5, CXCL10 and CXCL2 were the key targets of the transcription factors RELA and NFKB1, while CCL5 and CXCL10 were the key targets of the transcription factors IRF7, IRF3 and IRF1 (). RELA is an important member of NF-kB family, which plays a vital role in regulating the transcription of target genes including the notable proinflammatory cytokines, such as CCL4, CCL5, CXCL10 and CXCL2, which promote an antitumor immunity.Citation32
Table 1 Key TFs of Hub Genes
Drug–Gene Interaction Analysis
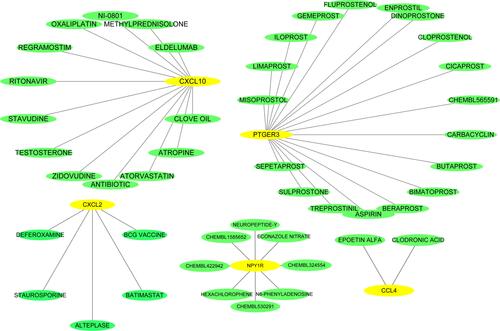
Next, further investigation was conducted using 9 hub genes to explore the possible drugs for melanoma therapy through the DGIdb database. Overall, 46 drug–gene interactions were identified, which were associated with 5 genes (CXCL2, NPY1R, CXCL10, PTGER3, and CCL4). These relationships were further visualized through Cytoscape (), whereas the genes CCL5, CXCL9, NMU and CCL27 did not show drug–gene interactions.
Figure 5 Drug–hub gene interaction network. Yellow and green ellipses represent hub genes and drugs, respectively.
Validation by qPCR and IHC Staining in vitro
QPCR was performed to validate the mRNA expression of four hub chemokines in melanoma cell lines and normal melanocytes HEM. The results were consistent with Oncomine database, and indicated that they were abundant in the melanoma cell lines with less metastasis (supplementary material Figure S5). In addition, IHC staining showed that elevated CCL4/5 and CXCL9/10 expression in the melanoma tissues than that in the adjacent normal skin tissues, which was consistent with qPCR results (supplementary material Figure S6).
Discussion
In this study, there GEO datasets, GSE15605, GSE46517 and GSE114445, were selected for bioinformatics analysis. GSE15605 dataset identified novel prognostic marker HMGA2, whose overexpression is strongly associated with regional and distant metastases and serves as an independent predictor of disease-free survival and overall survival in melanoma.Citation33 GSE46517 dataset supported the thesis that integrated genomic and pathological analyses of staged melanomas provide a productive entry point for discovery of melanoma metastases genes through functional validation results and correlative analysis of human tissues.Citation34 And, GSE114445 dataset suggested that the increased immunosuppressive microenvironment may contribute to the proliferation of melanoma cells, and targeting these suppressive immune cell types may represent an alternative avenue for future immunotherapy.Citation35 Gene expression in these datasets was analyzed between primary melanoma and normal skin, and 9 hub genes were detected in all three datasets, and may have a crucial role during melanoma tumorigenesis. Functional annotation indicated that these hub genes were primarily related to cell chemotaxis, the chemokine-mediated signaling pathway and CXCR3 chemokine receptor binding. The enrichment of genes in KEGG pathway showed that they were primarily associated with the chemokine signaling pathway, cytokine–cytokine receptor interaction, the Toll-like receptor signaling pathway and the TNF signaling pathway. This suggests that chemokines and chemokine-mediated signaling pathway may play an important role in tumor progression. Chemokines are a group of small proteins (~8-14 kDa) that induce chemotaxis, regulate cell proliferation and differentiation of various types of leukocytes via interaction with a subset of G protein–coupled receptors,Citation36 whose main function is related to inflammation and immunity.
CXCL10, a ligand of CXC chemokine receptor-3 (CXCR3), can be secreted by multiple cell types, mainly including T helper cells (Th cells), cytotoxic T lymphocytes (CTLs), dendritic cells, macrophages, natural killer cells (NKs) and some cancer cells.Citation37 CXCL10 is frequently expressed in human disorders affecting inflammation, adaptive immunity, angiogenesis and tumorigenesis.Citation38 Compared with controls, treatment with CXCL10 significantly reduced melanoma tumor growth in C57BL/6 mice in vivo and reduced melanoma cell invasion in vitro.Citation39 CXCL10 deficient mice infected with dengue virus showed a higher mortality rate compared to wild-type mice.Citation40 CXCL9, another ligand of CXCR3, can inhibit tumor growth by inducing lymphocytic infiltration to the focal sites.Citation41 CXCL9 deficient cancer cells are more tumorigenic compared with cancer cells expressing CXCL9.Citation41 Both CXCR3 and CXCL9 deficient mice are susceptible to immune-mediated kidney disease.Citation42 All the results suggested that CXCL9/CXCL10/CXCR3 signaling contribute to anticancer cytotoxic activity. Moreover, both CXCR3 ligands were shown to strengthen the response to some immunotherapy drugs, such as pembrolizumab, nivolumab, atezolizumab and ipilimumab, which are against immune checkpoint PD-1 or CTLA-4.Citation43 These data showed the importance of the CXCL9/CXCL10/CXCR3 axis, which created an opportunity to regulate chemokine expression in the process of tumor therapy and prevention. In addition, we found that the downregulated NMU was associated with worse OS, while upregulated CCL4, CCL5, CXCL9 and CXCL10 were related to better OS in melanoma patients, these results indicated that chemokine members (CCL4, CCL5, CXCL9 and CXCL10) and NMU could play important roles in melanoma initiation and development. CXCL9 and CXCL10 are ELR(Glu-Leu-Arg) motif-negative CXC chemokines secreted by multiple cell types, and could ameliorate angiogenesis and tumor growth in various cancers, such as gastric,Citation44 prostate,Citation45 lung,Citation46 cervical cancerCitation47 and melanoma,Citation39 suggesting that they are important biomarkers in melanoma tumorigenesis.
Melanoma is frequently infiltrated by inflammatory and immune cells, therefore promoting or inhibiting tumor growth.Citation39 We observed that CXCL2 and PTGER3 was positively associated with partial infiltration of cells, and the genes CCL5, NPY1R, CXCL10, CXCL9 and CCL4 were all positively correlated with the infiltration of 6 immune cell types, including B cells, CD8+ T cells, CD4+ T cells, macrophages, neutrophils and dendritic cells. In colorectal cancer, CXCL10 was found to be related to CXCR3+CD8+ T cells and IFN-γ+CD4+ T cells of the tumor site, potentiating anti-tumor activity through production of Granzyme B and IFN-γ from CD8+ T cells and CD4+ T cells, respectively.Citation48 Treatment CXCL10-Ig to mice engrafted with myeloma cells can significantly inhibit the tumor growth by reducing the number of Treg cells and accumulating CD4+, CD8+ and NK cells at the tumor site.Citation49 Another study showed that CCL5 secreted by cancer cells, following recruiting NK cells to the tumor site, acts its function via paracrine signaling.Citation50 CCL4/CCL5 interact with their receptor CCR1/CCR5, which facilitates the recruitment of γδ T cells from peripheral blood and/or peritumoral regions to the tumor sites, thus enhancing the antitumor immunity and improving patients’ prognosis.Citation51 All the findings suggested that CCL4, CXCL10 and CCL5 may be potent biomarkers or targets for melanoma.
In addition, dysregulation of transcription can drive a wide range of diseases. Our results showed that RELA and NFKB1 could be the key transcription factors of CCL4, CCL5, CXCL10 and CXCL2; IRF7, IRF3 and IRF1 are the key TFs associated with CCL5 and CXCL10. NF-κB is a heterodimer composed of the RELA (p65) and NFKB1 (p50) subunits that belong to the Rel/NF-κB family of transcription factors. Several studies have demonstrated that RELA and NFKB1 play important roles in the control of cell proliferation and apoptosis and, hence, oncogenesis,Citation52,Citation53 and its activity significantly contributes to the tumorigenicity, angiogenesis, and metastasis of human melanoma cells.Citation54 Interferon regulatory factors (IRFs) are a family of homologous proteins that play key roles in mediating signal transduction associated with the immune response and immunomodulation in Homo sapiens.Citation55 Accordingly, IRF1 and IRF2 could promote the response of Th1 cells, whereas IRF3 and IRF7 are involved in antibacterial and antiviral innate immunity,Citation56 suggesting that they are vital elements of the immune system in disease.
To further understand and find the potent drugs of melanoma, we explored the drug–gene interactions based on the DGIdb database, 46 drugs associated with 5 genes (CXCL2, NPY1R, CXCL10, PTGER3, and CCL4) in melanoma were identified. Oxaliplatin, for instance, is widely used to treat gastrointestinal and other malignancies. Concomitant treatment of anti-PD-1 (an immune-checkpoint inhibitor) with trifluridine/tipiracil (FTD/TPI, a new antimetabolite agent), oxaliplatin can be synergized to promote induced immunogenic cell death (ICD). This enhances the antitumor efficacy of dual chemotherapy in both mice and human colon carcinoma cell lines.Citation57 Clinical trials have also revealed that adjuvant oxaliplatin, leucovorin, fluorouracil bolus and fluorouracil infusion improved DFS in patients with rectal cancer after receiving preoperative chemoradiotherapy.Citation58 Moreover, beraprost, a chemically stable and orally active prostacyclin analog, is often used to treat chronic arterial occlusive disease. Interestingly, a recent study showed that mice with melanoma were treated with beraprost for 3 weeks, the number and size of lung tumor metastases are significantly reduced. And, beraprost treatment also raised the number of tumor-related pericytes and improved intratumor hypoxia which was validated by scanning electron microscopy and immunohistochemistry.Citation59 These data suggest that drug–gene interaction pairs we predicted may be of value, revealing the potential candidate for melanoma treatment.
Conclusion
In our study, we identified 9 hub genes associated with tumorigenesis and progression in melanoma. They were closely associated with several immune cell infiltrates and could be regulated by several transcription factors. Taken together, our findings will provide new understanding for melanoma immunotherapy, assisting the doctors in making decision and selecting efficacious drug. However, further in vitro and in vivo studies should be performed to verify the roles played by these 9 hub genes and analyze their roles in the tumorigenesis of melanoma.
Author Contributions
All authors contributed to data analysis, drafting or revising the article, gave final approval of the version to be published, agreed to the submitted journal, and agreed to be accountable for all aspects of the work.
Disclosure
All authors declare no conflicts of interest.
Additional information
Funding
References
- Davis LE, Shalin SC, Tackett AJ. Current state of melanoma diagnosis and treatment. Cancer Biol Ther. 2019;20(11):1366–1379. doi:10.1080/15384047.2019.1640032
- Tripp MK, Watson M, Balk SJ, Swetter SM, Gershenwald JE. State of the science on prevention and screening to reduce melanoma incidence and mortality: the time is now. CA Cancer J Clin. 2016;66(6):460–480. doi:10.3322/caac.21352
- Wei CY, Zhu MX, Lu NH, et al. Bioinformatics-based analysis reveals elevated MFSD12 as a key promoter of cell proliferation and a potential therapeutic target in melanoma. Oncogene. 2019;38(11):1876–1891. doi:10.1038/s41388-018-0531-6
- Hutchinson KE, Lipson D, Stephens PJ, et al. BRAF fusions define a distinct molecular subset of melanomas with potential sensitivity to MEK inhibition. Clin Cancer Res. 2013;19(24):6696–6702. doi:10.1158/1078-0432.CCR-13-1746
- Andrews MC, Cursons J, Hurley DG, et al. Systems analysis identifies miR-29b regulation of invasiveness in melanoma. Mol Cancer. 2016;15(1):72. doi:10.1186/s12943-016-0554-y
- Bray F, Ferlay J, Soerjomataram I, Siegel RL, Torre LA, Jemal A. Global cancer statistics 2018: GLOBOCAN estimates of incidence and mortality worldwide for 36 cancers in 185 countries. CA Cancer J Clin. 2018;68(6):394–424. doi:10.3322/caac.21492
- Schadendorf D, van Akkooi ACJ, Berking C, et al. Melanoma. Lancet. 2018;392(10151):971–984. doi:10.1016/S0140-6736(18)31559-9
- Choudhary S, Pradhan D, Khan NS, Singh H, Thomas G, Jain AK. Decoding psoriasis: integrated bioinformatics approach to understand hub genes and involved pathways. Curr Pharm Des. 2020;26(29):3619–3630. doi:10.2174/1381612826666200311130133
- Harripaul R, Vasli N, Mikhailov A, et al. Mapping autosomal recessive intellectual disability: combined microarray and exome sequencing identifies 26 novel candidate genes in 192 consanguineous families. Mol Psychiatry. 2018;23(4):973–984. doi:10.1038/mp.2017.60
- Avelar RA, Ortega JG, Tacutu R, et al. A multidimensional systems biology analysis of cellular senescence in aging and disease. Genome Biol. 2020;21(1):91. doi:10.1186/s13059-020-01990-9
- Oerton E, Bender A. Concordance analysis of microarray studies identifies representative gene expression changes in Parkinson’s disease: a comparison of 33 human and animal studies. BMC Neurol. 2017;17(1):58. doi:10.1186/s12883-017-0838-x
- Xu C, Meng LB, Duan YC, et al. Screening and identification of biomarkers for systemic sclerosis via microarray technology. Int J Mol Med. 2019;44(5):1753–1770. doi:10.3892/ijmm.2019.4332
- Ball SL, Cockell SJ, Wilson JA, Mann DA, Fisher AJ. Microarray analysis of primary epithelial and fibroblast cells in chronic rhinosinusitis without nasal polyps. Rhinology. 2020;58(6):581–587. doi:10.4193/Rhin19.319
- Wei CY, Zhu MX, Yang YW, et al. Downregulation of RNF128 activates Wnt/beta-catenin signaling to induce cellular EMT and stemness via CD44 and CTTN ubiquitination in melanoma. J Hematol Oncol. 2019;12(1):21. doi:10.1186/s13045-019-0711-z
- Luan W, Ding Y, Yuan H, et al. Long non-coding RNA LINC00520 promotes the proliferation and metastasis of malignant melanoma by inducing the miR-125b-5p/EIF5A2 axis. J Exp Clin Cancer Res. 2020;39(1):96. doi:10.1186/s13046-020-01599-7
- Su W, Guan Y, Huang B, et al. Bioinformatic analysis reveals hub genes and pathways that promote melanoma metastasis. BMC Cancer. 2020;20(1):863. doi:10.1186/s12885-020-07372-5
- Edgar R, Domrachev M, Lash AE. Gene Expression Omnibus: NCBI gene expression and hybridization array data repository. Nucleic Acids Res. 2002;30(1):207–210. doi:10.1093/nar/30.1.207
- Barrett T, Wilhite SE, Ledoux P, et al. NCBI GEO: archive for functional genomics data sets–update. Nucleic Acids Res. 2013;41(Database issue):D991–5. doi:10.1093/nar/gks1193
- Da huang W, Sherman BT, Lempicki RA. Bioinformatics enrichment tools: paths toward the comprehensive functional analysis of large gene lists. Nucleic Acids Res. 2009;37(1):1–13. doi:10.1093/nar/gkn923
- Szklarczyk D, Gable AL, Lyon D, et al. STRING v11: protein-protein association networks with increased coverage, supporting functional discovery in genome-wide experimental datasets. Nucleic Acids Res. 2019;47(D1):D607–D13. doi:10.1093/nar/gky1131
- Bandettini WP, Kellman P, Mancini C, et al. MultiContrast Delayed Enhancement (MCODE) improves detection of subendocardial myocardial infarction by late gadolinium enhancement cardiovascular magnetic resonance: a clinical validation study. J Cardiovasc Magn Reson. 2012;14:83. doi:10.1186/1532-429X-14-83
- Chin CH, Chen SH, Wu HH, Ho CW, Ko MT, Lin CY. cytoHubba: identifying hub objects and sub-networks from complex interactome. BMC Syst Biol. 2014;8 Suppl 4:S11. doi:10.1186/1752-0509-8-S4-S11
- Li T, Fan J, Wang B, et al. TIMER: a web server for comprehensive analysis of tumor-infiltrating immune cells. Cancer Res. 2017;77(21):e108–e10. doi:10.1158/0008-5472.CAN-17-0307
- Han H, Cho JW, Lee S, et al. TRRUST v2: an expanded reference database of human and mouse transcriptional regulatory interactions. Nucleic Acids Res. 2018;46(D1):D380–D86. doi:10.1093/nar/gkx1013
- Wagner AH, Coffman AC, Ainscough BJ, et al. DGIdb 2.0: mining clinically relevant drug-gene interactions. Nucleic Acids Res. 2016;44(D1):D1036–44. doi:10.1093/nar/gkv1165
- Marzagalli M, Ebelt ND, Manuel ER. Unraveling the crosstalk between melanoma and immune cells in the tumor microenvironment. Semin Cancer Biol. 2019;59:236–250. doi:10.1016/j.semcancer.2019.08.002
- Wolf Y, Bartok O, Patkar S, et al. UVB-induced tumor heterogeneity diminishes immune response in melanoma. Cell. 2019;179(1):219–35 e21. doi:10.1016/j.cell.2019.08.032
- Gartrell-Corrado RD, Chen AX, Rizk EM, et al. Linking transcriptomic and imaging data defines features of a favorable tumor immune microenvironment and identifies a combination biomarker for primary melanoma. Cancer Res. 2020;80(5):1078–1087. doi:10.1158/0008-5472.CAN-19-2039
- Zhang Y, Kurupati R, Liu L, et al. Enhancing CD8(+) T cell fatty acid catabolism within a metabolically challenging tumor microenvironment increases the efficacy of melanoma immunotherapy. Cancer Cell. 2017;32(3):377–91e9. doi:10.1016/j.ccell.2017.08.004
- Gide TN, Wilmott JS, Scolyer RA, Long GV. Primary and acquired resistance to immune checkpoint inhibitors in metastatic melanoma. Clin Cancer Res. 2018;24(6):1260–1270. doi:10.1158/1078-0432.CCR-17-2267
- Gupta R, Janostiak R, Wajapeyee N. Transcriptional regulators and alterations that drive melanoma initiation and progression. Oncogene. 2020;39(48):7093–7105. doi:10.1038/s41388-020-01490-x
- Tokunaga R, Zhang W, Naseem M, et al. CXCL9, CXCL10, CXCL11/CXCR3 axis for immune activation - a target for novel cancer therapy. Cancer Treat Rev. 2018;63:40–47. doi:10.1016/j.ctrv.2017.11.007
- Raskin L, Fullen DR, Giordano TJ, et al. Transcriptome profiling identifies HMGA2 as a biomarker of melanoma progression and prognosis. J Invest Dermatol. 2013;133(11):2585–2592. doi:10.1038/jid.2013.197
- Kabbarah O, Nogueira C, Feng B, et al. Integrative genome comparison of primary and metastatic melanomas. PLoS One. 2010;5(5):e10770. doi:10.1371/journal.pone.0010770
- Yan BY, Garcet S, Gulati N, et al. Novel immune signatures associated with dysplastic naevi and primary cutaneous melanoma in human skin. Exp Dermatol. 2019;28(1):35–44. doi:10.1111/exd.13805
- Zlotnik A, Yoshie O. Chemokines: a new classification system and their role in immunity. Immunity. 2000;12(2):121–127. doi:10.1016/s1074-7613(00)80165-x
- Bagheri H, Pourhanifeh MH, Derakhshan M, et al. CXCL-10: a new candidate for melanoma therapy? Cell Oncol (Dordr). 2020;43(3):353–365. doi:10.1007/s13402-020-00501-z
- Groom JR, Luster AD. CXCR3 ligands: redundant, collaborative and antagonistic functions. Immunol Cell Biol. 2011;89(2):207–215. doi:10.1038/icb.2010.158
- Antonicelli F, Lorin J, Kurdykowski S, et al. CXCL10 reduces melanoma proliferation and invasiveness in vitro and in vivo. Br J Dermatol. 2011;164(4):720–728. doi:10.1111/j.1365-2133.2010.10176.x
- Hsieh MF, Lai SL, Chen JP, et al. Both CXCR3 and CXCL10/IFN-inducible protein 10 are required for resistance to primary infection by dengue virus. J Immunol. 2006;177(3):1855–1863. doi:10.4049/jimmunol.177.3.1855
- Gorbachev AV, Kobayashi H, Kudo D, et al. CXC chemokine ligand 9/monokine induced by IFN-gamma production by tumor cells is critical for T cell-mediated suppression of cutaneous tumors. J Immunol. 2007;178(4):2278–2286. doi:10.4049/jimmunol.178.4.2278
- Menke J, Zeller GC, Kikawada E, et al. CXCL9, but not CXCL10, promotes CXCR3-dependent immune-mediated kidney disease. J Am Soc Nephrol. 2008;19(6):1177–1189. doi:10.1681/ASN.2007111179
- Curran MA, Montalvo W, Yagita H, Allison JP. PD-1 and CTLA-4 combination blockade expands infiltrating T cells and reduces regulatory T and myeloid cells within B16 melanoma tumors. Proc Natl Acad Sci USA. 2010;107(9):4275–4280. doi:10.1073/pnas.0915174107
- Verbeke H, Geboes K, Van Damme J, Struyf S. The role of CXC chemokines in the transition of chronic inflammation to esophageal and gastric cancer. Biochim Biophys Acta. 2012;1825(1):117–129. doi:10.1016/j.bbcan.2011.10.008
- Nagpal ML, Davis J, Lin T. Overexpression of CXCL10 in human prostate LNCaP cells activates its receptor (CXCR3) expression and inhibits cell proliferation. Biochim Biophys Acta. 2006;1762(9):811–818. doi:10.1016/j.bbadis.2006.06.017
- Li G, Tian L, Hou JM, et al. Improved therapeutic effectiveness by combining recombinant CXC chemokine ligand 10 with Cisplatin in solid tumors. Clin Cancer Res. 2005;11(11):4217–4224. doi:10.1158/1078-0432.CCR-04-2117
- Zhao M, Ma Q, Xu J, et al. Combining CXCL10 gene therapy and radiotherapy improved therapeutic efficacy in cervical cancer HeLa cell xenograft tumor models. Oncol Lett. 2015;10(2):768–772. doi:10.3892/ol.2015.3281
- Zumwalt TJ, Arnold M, Goel A, Boland CR. Active secretion of CXCL10 and CCL5 from colorectal cancer microenvironments associates with GranzymeB+ CD8+ T-cell infiltration. Oncotarget. 2015;6(5):2981–2991. doi:10.18632/oncotarget.3205
- Barash U, Zohar Y, Wildbaum G, et al. Heparanase enhances myeloma progression via CXCL10 downregulation. Leukemia. 2014;28(11):2178–2187. doi:10.1038/leu.2014.121
- Noman MZ, Berchem G, Janji B. Targeting autophagy blocks melanoma growth by bringing natural killer cells to the tumor battlefield. Autophagy. 2018;14(4):730–732. doi:10.1080/15548627.2018.1427398
- Zhao N, Dang H, Ma L, et al. Intratumoral gammadelta T-Cell Infiltrates, Chemokine (C-C Motif) Ligand 4/Chemokine (C-C Motif) Ligand 5 Protein expression and survival in patients with Hepatocellular carcinoma. Hepatology. 2021;73(3):1045–1060. doi:10.1002/hep.31412
- Luque I, Gelinas C. Rel/NF-kappa B and I kappa B factors in oncogenesis. Semin Cancer Biol. 1997;8(2):103–111. doi:10.1006/scbi.1997.0061
- Gilmore TD, Koedood M, Piffat KA, White DW. Rel/NF-kappaB/IkappaB proteins and cancer. Oncogene. 1996;13(7):1367–1378.
- Huang S, DeGuzman A, Bucana CD, Fidler IJ. Nuclear factor-kappaB activity correlates with growth, angiogenesis, and metastasis of human melanoma cells in nude mice. Clin Cancer Res. 2000;6(6):2573–2581.
- Antonczyk A, Krist B, Sajek M, et al. Direct inhibition of IRF-dependent transcriptional regulatory mechanisms associated with disease. Front Immunol. 2019;10:1176. doi:10.3389/fimmu.2019.01176
- Taniguchi T, Ogasawara K, Takaoka A, Tanaka N. IRF family of transcription factors as regulators of host defense. Annu Rev Immunol. 2001;19:623–655. doi:10.1146/annurev.immunol.19.1.623
- Limagne E, Thibaudin M, Nuttin L, et al. Trifluridine/tipiracil plus oxaliplatin improves PD-1 blockade in colorectal cancer by inducing immunogenic cell death and depleting macrophages. Cancer Immunol Res. 2019;7(12):1958–1969. doi:10.1158/2326-6066.CIR-19-0228
- Hong YS, Kim SY, Lee JS, et al. Oxaliplatin-based adjuvant chemotherapy for rectal cancer after preoperative chemoradiotherapy (ADORE): long-term results of a randomized controlled trial. J Clin Oncol. 2019;37(33):3111–3123. doi:10.1200/JCO.19.00016
- Minami Y, Sasaki T, Bochimoto H, et al. Prostaglandin I2 analog suppresses lung metastasis by recruiting pericytes in tumor angiogenesis. Int J Oncol. 2015;46(2):548–554. doi:10.3892/ijo.2014.2783