
Abstract
Purpose
The metabolic score for insulin resistance (METS-IR) index is an emerging surrogate predictor of type 2 diabetes mellitus (T2DM). This study aimed to evaluate the association between the METS-IR index and the risk of T2DM in non-obese Japanese adults.
Methods
A total of 12,290 non-obese participants were selected from the NAGALA prospective cohort study conducted from 2004 to 2015. Cox proportional hazards models were used to assess the association between the baseline METS-IR index and risk of T2DM. Generalized additive models were used to identify nonlinear relationships. In addition, we performed subgroup analyses and interaction tests. Results were expressed as hazard ratios (HRs) and 95% confidence intervals (CIs).
Results
During a median follow-up of 2050 days, 176 (1.43%) incident T2DM occurred. The fully adjusted HR (95% CI) for the incidence of T2DM in non-obese adults was 1.17 (HR=1.17, 95% CI: 1.09–1.27, P<0.001) for every 1-unit increase in the METS-IR index. The risk of developing T2DM increased with the quartile of change in the METS-IR index, after adjustment for multiple potential confounding, the HRs for the Q4 group versus the Q1 group was 4.01 (95% CI, 1.39–11.57). Generalized additive models also showed a cumulative increase in the risk of T2DM with increasing the METS-IR index. Time-dependent receiver operating curve suggested helpful discriminative power of the METS-IR index for T2DM. The C-statistics by the clinical risk factors significantly improve with the addition of the METS-IR index (from 0.862 to 0.875, P = 0.035); the discriminatory power and risk reclassification also appeared to be substantially better, with the category-free NRI of 0.216, and the IDI of 0.011.
Conclusion
The METS-IR index was a significant and independent predictor for future T2DM development in non-obese adults. The METS-IR index may have clinical significance in identifying groups at high risk of T2DM.
Introduction
Type 2 diabetes mellitus (T2DM) is a major concern in healthcare worldwide due to its high prevalence and severe complications.Citation1,Citation2 In 2017, approximately 462 million people were affected by T2DM, which corresponds to a prevalence of 6059 cases per 100,000 people. It is predicted to increase to 7079 per 100,000 people by 2030, reflecting a continued rising and showing no signs of stabilization worldwide.Citation3,Citation4 To make matters worse, T2DM can affect an individual’s functional capacity and quality of life, leading to significant morbidity and even premature death.Citation5,Citation6 However, the development of T2DM and related outcomes can be prevented or delayed by timely lifestyle modifications and appropriate pharmacological interventions, which require effective screening strategies and early detection of individuals at high risk for T2DM.Citation7
Obesity is a known risk for the progression of T2DM.Citation8,Citation9 Many mechanisms have been reported regarding the relationship between obesity and T2DM, including relative deficiency of insulin resistance and insulin action.Citation9 Therefore, weight loss in obese individuals is effective in controlling T2DM and even for normoglycemic levels.Citation10 In fact, a large number of people with T2DM, especially in Asia, are not obese. Up to 50% of Asian type 2 diabetic patients have a BMI <25 kg/m2.Citation11,Citation12 Notably, non-obese diabetics have a similar increased risk of cardiovascular disease as obese diabetics.Citation13 In addition, a meta-analysis showed that adults who were normal weight at the time of diabetes had higher cardiovascular and non-cardiovascular mortality than overweight or obese adults.Citation14 Thus, non-obese diabetes may have underlying pathophysiological changes that may lead to a worse prognosis than obese diabetes.Citation11,Citation15 However, the possible mechanisms explaining this phenomenon remain to be elucidated.
Prospective studies have shown that insulin resistance (IR) remains the primary pathogenesis of T2DM, and that it is present years before diagnosis.Citation16,Citation17 Clearly, accurate measurement of IR can improve the prediction of T2DM progression.Citation18 The most common direct method for measuring IR is the hyperinsulinemic-euglycemic clamp, which is complex, impractical, and invasive.Citation19 The homeostasis model assessment for insulin resistance (HOMA-IR) index is the most widely used indirect method, but is susceptible to the accuracy of insulin measurements and has poor reproducibility.Citation20,Citation21 Imaging techniques such as computed tomography and magnetic resonance imaging can accurately measure adipose tissue distribution and quantify adipose tissue.Citation19 However, none of these techniques are inexpensive and cannot be used in large epidemiological studies.Citation22 Therefore, a simpler, more accurate, and more practical IR metric is needed. In recent years, the metabolic score for insulin resistance (METS-IR) index, considering fasting plasma glucose (FPG), lipid profile, and adiposity index has gained increasing interest as a simple indicator of IR because of its good correlation with HOMA-IR and its ability to better detect insulin sensitivity.Citation23,Citation24
Therefore, we explored the association between the baseline METS-IR index and risk of T2DM in the non-obese population based on the Japanese NAGALA cohort study. We also performed subgroup analyses stratified by sex, age, fatty liver, exercise habits, alcohol consumption, smoking status, and follow-up time to assess the consistency of the association in different subgroups. In addition, we used a generalized additive model to explore the dose-response relationship between the METS-IR index and the occurrence of T2DM.
Materials and Methods
Data Source
Clinical data for our study population were obtained from the DATADRYAD database (http://www.Datadryad.org/). The raw data are freely available from the website and can be analyzed secondarily by researchers without violating the rights of the authors. In accordance with the Dryad Terms of Service, we cited the Dryad data package in the present study (Dryad data package: https://doi.org/10.5061/dryad.8q0p192).Citation25
Study Design and Participants
This study was a secondary analysis of data from the NAGALA cohort study. This is a cohort study conducted at the Medical Health Checkup Center of Murakami Memorial Hospital (Gifu, Japan) from 2004 to 2015. Details of the cohort study were described in the original article.Citation25 Briefly, 20,944 participants who participated in the physical examination program between 2004 and 2015 and completed at least a second examination were recruited. Exclusion criteria in the original study included (1) participants with a heavy drinking habit or a diagnosis of alcoholic fatty liver; (2) participants with a confirmed diagnosis of viral hepatitis; (3) any medications used during the baseline examination; (4) participants with missing covariates; and (5) participants with fasting plasma glucose (FPG) ≥6.1 mmol/L or a clear diagnosis of diabetes mellitus in participants. In addition to the initial exclusion criteria, more stringent exclusion criteria were developed for this study. Participants were excluded from the study if they met the following criteria: fulfilling the diagnostic criteria for general obesity or abdominal obesity in Asian: BMI≥25 kg/m2 and WC≥90 cm in men or ≥80 cm in women, respectively.Citation26,Citation27
Data Collection
The raw data downloaded from the Dryad database included incident T2DM, duration of follow-up, and baseline information. From the baseline information, we extracted information on age, sex, waist circumference (WC), body mass index (BMI), habit of exercise, smoking status, alcohol consumption, diastolic blood pressure (DBP), systolic blood pressure (SBP), and fatty liver. We also extracted information on baseline alanine aminotransferase (ALT), aspartate aminotransferase (AST), gamma-glutamyl transferase (GGT), high-density lipoprotein cholesterol (HDL-c), total cholesterol (TC), triglycerides (TG), fasting plasma glucose (FPG), and haemoglobin A1c (HbA1c).
Definitions
As described earlier, alcohol consumption was assessed by the type and amount of alcohol consumed per week in the previous month, and their alcohol status was then categorized into four groups: none or little drinking (<40 g/week), light drinking (40–140 g/week), moderate drinking (140–280 g/week), or heavy drinking (>280 g/week). Smoking status was divided into three categories: never, past and current. In addition, exercise habit was defined as participants participating in any type of exercise more than once per week. Fatty liver was evaluated by abdominal ultrasound, and experienced gastroenterologists reviewed the ultrasound images without knowing the personal information of the participants. According to the findings of four types of ultrasound, such as hepatorenal echo contrast, liver brightness, deep attenuation, and vascular blurring, the evaluation was made and a final diagnosis was made. The diagnostic criteria for general obesity or abdominal obesity in Asian: BMI >25 kg/m2 and WC> 90 cm in men or >80 cm in women, respectively.Citation26,Citation27 T2DM was defined as HbA1c ≥ 6.5%, FPG ≥ 126 mg/dl, and/or self-reported diabetes during follow-up.Citation25,Citation28 METS-IR was calculated as (ln ((2 × FPG) + TG) × BMI)/(ln (HDL-C)).Citation24
Ethical Approval
This cohort study was approved by the Ethics Committee of Murakami Memorial Hospital, and written informed consent was obtained from each participant. Previously published papers detail the ethical permission involved in this study.Citation25
Statistical Analyses
Study participants were classified into four groups according to quartiles (Q1–Q4) of the METS-IR index. Categorical variables were presented as proportions and continuous variables were presented as mean value ± standard deviation (SD) or median (interquartile range) as appropriate. The difference between quartiles of the METS-IR index was compared using Wilcoxon or Kruskal–Wallis test for continuous variables and the χ2 test for categorical variables.
The Kaplan-Meier method was used to generate survival plots during the follow-up, and the significance of differences between groups was tested with the Log rank test.
We incorporated all initial variables into the ordinary least squares (OLS) model and calculated the variance inflation factor (VIF) of each variable to test for multicollinearity.Citation29 Variables with VIF>5 were considered to have serious multicollinearity and cannot be included in the multiple regression model. A Cox proportional-hazard regression model was used to estimate hazard ratios (HRs) and 95% confidence intervals (CIs) for incidents of T2DM by quartiles of the METS-IR index, with the lowest quartile as the reference. Besides the crude model, four other models were fitted: model 1, controlling for age, sex, and WC; model 2, additionally adjusted for regular exercise, smoking status, and alcohol consumption; model 3, adjusted for variables included in model 2 plus fatty liver, and HbA1c; model 4, adjusted for variables included in model 3 plus SBP and HbA1c, ALT, AST, GGT, HDL-C, TC, and TG levels. Trend tests were performed in the regression models after the median METS-IR index values of each quartile were entered into the model and treated as a continuous variable.Citation30
Furthermore, a generalized additive model with a spline smoothing function was applied to examine the nonlinear relationship between the METS-IR index and the occurrence of T2DM. In further exploratory analyses, potential effect modifications of the association between the METS-IR index and T2DM risk were assessed for the variables: age (<45 vs 45–59 vs ≥60 years), sex (female vs male), fatty liver (yes vs no), habit of exercise (yes vs no), alcohol consumption (none vs light vs moderate vs heavy), smoking status (never vs past vs current), and follow-up duration (<1825 vs ≥1825 days). All interactions were analyzed by multivariable Cox proportional hazards modeling.
Lastly, the time-dependent receiver operating curve (ROC) and the area under ROC (AUC) were used to evaluate the discriminatory ability of the METS-IR index for T2DM. Additionally, C-statistics, category-free net reclassification improvement (NRI), and integrated discrimination improvement (IDI) were used to test the value of the METS-IR index to optimize the risk stratification of T2DM.
A double-tailed P-value < 0.05 was considered statistically significant in all analyses. R software, version 4.0.1 (http://www.R-project.org, The R Foundation) was used for all statistical analyses.
Results
Study Participants and Baseline Characteristics
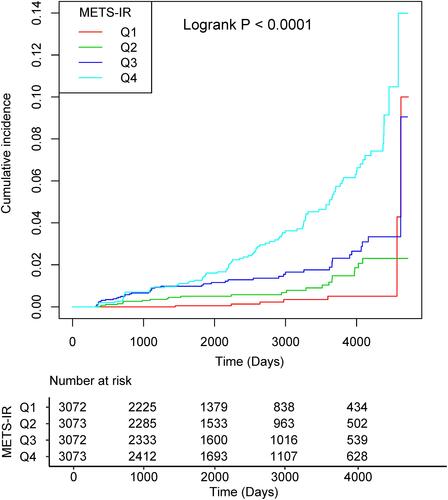
Of the invited participants (n = 20,944), 8654 participants were excluded, resulting in a total of 12,290 non-obese adults being included in the analyses (). The mean age was 43.43 ± 8.95 years and 6421 (52.25%) were male. Baseline characteristics by quartiles of the METS-IR index are shown in . Over a median follow-up period of 2050.00 days (IQR, 1017.00–3532.50), 176 (1.43%) participants developed T2DM. The cumulative incidence of T2DM according to the baseline METS-IR index quartiles for participants was presented in . The incidence of T2DM substantially increased with increasing the METS-IR index quartiles, from 7 (0.23%) in quartile 1 to 100 (3.25%) in quartile 4. Kaplan–Meier curves also showed that participants in quartile 4 of the baseline METS-IR index had a higher risk for T2DM events than participants in the other groups during the follow-up period (Log rank test, P < 0.0001).
Table 1 Baseline Characteristics of the Study Participants Sorted by Quartiles of METS-IR
Figure 1 Flowchart for the selection of study participants.
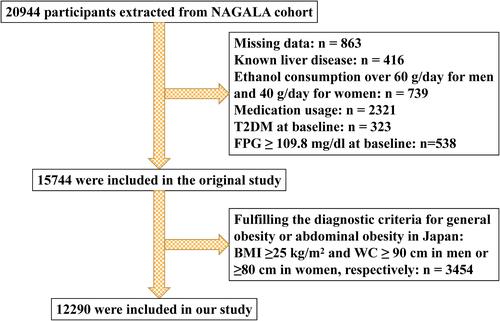
Figure 2 Kaplan–Meier curves of the cumulative event rate of incident T2DM stratified by the baseline METS-IR quartiles. The curves were compared using the log rank test.
Association of the METS-IR Index with the Risk of T2DM in Non-Obese Adults
Covariates were screened for the collinearity between variables prior to the development of the Cox proportional hazard model. Variables with VIF > 5 were considered to show severe multicollinearity and could not be included in the multivariate Cox proportional hazard model. Details of the collinearity screening are shown in Supplementary Table 1. The association between the METS-IR index and T2DM in non-obese adults is summarized in . In the unadjusted model (crude model), a one-unit increase in the METS-IR index was associated with a 1.18-fold increase in the risk of developing T2DM (HR=1.18, 95% CI: 1.15–1.21, P<0.001). In model 1, after adjusting for age, sex, and WC, each one-unit increase in the METS-IR index was associated with a 1.19-fold increase in the risk of developing T2DM (HR=1.19, 95% CI: 1.14–1.24, P<0.001). Following further adjustments (model 2), the results were similar to model 1, with no significant changes in the magnitude or direction of the core results. In model 3, for every 1-unit increase in the METS-IR index, the risk of T2DM increased 1.13-fold (HR=1.13, 95% CI: 1.08–1.17, P<0.001) after adjusting for variables included in model 2 plus fatty liver, and HbA1c. Finally, the fully adjusted HR (95% CI) for the incidence of T2DM in non-obese adults was 1.17 (HR=1.17, 95% CI: 1.09–1.27, P<0.001) for every 1-unit increase in the METS-IR index. In the sensitivity analysis, the METS-IR index was transformed into a categorical variable (quartile of the METS-IR index), and the P-value for the trend of the METS-IR index with categorical variables was consistent with the result of the METS-IR index as a continuous variable in the different models (P for trend< 0.05).
Table 2 Association Between METS-IR and Incident T2DM in Different Models
Threshold Effect Analysis of the METS-IR Index on Incident T2DM in Non-Obese Adults
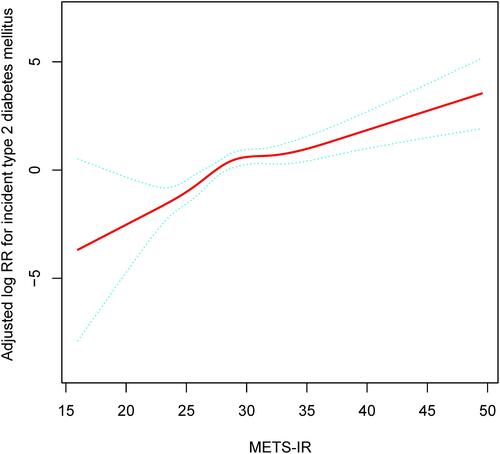
Since the METS-IR index is a continuous variable, it is necessary to study the threshold effect between the METS-IR index and incident T2DM in non-obese adults. In , the adjusted smoothing curve shows a continuous positive correlation between the METS-IR index and incident T2DM with no threshold effect.
Figure 3 The non-linear relationship between METS-IR and incident of type 2 diabetes mellitus. Solid red line represents the smooth curve fit between variables. Blue bands represent the 95% CI of the fit. Adjust for: age, sex, WC, regular exercise, smoking status, alcohol consumption, fatty liver, HbA1c, ALT, AST, GGT, HDL-C, TC, and TG.
Stratified Analysis by Potential Effect Modifications
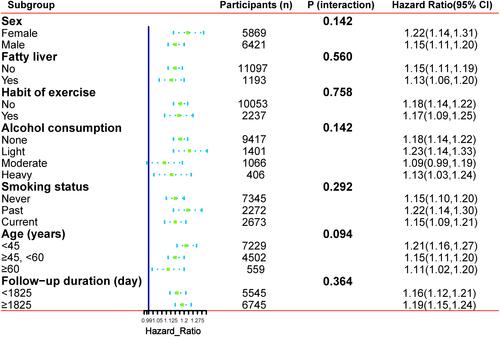
Stratified analyses were performed to better understand other factors that may influence the association between the METS-IR index and incident T2DM and to further identify potential special populations. The full variables were presented hierarchically according to bisection or clinical significance, and interaction tests were also performed (). None of the variables, including age (<45 vs 45–59 vs ≥60 years), sex (female vs male), fatty liver (yes vs no), habit of exercise (yes vs no), alcohol consumption (none vs light vs moderate vs heavy), smoking status (never vs past vs current), as well as follow-up duration (<1825 vs ≥1825 days), significantly modified the association between the METS-IR index and the risk of T2DM (P for all interactions >0.05) (). Of note, at the existing sample size, the efficacy for detecting a moderate interaction is limited; therefore, negative results would not necessarily confirm the absence of interactions.
Figure 4 Forest plots of the association between METS-IR and new-onset T2DM in various subgroups. Adjust for: age, sex, WC, regular exercise, smoking status, alcohol consumption, fatty liver, SBP, HbA1c, ALT, AST, GGT, HDL-C, TC, and TG.
The Discriminative Power of the METS-IR Index for T2DM
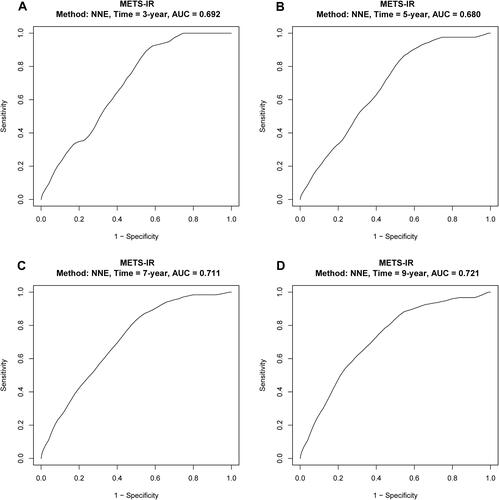
We evaluated the discriminative power of the METS-IR index for T2DM at different time points. The AUCs were 0.692 (95% CI: 0.654–0.730) at 3 year, 0.680 (95% CI: 0.642–0.718) at 5 year, 0.711 (95% CI: 0.673–0.749) at 7 year and 0.721 (95% CI: 0.684–0.758) at 9 year, which indicated a helpful discrimination for T2DM ().
Figure 5 Time-dependent ROC curve and areas under ROC curve at different time points. The area under the ROC curve was 0.692 at 3 year (A), 0.680 at 5 year (B), 0.711 at 7 year (C), and 0.721 at 9 years (D).
Incremental Effect of the METS-IR Index on Predictive Value for T2DM in Non-Obese Adults
Finally, we evaluated whether the METS-IR index would further increase the predictive value of clinical risk factors (). The C-statistics by the clinical risk factors significantly improve with the addition of the METS-IR index (from 0.862 to 0.875, P = 0.035), the discriminatory power and risk reclassification also appeared to be substantially better, with the category-free NRI of 0.216 (95% CI: 0.100–0.343, P<0.001), and the IDI of 0.011 (95% CI: 0.003–0.048, P = 0.013).
Table 3 C-Statistics and Reclassification Analyses for METS-IR to Improve the Risk Stratification of T2DM
Discussion
Many observational studies have shown that more than 30% of non-obese adults have metabolic abnormalities, including abdominal adipose tissue accumulation, decreased β-cell function, and IR.Citation31–Citation33 In addition, non-obese adults may not monitor their health indicators or take preventive measures for T2DM. Therefore, there is a need for early identification of T2DM in non-obese adults.Citation34 In particular, Asians, despite their lower absolute BMI, are more likely to have visceral adipose tissue accumulation and IR compared to Western populations.Citation35,Citation36 However, data on T2DM prevention in non-obese populations are limited.
To our knowledge, this is the first study to investigate the association between the METS-IR index and the risk of new-onset T2DM in a non-obese population. This population-based prospective cohort study showed that elevated the METS-IR index was independently associated with a greater risk of T2DM in non-obese Japanese adults. Compared with the lowest quartile, individuals with the top quartile of the METS-IR index demonstrated a 4.01-fold greater risk of developing T2DM (Q4 vs Q1; adjusted HR 4.01, 95% CI 1.39–11.57). Furthermore, the results were stable in subgroups according to age, sex, fatty liver, habit of exercise, alcohol consumption, smoking status, as well as follow-up duration. This suggests that our results are robust and that the METS-IR index is applicable to a wide range of subjects. In addition, we found inconsistent effect size trends on the left and right sides of the inflection point [left side (HR=1.45, 95% CI: 1.20–1.76, P<0.001); right side (HR=1.15, 95% CI: 1.06–1.24, P<0.001)]. This result suggests a saturation effect of the independent association between the METS-IR index and the incidence of T2DM. More importantly, adding the METS-IR index to a baseline risk model consisting of certain traditional risk factors significantly improved the reclassification ability.
The association between the METS-IR index and the occurrence of T2DM has been investigated in two different ethnic populations.Citation24,Citation37 In a two-year prospective cohort study, Bello-Chavolla et alCitation24 confirmed the METS-IR index as a novel score to assess cardiometabolic risk in healthy and high-risk subjects and as a promising tool to screen for insulin sensitivity. The study recruited 6144 participants (aged 20–79 years) at baseline in Mexico and conducted a two-year follow-up. Compared to the reference quartile, the highest METS-IR quartile had an approximately 2.91-fold increased risk of developing T2DM. In another cohort study based on a rural Chinese population, researchers explored the relationship between the baseline METS-IR index and incident T2DM. The researchers found that the association between the METS-IR and the development of T2DM was significant (per SD unit increase: HR=1.80, 95% CI: 1.60–2.02). And, this significant association persisted in subgroup analyses by sex, age, and baseline FPG levels. Dose-response analysis showed a significant increase in the probability of incident T2DM with increasing the METS-IR.Citation37
Potential mechanisms underlying the association of the METS-IR with T2DM are complex. Several mechanisms have been reported to explain the relationship between the METS-IR index and T2DM. One possible explanation is the weak antioxidant capacity due to the low expression of antioxidant enzymes in pancreatic islet cells. When glucose concentration increases, the level of reactive oxygen species in β-cells also increases, which may have toxic effects on β-cells and lead to functional impairment of islet β-cells, which in turn causes T2DM.Citation37–Citation39 Another plausible explanation is that previous studies have shown that adipose tissue accumulation in the liver and pancreas is associated with IR, and that hepatic IR due to adipose tissue accumulation may affect the balance of blood glucose and lipids, which may to some extent contribute to elevated blood glucose levels.Citation40–Citation43 Despite the proposed pathways, more mechanistic studies are needed to reveal the role of the METS-IR index in the development of T2DM in different ethnicities.
The interpretation of our results requires consideration of the strengths and limitations of our study. We first list the strengths. First, the study sample was drawn from participants in the Japanese NAGALA cohort study, which was larger than previous studies assessing the association between the METS-IR index and the risk of developing T2DM. Therefore, there were sufficient subjects for analysis to ensure the reliability and robustness of the results. Second, this study was conducted in a non-obese population and all obese individuals were excluded, unlike previous studies, so the findings may be more applicable to non-obese individuals. Third, we treated the target-independent variables as continuous and categorical variables. This approach improves the robustness of the results. Fourth, our analysis of the relationship between the METS-IR index and incident T2DM was adjusted for more potential confounders than previous studies, potentially making the results more robust and reliable.
Nevertheless, some limitations should be taken into account when making cautious interpretations. First, compared to Westerners, Japanese do not weigh so much, and the main cause of hyperglycemia is a decrease in insulin secretion capacity. And this study focused on non-obese Japanese adults, so the generalizability of the findings to obese Japanese adults and other races remains to be determined. Second, we did not use a 2-hour oral glucose tolerance test to diagnose T2DM, so we may have underestimated the prevalence of T2DM. Third, our study did not assess the effect of dynamic changes in the METS-IR on T2DM, which may have affected the results. Fourth, data on fasting insulin levels were not available in the database, so it was not possible to compare the accuracy of the METS-IR index and HOMA-IR in predicting the risk of T2DM. Finally, this report is a secondary analysis based on the existing database of the NAGALA cohort study, and although many confounders were adjusted for, some variables were not included in the database, such as dietary factors, muscle mass, and lipid-lowering medications, failed to be adjusted for. Therefore, the potential impact of these residual confounding factors on the results cannot be ignored.
Conclusion
In conclusion, our study showed that a higher METS-IR index was significantly associated with a higher risk of incident T2DM in a non-obese population. The METS-IR index showed a helpful discriminatory ability for T2DM, which significantly improved the ability to reclassify beyond the baseline risk model consisting of certain traditional risk factors. Thus, the results of this study provide a convenient and useful marker for early prevention of T2DM in non-obese populations, facilitating early detection of people at risk for T2DM and providing early preventive measures.
Data Sharing Statement
All data that support the findings of this study are openly available in Dryad (http://www.datadryad.org/).
Ethics Approval and Consent to Participate
This study was a post hoc analysis of the public data in the NAGALA cohort, and the original data were uploaded to the DRYAD database by Professor Fukui. Based on previous studies, this study established a new hypothesis. Because Murakami Memorial Hospital’s institutional ethics committee had authorized the previous study, separate ethical approval was no longer required for this study. Additionally, because the identification information of the subjects was deleted from the data and uniformly replaced by the health check code and the informed consent for each subject on using the data in the previous study was obtained, the application to obtain informed consent again was not required in this study.
Acknowledgments
We appreciate Okamura, Takuro et al for their spirit of scientific sharing.
Disclosure
The authors declare that there is no conflict of interest regarding the publication of this article.
Additional information
Funding
References
- Chatterjee S, Khunti K, Davies MJ. Type 2 diabetes. Lancet. 2017;389:2239–2251. doi:10.1016/S0140-6736(17)30058-2
- Cai XT, Ji LW, Liu SS, Wang MR, Heizhati M, Li NF. Derivation and validation of a prediction model for predicting the 5-year incidence of Type 2 diabetes in non-obese adults: a population-based cohort study. Diabetes Metab Syndr Obes. 2021;14:2087–2101. doi:10.2147/DMSO.S304994
- Khan M, Hashim MJ, King JK, Govender RD, Mustafa H, Al Kaabi J. Epidemiology of Type 2 diabetes - global burden of disease and forecasted trends. J Epidemiol Glob Health. 2020;10(1):107–111. doi:10.2991/jegh.k.191028.001
- Reed J, Bain S, Kanamarlapudi V. A review of current trends with Type 2 diabetes epidemiology, aetiology, pathogenesis, treatments and future perspectives. Diabetes Metab Syndr Obes. 2021;14:3567–3602. doi:10.2147/DMSO.S319895
- Zheng Y, Ley SH, Hu FB. Global aetiology and epidemiology of type 2 diabetes mellitus and its complications. Nat Rev Endocrinol. 2018;14:88–98. doi:10.1038/nrendo.2017.151
- Srikanth V, Sinclair AJ, Hill-Briggs F, Moran C, Biessels GJ. Type 2 diabetes and cognitive dysfunction-towards effective management of both comorbidities. Lancet Diabetes Endocrinol. 2020;8:535–545. doi:10.1016/S2213-8587(20)30118-2
- Gregg EW, Sattar N, Ali MK. The changing face of diabetes complications. Lancet Diabetes Endocrinol. 2016;4:537–547. doi:10.1016/S2213-8587(16)30010-9
- Piché ME, Tchernof A, Després JP. Obesity phenotypes, diabetes, and cardiovascular diseases. Circ Res. 2020;126:1477–1500. doi:10.1161/CIRCRESAHA.120.316101
- Ng A, Delgado V, Borlaug BA, Bax JJ. Diabesity: the combined burden of obesity and diabetes on heart disease and the role of imaging. Nat Rev Cardiol. 2021;18:291–304. doi:10.1038/s41569-020-00465-5
- Boles A, Kandimalla R, Reddy PH. Dynamics of diabetes and obesity: epidemiological perspective. Biochim Biophys Acta Mol Basis Dis. 2017;1863(5):1026–1036. doi:10.1016/j.bbadis.2017.01.016
- Kashima S, Inoue K, Matsumoto M, Akimoto K. Prevalence and characteristics of non-obese diabetes in Japanese men and women: the Yuport Medical Checkup Center Study. J Diabetes. 2015;7:523–530. doi:10.1111/1753-0407.12213
- Chan JC, Malik V, Jia W, et al. Diabetes in Asia: epidemiology, risk factors, and pathophysiology. JAMA. 2009;301:2129–2140. doi:10.1001/jama.2009.726
- Manson JE, Colditz GA, Stampfer MJ, et al. A prospective study of maturity-onset diabetes mellitus and risk of coronary heart disease and stroke in women. Arch Intern Med. 1991;151:1141–1147. doi:10.1001/archinte.1991.00400060077013
- Carnethon MR, De Chavez PJ, Biggs ML, et al. Association of weight status with mortality in adults with incident diabetes. JAMA. 2012;308:581–590. doi:10.1001/jama.2012.9282
- Ji L, Cai X, Bai Y, Li T. Application of a novel prediction model for predicting 2-year risk of non-alcoholic fatty liver disease in the non-obese population with normal blood lipid levels: a large prospective cohort study from China. Int J Gen Med. 2021;14:2909–2922. doi:10.2147/IJGM.S319759
- Kahn SE. The relative contributions of insulin resistance and beta-cell dysfunction to the pathophysiology of Type 2 diabetes. Diabetologia. 2003;46:3–19. doi:10.1007/s00125-002-1009-0
- Warram JH, Martin BC, Krolewski AS, Soeldner JS, Kahn CR. Slow glucose removal rate and hyperinsulinemia precede the development of type II diabetes in the offspring of diabetic parents. Ann Intern Med. 1990;113:909–915. doi:10.7326/0003-4819-113-12-909
- Li X, Li G, Cheng T, Liu J, Song G, Ma H. Association between triglyceride-glucose index and risk of incident diabetes: a secondary analysis based on a Chinese cohort study: TyG index and incident diabetes. Lipids Health Dis. 2020;19(1):236. doi:10.1186/s12944-020-01403-7
- Cheung AS, de Rooy C, Hoermann R, et al. Correlation of visceral adipose tissue measured by Lunar Prodigy dual X-ray absorptiometry with MRI and CT in older men. Int J Obes (Lond). 2016;40:1325–1328. doi:10.1038/ijo.2016.50
- Carrillo-Larco RM, Miranda JJ, Gilman RH, et al. The HOMA-IR performance to identify new diabetes cases by degree of urbanization and altitude in Peru: the CRONICAS cohort study. J Diabetes Res. 2018;2018:7434918. doi:10.1155/2018/7434918
- Wedin WK, Diaz-Gimenez L, Convit AJ. Prediction of insulin resistance with anthropometric measures: lessons from a large adolescent population. Diabetes Metab Syndr Obes. 2012;5:219–225. doi:10.2147/DMSO.S33478
- Chen CL, Liu L, Lo K, et al. Association between triglyceride glucose index and risk of new-onset diabetes among Chinese adults: findings from the China health and retirement longitudinal study. Front Cardiovasc Med. 2020;7:610322. doi:10.3389/fcvm.2020.610322
- Liu XZ, Fan J, Pan SJ. METS-IR, a novel simple insulin resistance indexes, is associated with hypertension in normal-weight Chinese adults. J Clin Hypertens (Greenwich). 2019;21:1075–1081. doi:10.1111/jch.13591
- Bello-Chavolla OY, Almeda-Valdes P, Gomez-Velasco D, et al. METS-IR, a novel score to evaluate insulin sensitivity, is predictive of visceral adiposity and incident type 2 diabetes. Eur J Endocrinol. 2018;178:533–544. doi:10.1530/EJE-17-0883
- Okamura T, Hashimoto Y, Hamaguchi M, Obora A, Kojima T, Fukui M. Ectopic fat obesity presents the greatest risk for incident type 2 diabetes: a population-based longitudinal study. Int J Obes (Lond). 2019;43:139–148. doi:10.1038/s41366-018-0076-3
- Seo MH, Lee WY, Kim SS, et al. 2018 Korean society for the study of obesity guideline for the management of obesity in Korea. J Obes Metab Syndr. 2019;28:40–45. doi:10.7570/jomes.2019.28.1.40
- Examination Committee of Criter T. New criteria for ‘obesity disease’ in Japan. Circ J. 2002;66:987–992. doi:10.1253/circj.66.987
- Cai X, Zhu Q, Cao Y, et al. A prediction model based on noninvasive indicators to predict the 8-year incidence of Type 2 diabetes in patients with nonalcoholic fatty liver disease: a population-based retrospective cohort study. Biomed Res Int. 2021;2021:5527460. doi:10.1155/2021/5527460
- Li J, Yu S, Zhou W, et al. U-shaped association of body mass index with the risk of peripheral arterial disease in Chinese hypertensive population. Int J Gen Med. 2021;14:3627–3634. doi:10.2147/IJGM.S323769
- Yan LJ, Zhang FR, Zeng YR, Zheng Y. Serum folate and all-cause mortality is of non-linear relationship among population with chronic kidney disease: a retrospective cohort study. Int J Gen Med. 2021;14:2695–2702. doi:10.2147/IJGM.S314904
- Hinnouho GM, Czernichow S, Dugravot A, et al. Metabolically healthy obesity and the risk of cardiovascular disease and type 2 diabetes: the Whitehall II cohort study. Eur Heart J. 2015;36:551–559. doi:10.1093/eurheartj/ehu123
- Lee SH, Han K, Yang HK, et al. A novel criterion for identifying metabolically obese but normal weight individuals using the product of triglycerides and glucose. Nutr Diabetes. 2015;5(4):e149. doi:10.1038/nutd.2014.46
- Wang B, Zhuang R, Luo X, et al. Prevalence of metabolically healthy obese and metabolically obese but normal weight in adults worldwide: a meta-analysis. Horm Metab Res. 2015;47(11):839–845. doi:10.1055/s-0035-1559767
- Zhang M, Wang B, Liu Y, et al. Cumulative increased risk of incident type 2 diabetes mellitus with increasing triglyceride glucose index in normal-weight people: the Rural Chinese Cohort Study. Cardiovasc Diabetol. 2017;16:30. doi:10.1186/s12933-017-0514-x
- Gao H, Salim A, Lee J, Tai ES, van Dam RM. Can body fat distribution, adiponectin levels and inflammation explain differences in insulin resistance between ethnic Chinese, Malays and Asian Indians. Int J Obes (Lond). 2012;36:1086–1093. doi:10.1038/ijo.2011.185
- Nazare JA, Smith JD, Borel AL, et al. Ethnic influences on the relations between abdominal subcutaneous and visceral adiposity, liver fat, and cardiometabolic risk profile: the International Study of prediction of intra-abdominal adiposity and its relationship with cardiometabolic risk/intra-abdominal adiposity. Am J Clin Nutr. 2012;96:714–726. doi:10.3945/ajcn.112.035758
- Zhang M, Liu D, Qin P, et al. Association of metabolic score for insulin resistance and its 6-year change with incident type 2 diabetes mellitus. J Diabetes. 2021;13:725–734. doi:10.1111/1753-0407.13161
- Lillioja S, Mott DM, Spraul M, et al. Insulin resistance and insulin secretory dysfunction as precursors of non-insulin-dependent diabetes mellitus. Prospective studies of Pima Indians. N Engl J Med. 1993;329:1988–1992. doi:10.1056/NEJM199312303292703
- Robertson RP, Harmon J, Tran PO, Poitout V. Beta-cell glucose toxicity, lipotoxicity, and chronic oxidative stress in type 2 diabetes. Diabetes. 2004;53 Suppl 1:S119–124. doi:10.2337/diabetes.53.2007.s119
- Singh RG, Yoon HD, Poppitt SD, Plank LD, Petrov MS. Ectopic fat accumulation in the pancreas and its biomarkers: a systematic review and meta-analysis. Diabetes Metab Res Rev. 2017;33(8):e2918. doi:10.1002/dmrr.2918
- Kato K, Takamura T, Takeshita Y, et al. Ectopic fat accumulation and distant organ-specific insulin resistance in Japanese people with nonalcoholic fatty liver disease. PLoS One. 2014;9:e92170. doi:10.1371/journal.pone.0092170
- Wueest S, Item F, Lucchini FC, et al. Mesenteric fat lipolysis mediates obesity-associated hepatic steatosis and insulin resistance. Diabetes. 2016;65:140–148. doi:10.2337/db15-0941
- Shanik MH, Xu Y, Skrha J, Dankner R, Zick Y, Roth J. Insulin resistance and hyperinsulinemia: is hyperinsulinemia the cart or the horse. Diabetes Care. 2008;31(Suppl 2):S262–268. doi:10.2337/dc08-s264