
Abstract
Purpose
The molecular mechanisms and signal pathways of ferroptosis in hepatoblastoma (HB) have not yet been clarified. In previous studies, activating transcription factor 3 (ATF3) was reported to be correlated with several tumors, but the clinical significance of ATF3 has never been determined. Herein, we investigated the clinicopathological value and mechanisms of ATF3 in regulating ferroptosis in HB.
Methods
The mRNA microarray and RNA-sequencing data of 402 samples from our hospital and public databases were used to estimate ATF3 expression and assess its clinical role in HB. The standard mean difference (SMD) and summary receiver operating characteristic curves were utilized to judge the discrimination ability of ATF3 between HB and non-HB liver tissues. We examined the expression variation of ATF3 in HB cells after the treatment with erastin. We also predicted the target genes of ATF3 as a transcriptional factor from public Chromatin Immunoprecipitation-sequencing data and selected the ferroptosis-related genes for a signaling pathway analysis.
Results
In ten series, the pooled SMD for ATF3 was −0.91, demonstrating that ATF3 expression was predominantly lower in HB than in non-HB liver tissues. ATF3 down-regulation showed moderate potential to distinguish HB from non-HB liver tissues (area under curves = 0.83, 95% confidence interval = 0.79–0.86). Altogether, 4855 putative targets of ATF3 as a transcriptional factor were collected, among which, 60 genes were ferroptosis-related.
Conclusion
The down-regulated ATF3 expression may play a vital role in the occurrence of HB possible partially by regulating ferroptosis.
Introduction
Hepatoblastoma (HB) is one of the most regularly seen malignant tumors of the liver in children, accounting for about 1% of childhood malignant tumors.Citation1,Citation2 Physicians avoid surgery as the primary treatment for HB because most patients are diagnosed before the age of two.Citation3,Citation4 According to the statistics, about 40% of HB patients could not undergo surgery immediately after being diagnosed.Citation5,Citation6 In the past decades, the United States-based children’s oncology group (COG) began promoting chemotherapy as the main treatment for HB, while chemotherapy is normally applied after surgery or tumor size reduction (in patients who cannot have surgery).Citation7,Citation8 Most patients who received cytotoxic chemotherapy were suffering strong adverse reactions that hinder the widespread use of chemotherapy due to different molecular mechanisms.Citation9,Citation10 Therefore, molecular targeted therapy has become the most chosen option for patients.
Molecular targeted therapy is a revolutionary prescription treatment with broad prospects for development; by inducing the expression of specific molecules, targeted medicines are able to regulate disease development.Citation11,Citation12 Ferroptosis has been explored as a molecular targeted therapy for various tumors since it was proposed in 2012. Ferroptosis is an apoptosis pathway that depends on iron metabolism; by influencing the antioxidation of glutathione peroxidase, ferroptosis inducers promote iron accumulation in cells, leading to cell peroxidation.Citation13 Ferroptosis has been found by some investigations to be associated with liver tumors. Sun et al speculated that overexpressed NRF2 transcription factors are regulated by the autophagy adaptor protein p62 (one kind of an autophagic proteins), while the Keap1 protein has the ability to reduce the probability of ferroptosis occurrence and reproduction in hepatocellular carcinoma (HCC) cells.Citation14 In a HCC mouse model, Yu et al revealed that the silencing of solute carrier family 39 member 14 (SLC39A14) could significantly curtail iron concentrations in HCC cells and inhibit ferroptosis materialization.Citation15 Liang et al structured a Cox regression model and screened 10 genes as ferroptosis-treated targets of HCC.Citation16 While HB is as important a childhood tumor as HCC is in adulthood, to our knowledge, only one study has reported the relationship between ferroptosis and HB at present. Lippman et al found that down-regulated glutathione peroxidase 4 (GPX4) boosted the development of ferroptosis, and that the same results could be observed in differential expressions of the enzymes NRF2 and HO-1.Citation17 Nevertheless, there is still too little research on ferroptosis in HB. The expression levels and potential molecular mechanisms of ferroptosis-related genes in HB have not been investigated.
Transcription factor activating transcription factor 3 (ATF3) is located on chromosome 1q32.3; as a member of the activating transcription factor family, when induced by stress, ATF3 is able to regulate processes of metabolism, immunity, and carcinogenesis.Citation18 Studies have reported the regulative function of ATF3 in the progress of tumor ferroptosis. Wang et al found that up-regulated ATF3 assisted the development of the amino acid reverse transport system Xc-, and then promoted ferroptosis induced by erastin. Wang et al also concurrently indicated that, in the future, it might be possible to induce ferroptosis through the transcriptional activation of ATF3.Citation19 By analyzing data from the Gene Expression Omnibus (GEO), Fei et al indicated that ATF3 probably could influenced the expression of HSPB1 and promoted in-process ferroptosis in HCC, thus inhibiting tumor proliferation and metastasis.Citation20 Furthermore, a study found that quercetin played the role of a ferroptosis inhibitor when ATF3-regulated kidney cell ferroptosis was triggered by overexpression of SLC7A11 and GPX4.Citation21 Moreover, ATF3 was also correlated with ferroptosis and tumor inhibition in breast cancer and kidney cancer.Citation22,Citation23 Unfortunately, we did not find articles about the communication between ATF3 and ferroptosis in HB. The existing papers on ATF3 in malignant tumor ferroptosis only focused on the differential expressed target genes of ATF3; they did not objectively evaluate the expression levels or the potential molecular mechanisms of ATF3 in any diseases.
To fill the gap in current research regarding ATF3 regulating ferroptosis in HB, we first analyzed the expression levels of ATF3 in pan-cancers of adults and children, then highlighted the expression of ATF3 in HB and its relationship with the development of ferroptosis. We also identified target genes of ATF3 in HB through Chromatin Immunoprecipitation-sequencing (ChIP-seq) data. In addition, correlation analysis between ATF3 and immune infiltration was performed to further reveal the clinical significance of ATF3 within the signal pathways.
Methods
The research flow chart of the present study was shown on Supplementary Material 1.
Clinical Significance of ATF3 in Pan-Cancers of Adults and Children
Using Tumor Immune Estimation Resource, version 2 (TIMER 2.0), we plotted a box plot to show the expression levels of ATF3 in 33 adult cancer types. We obtained the clinical information, including survival of the cancer patients from The Cancer Genome Atlas (TCGA) database. Additionally, TISIDB, a database that includes immune-related cells data in cancers, was also used to observe the immune infiltration of ATF3 in a variety of adult tumors.
There are far fewer databases on childhood cancers than on adult cancers, so the Therapeutically Applicable Research to Generate Effective Treatments (TARGET) database was applied to analyze the expression of ATF3 in pan-cancers of children. Using sequencing and chip technologies, TARGET has included seven types of cancer common in children. We downloaded RNA-seq data from TARGET and analyzed ATF3 expression levels in these seven types of cancer.
Expression Level and Discrimination Potential of ATF3 in HB
Tumor and paratumor tissues of HB patients were collected from the First Affiliated Hospital of Guangxi Medical University Department of Pathology. We sequenced the obtained tissue samples and analyzed the sequencing data to observe the expression of ATF3 in HB.
Prior to further analysis, we screened and downloaded HB microarray and RNA-seq data from GEO, Sequence Read Archive (SRA), and ArrayExpress database, the data filtering flow chart is shown on Supplementary Material 2. Including the in-house RNA-seq data, a total of ten datasets were gathered by using “hepatoblastoma” as the search keyword (). Log 2 (x + 1) conversion was performed and diagnostic testing was applied to estimate the clinical significance of ATF3 in HB. The standard mean difference (SMD) was calculated through Stata 14.0. The included studies were considered to be heterogeneous if p < 0.05 or I2 > 50%. If heterogeneous, then a random-effect model would be applied; otherwise, a fixed-effects model was adopted. Receiver operating characteristic (ROC) curves were plotted by IBM SPSS Statistics v23.0 and GraphPad Prism 8.0. Additionally, in order to equitably evaluate the potential of ATF3 to discriminate between HB and non-HB liver tissues, a summary receiver operating characteristic (sROC) was plotted. The area under curve (AUC) of sROC represents the potential diagnostic value of ATF3.
Table 1 The Included HB-Related Databases with ATF3 Expression
The Relationship Between ATF3 and Ferroptosis in HB
After searching the literature, we found that ATF3 was reported to have a correlation with ferroptosis in many types of cancers, including HCC, gastric cancer, and glioma. Thus, we determined to explore the relationship between ATF3 and ferroptosis in HB. GSE104462 contains HepG2 cells (a HB cell line) being treated with erastin; thus, it is helpful for achieving our research about exploring the relationship between ATF3 and ferroptosis in HB. Limma package, supported by R v3.6.1, has algorithms to identify whether genes are expressed differentially between cancer and control tissues. According to eBayes theorem, limma can be applied to screen for differentially expressed genes (DEGs). In our study, DEGs of HepG2 cells treated with ferroptosis inducers were identified. A Student’s t-test was performed on the GSE104462 data to assess differential ATF3 mRNA expression between the ferroptosis-induced and non-ferroptosis-induced groups. We were interested in whether ATF3 could regulate the functional phenotypes of HB through influencing ferroptosis. Thus, we first obtained ferroptosis-related genes from FerrDataBase, Then, we collected the putative targets of ATF3 from public ChIP-seq data from CistromeDB, and performed an interaction with the above two groups of genes. Finally, some ferroptosis-related targets of ATF3 were obtained and these genes were sent for Kyoto Encyclopedia of Genes and Genomes (KEGG) analysis.
Identification of ATF3 Differentially Co-Expressed Genes (DCEGs)
Identification of ATF3 Co-Expressed Genes in HB
Co-expressed genes (CEGs) in this study are genes with a close association with ATF3 that might be targeted or influenced by ATF3 in HB. Gene expression data from ten HB studies were extracted, and their Pearson’s coefficients with ATF3 were evaluated. We considered the gene to be a CEG when |r| > 0.3 and p < 0.05. Moreover, we identified a gene as one of the CEGs for subsequent research when it appeared more than four times within the ten studies.
Identification of ATF3 DEGs in HB
Based on the collected studies, we extracted and calculated the SMD of all the included genes. If lower 95% confidence interval (CI) > 0 and SMD > 0, the gene would be considered to be up-regulated in HB. In the same light, if higher 95% CI < 0 and SMD < 0, the gene would be considered to be down-regulated in HB. The above qualified genes were chosen as ATF3 DEGs. Finally, the ATF3 DCEGs were screened out through making an interaction with CEGs and DEGs of ATF3.
Functional Enrichment Analysis of ATF3 DCEGs
To further delve into the molecular mechanisms and potential functions of differentially expressed ATF3-regulated ferroptosis in HB, we entered DCEGs of ATF3 into the Database for Annotation, Visualization, and Integrated Discovery (DAVID) v6.8. Gene ontology (GO) and KEGG enrichment analyses were then used to explore the potential signal pathways of ATF3 DCEGs in HB. GO terms and KEGG signal pathways with p < 0.05 were identified. In addition, a protein-protein interaction (PPI) network was constructed using the Search Tool for the Retrieval of Interacting Genes (STRING).
The Identification of ATF3 Target Genes in HB
Previous researches have demonstrated that ATF3 is a transcription factor that regulates the expressions of immune and tumor-associated proteins. We searched for potential ATF3 target genes on CistromeDB. First, we downloaded expression data of ATF3 in HepG2 cells and predicted the potential target genes. The results were then intersected with DCEGs. The SMDs of the target genes were also evaluated.
Correlations Between ATF3 and the Immune Infiltration
We assessed the abundance of immune infiltrates of ATF3 in various of tumors based on TISIDB, a database focusing on tumor-immune analysis. We extracted the expression data of ATF3 and 57 immune-related genes from nine public studies and performed a correlation analysis to reveal the relationships between ATF3 and immune-related genes in HB.
Results
Clinical Significance of ATF3 in Pan-Cancers in Adults and Children
shows the mRNA expression levels of ATF3 in various cancer types based on TIMER 2.0. We were surprised to find that ATF3 was differentially expressed in some cancers. The prognostic information was also used to build a lasso model (see ). After performing an analysis of the overall survival time of patients, we found that differentially expressed ATF3 would affect the survival time of patients in uveal melanoma (UVM). Furthermore, ATF3 expression was closely related to immune infiltration scores of various immune cells in adult cancers (–).
Figure 1 The clinicopathological role of mRNA expression levels of ATF3 in pan-cancers. (A) The mRNA expression levels. (B) Overall survival risks of patients with differential expressed ATF3. (C) The mRNA expression of ATF3 in common children tumors. (D–G) Associations of the ATF3 expression levels with lymphocytes, immunoinhibitors, Immunostimulators and MHC molecules.
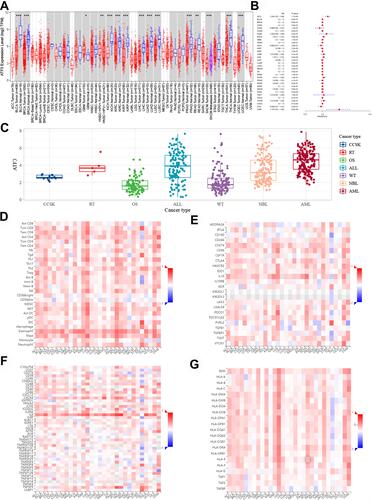
To explore the expression of ATF3 in children’s tumors, RNA-seq data from TARGET were downloaded and analysed. After estimating the average expression value of ATF3, we drew a complex box plot to show our results ().
Down-Regulation and Discrimination Potential of ATF3 mRNA in HB
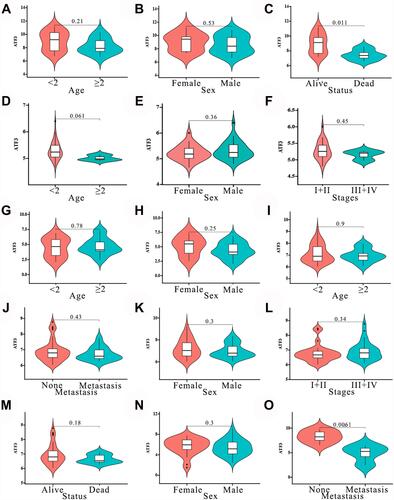
In order to reveal the mRNA expression of ATF3 in HB, nine studies from the GEO and ArrayExpress databases were analyzed and combined with our in-house RNA-seq data. We extracted the ATF3 expression data from the aforementioned series. Through the generated scatter plots and ROC curves, we observed that ATF3 was generally down-regulated in HB compared with non-HB liver tissues ( and ). A SMD with a random-effect model is shown in because I2 = 65.0% and p = 0.004, indicating that ATF3 was down-regulated in HB (SMD = −0.91; 95% CI = −1.31 to −0.51). Although a heterogeneity analysis was performed, we still could not determine the heterogeneity (). No publication bias was observed in the funnel plots (–). In addition, an area under the sROC curve of 0.83 (95% CI = 0.79 to 0.86) with a sensitivity of 0.71 (95% CI = 0.61 to 0.79) and specificity of 0.82 (95% CI = 0.69 to 0.91) indicated that the down-regulation of ATF3 had moderate sensitivity and specificity to discriminate HB from non-HB tissues (). Furthermore, we also showed the diagnostic likelihood ratio (DLR), which reflects the diagnostic potential of ATF3 (). The relationships between different clinical parameters and ATF3 expression are displayed in .
Table 2 The Means and Standard Deviations of ATF3 Expression Values for HB and Non-HB Based on 10 Studies
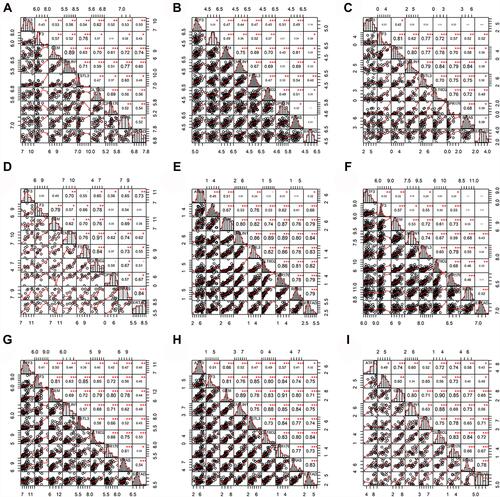
Figure 2 The expression levels and potential diagnostic ability of ATF3 in 10 datasets. (A–C) Data from E-MEXP-1851, GSE75271, GSE81928; (D–F) data from GSE89775, GSE104766, GSE131329; (G–I) data from GSE132037, GSE133039, GSE151347. (J) Data from in-house RNA-sequencing.
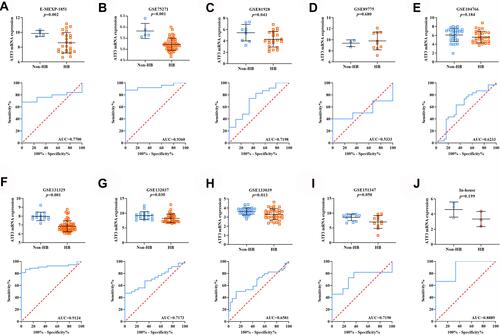
Figure 3 The mRNA expression level and discrimination potential of ATF3 in HB based on 9 studies. (A) Forest plot. (B) Heterogeneity analysis. (C–E) Begg’s, Egger’s and Deek’s tests. (F) SROC curve. (G) DLR.
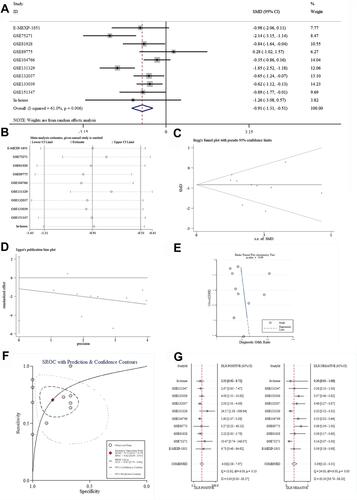
Figure 4 Expression of ATF3 with different clinical parameters. (A–C) E-MEXP-1851; (D–F) GSE75271; (G and H) GSE81928; (I–M) GSE131329; (N) GSE132039; (O) GSE151347.
The Relationship Between ATF3 and Ferroptosis in HB
In previous studies, ATF3 was reported to correlate with ferroptosis in liver tumors such as HCC. Unfortunately, the relationship between ATF3 and ferroptosis in HB has never been revealed. To fill the gap, expression data from GSE104462 were extracted; these data included HB cells treated with erastin and relevant controls. First, we calculated the DEGs of HepG2 cells treated with erastin and drew a volcano plot to visualize the results (). We took the intersection of down-regulated genes in HB, up-regulated genes in HepG2 cells treated with erastin, and ferroptosis-related genes; from this intersection, we obtained two genes, and interestingly, ATF3 was among the two (). shows that the ATF3 expression level was up-regulated in HepG2 cells after being treated with erastin.
Figure 5 The relationship between ATF3 and ferroptosis. (A) Volcano plot of DEGs in HepG2 cells treated with erastin; (B) Venn plot showed that the intersection between down-regulated genes in HB, up-regulated genes in HepG2 cells treated with erastin and ferroptosis related genes; (C) compared with the HB tissue treated with DMSO, the HB tissue treated with erastin expressed higher levels of ATF3; (D) heat map of correlations between ATF3 and other ferroptosis related genes in 9 studies.
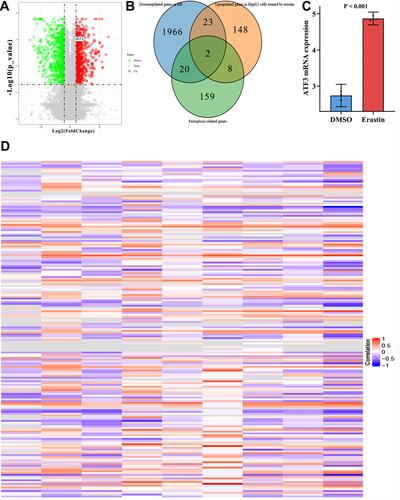
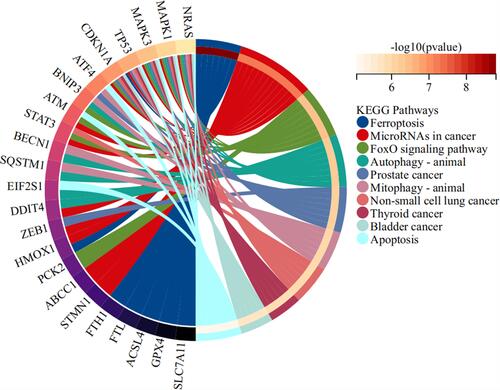
Considering that ATF3 is down-regulated in HB and up-regulated in HB cells treated with a ferroptosis inducer, we have reason to think that ATF3 is associated with the occurrence of ferroptosis. We then extracted ferroptosis-related genes and evaluated the correlation coefficients between ATF3 and ferroptosis-related genes (). Altogether, 4855 putative targets of ATF3 as a transcriptional factor were listed and then they were interacted with the ferroptosis-related genes (n=187). Afterwards, we obtained 60 genes from the above interaction. KEGG analysis indicated that the afore-mentioned 60 genes were significantly enriched in the pathways related to ferroptosis ().
Figure 6 The signaling pathways of ferroptosis-related genes targeted by ATF3. The circle plot was generated by Kyoto Encyclopedia of Genes and Genomes (KEGG) analysis using DAVID V6.8.
Functional Enrichment Analysis of ATF3 DCEGs
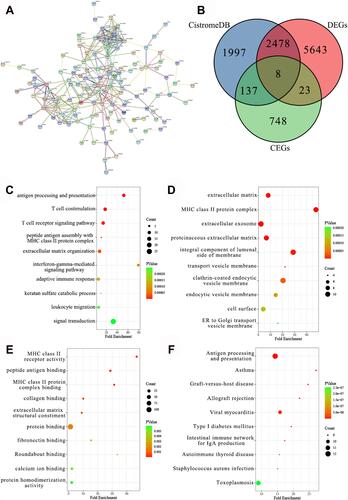
Regarding 181 intersected DCEGs screened from the 10 series, a PPI network was formed to show the connectedness among DCEGs (). We plotted the interactions among down-regulated genes in HB, up-regulated genes in erastin-treated HepG2 cells, and ferroptosis-related genes. Eight genes (F3, GEM, EMILIN1, FSTL3, GLT8D2, GPR176, RRAS, and SERTAD3) were identified as ATF3 target genes in HB (). To further explore the potential signal pathways of ATF3 in HB, enrichment analysis was carried out. Based on GO analysis, ATF3 DCEGs were significantly enriched in the following GO terms: antigen processing and presentation, extracellular matrix, and MHC class II receptor activity (–). The antigen processing and presentation pathway was considered the most potential signal pathway, according to KEGG enrichment analysis, due to ATF3 DCEGs being significantly enriched ().
Figure 7 Enrichment analysis. (A) PPI network analysis of ATF3 DCEGs. (B) EMILIN1 was identified as target gene of ATF3. (C) Enrichment terms of ATF3 DCEGs in biological process. (D) Cellular component. (E) Molecular function. (F) Kyoto Encyclopedia of Genes and Genomes.
The Target Genes of ATF3 in HB
As mentioned above, eight genes were identified as ATF3 target genes. To verify our results, we found the binding peaks of ATF3 for the above genes on CistromeDB, which were shown in and . The respective SMDs were also calculated ( and ). Moreover, we extracted the expression levels of the above target genes from the nine datasets and performed correlation analysis. The results showed that the eight target genes had considerable correlations with ATF3 ().
Figure 8 ATF3 regulates F3 and GEM. (A and C) There was an ATF3 binding peak (the red box) at the transcription initiation sites of GEM and F3. (B and D) Forest plot showing combined SMDs of F3 and GEM. Additionally, the similar results could also be seen in the other 6 genes (EMILIN1, FSTL3, GLT8D2, GPR176, RRAS and SERTAD3).
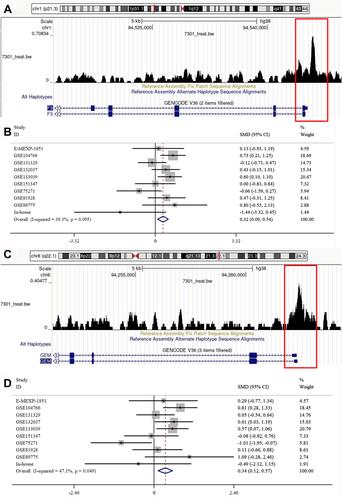
Figure 9 ATF3 had considerable correlations with HLA-DRA and HLA-DQB1. (A–C) Data from E-MEXP-1851, GSE75271, GSE81928; (D–F) data from GSE89775, GSE104766, GSE131329; (G–I) data from GSE132037, GSE133039, GSE151347. The pure number in bold represents Pearson correlation coefficient, and one or more *Represent significant difference.
Correlation Analysis Between ATF3 and Immune-Related Genes
According to enrichment analysis, ATF3 DCEGs were significantly enriched in the antigen processing and presentation pathway, which is an immune-related signal pathway. We therefore sought to determine whether this enrichment indicated that ATF3 and its DCEGs are also related to the mRNA expression of immune-related genes. We extracted 57 immune-related gene expression data points from the nine studies and performed a correlation analysis with ATF3. ATF3 was significantly associated with the majority of immune-related genes ().
Table 3 Correlation Analysis Between ATF3 Markers of Immune Cells in HB Based on 9 Studies
Discussion
The functions of ATF3 in HCC have been reported in previous studies, but the expression level and molecular mechanisms of ATF3 in HB are still unnoted. We revealed the expression level of ATF3 in HB using large sample sizes (n = 402) for the first time. According to reported articles, ATF3 was associated with ferroptosis in many types of cancers, so we showed the expression level of ATF3 in HB cells treated with ferroptosis inducer. The results indicated that differentially expressed ATF3 likely affects ferroptosis progress. Moreover, the target genes and signal pathways of ATF3 in HB were also predicted, with immunocorrelation analysis as a supplement to the predicted signal pathways.
In the existing literature, ATF3 was reported to express differentially in breast cancer, nasopharyngeal cancer, HCC, and lung cancer, but no studies have mentioned the expression levels of ATF3 in pan-cancers.Citation24–Citation27 Moreover, studies about ATF3 were limited to malignant tumors in adults, while the expression and functions of ATF3 in common malignant children’s tumors had never been clarified. To fill the gap, we analyzed the expression levels of ATF3 in 33 types of adult tumors and 7 types of children tumors from the RNA-seq data. Our results are a valuable reference for future studies of ATF3. As mentioned above, the previous research of ATF3 in liver tumors focused on HCC; ATF3 research for HB, the most common liver tumor in children, is still an unexplored field. Therefore, we carried out the current study by analyzing high-throughput data concerning the clinical role of ATF3 in HB, as well as the potential mechanism using in vitro and in silico tools. We hypothesized that ATF3 was correlated with ferroptosis in HB based on previous studies, and GSE104462 was utilized to test our reasoning process. First, we found that ATF3 was down-regulated in HB, which indicates that ATF3 could act as a protective factor for HB development. Then, through identifying the DEGs, we found that ATF3 was up-regulated in HB cells treated with a ferroptosis inducer. Finally, ATF3 was correlated with ferroptosis in other cancers. After the crossover of the above three steps, we found two genes on the list: ATF3 and PCK2. Moreover, we estimated the correlation between ATF3 and other ferroptosis-related genes and found close correlations. Based on the above results, we have a compelling reason to think that ATF3 is related to ferroptosis in HB. To prove our hypothesis, we carried out an interaction between ATF3 targets and ferroptosis-related genes. The results indicated that a total of 60 ferroptosis-related genes were targeted by ATF3, KEGG analysis also showed these genes were significantly enriched in the pathways of ferroptosis. Our results proved that ATF3 might be correlated with ferroptosis in HB via various evidences including its expression variation treated by erastin in vitro and its signaling pathways assessed by in silico methods.
As a transcription factor, the biological role of ATF3 cannot be discussed without its target genes. In the researches about malignant tumors, many researchers have defined the target genes and molecular mechanisms of ATF3 in various cancer types. Li et al analyzed breast cancer samples and found that the expression of ATF3 had a positive correlation with ARL4C; ATF3 had a high binding peak at the transcriptional initiation of ARL4C, indicating that ARL4C was an inhibited target regulated by ATF3 in breast cancer.Citation28 Analyzing ATF3 binding sites in gastric cancer, Asakawa et al screened out 96 ATF3 target genes.Citation29 In a study focusing on bladder cancer, Yuan et al proposed that overexpressed ATF3 was able to up-regulate GSN, and high expression of GSN inhibited the metastasis of bladder cancer by changing the structure of actin cells; therefore, GSN might be one of the ATF3 target genes in bladder cancer.Citation30 We herein predicted eight target genes of ATF3 in HB. To support our results, we found the binding peaks of ATF3 at the transcription starting points of the eight genes as presented by the tool of University of California Santa Cruz (UCSC); these binding peaks suggested that these genes were probably the target genes of ATF3 in HB. However, our results should be verified by in vivo and in vitro experimentation.
In previous studies, ATF3 was reported to be correlated with ferroptosis in several cancers, and we also have reasons to think ATF3 is related to ferroptosis in HB. So, what are the potential molecular mechanisms and signal pathways of ATF3 in regulating ferroptosis in HB? The results of enrichment analysis showed that ATF3 DCEGs are significantly enriched in the antigen processing and presentation pathway. This pathway is one of the specific immune response pathways in multicellular organisms and is also regulated by MHC I and II molecules.Citation31 Since DCEGs of ATF3 are enriched in various immune-related pathways, does it mean that ATF3 also plays a regulatory role in immune responses? Studies have shown that the silencing of adenosine A1 receptor (ADORA1) in melanoma cell lines can down-regulate programmed cell death 1 ligand 1 (PD-L1) by inhibiting the expression of ATF3, which weakens immunotherapy’s effect on melanoma.Citation32 In an earlier published research, ATF3 was reported to play a part in the expression of TGF in breast cancer.Citation33 Additionally, we found that the antigen processing and presentation pathway is also related to ferroptosis. Stockwell et al thought the blocking of immune checkpoints might influence antigen processing and transportation, and then inhibit the secretion of interferon and ferroptosis of tumors.Citation34 Liu et al highlighted a new pathway that could inhibit the development of tumors by structuring a novel antigen and inducing ferroptosis in tumor cells.Citation35 To date, the study of ferroptosis and the antigen processing and presentation pathway is in its infancy, and the results presented by KEGG analysis are of limited reference value. Thus, we extracted the expression levels of immune-related genes from nine studies and analyzed the correlations between the expression levels of immune-related genes and ATF3 to provide a theoretical basis for follow-up research.
This research had some limitations. First, while we had the largest sample size in the existing literature on ATF3 in HB, long-term follow-up and larger sample sizes are essential for more reliable data. Second, all the data were collected from tumor and para-tumorous tissue in patients with HB; thus, the expression of ATF3 in body fluid is still unclear; this area needs further exploration with in vivo and in vitro study. Thus, more in-depth researches are required in the future.
Conclusions
In this first exploration of ATF3 expression in HB using mRNA microarray and RNA-seq data from public databases, ATF3 is found to be down-regulated in HB, and we suggest that overexpression of ATF3 is associated with ferroptosis. Furthermore, differential expression of ATF3 may regulate ferroptosis by participating in the antigen processing and presentation pathway; this needs to be further confirmed by future in vivo and in vitro experimentation.
Data Sharing Statement
The data that support the findings of this study are openly available in GEO database at https://www.ncbi.nlm.nih.gov/geo (reference number: GSE75271, GSE81928, GSE89775, GSE104766, GSE131329, GSE132037, GSE133039, GSE151347) and in ArrayExpress at https://www.ebi.ac.uk/arrayexpress (reference number: E-MEXP-1851).
Statement of Ethics
The study protocol conformed to the ethical guidelines of the Declaration of Helsinki and was approved by the Ethics Review Committee of the First Affiliated Hospital of Guangxi Medical University (2020-KY-Guoji-135). Written informed consent was obtained from eligible patients before registration.
Author Contributions
All authors made a significant contribution to the work reported, whether that is in the conception, study design, execution, acquisition of data, analysis and interpretation, or in all these areas; took part in drafting, revising or critically reviewing the article; gave final approval of the version to be published; have agreed on the journal to which the article has been submitted; and agree to be accountable for all aspects of the work.
Acknowledgments
We are grateful to GEO, SRA, TARGET and other public databases for their convenience in data collection. Many analyses were performed through the Sangerbox tools (http://www.sangerbox.com/tool), a free online platform for data analysis. Finally, thanks for the technical support provided by Guangxi Key Laboratory of Medical Pathology.
Disclosure
All authors declare no conflicts of interest in this paper.
Additional information
Funding
References
- Bharti S, Bharti J, Sinha A, Yadav T. Common and rare histological variants of hepatoblastoma in children: a pathological diagnosis and review of the literature. Gastrointest Tumors. 2021;8(2):41–46. doi:10.1159/000512236
- Musick SR, Rouster AS, Babiker HM. Hepatoblastoma. Treasure Island (FL): StatPearls Publishing; 2021.
- Gao Y, Sun Q, Li H, Xie Y, Yao H, Zhao W. [Therapeutic effect and clinical cost of multi-disciplinary team model of hepatoblastoma in children]. Beijing Da Xue Xue Bao Yi Xue Ban. 2020;53(1):200–203. Chinese.
- Zhi T, Zhang W, Zhang Y, Hu H, Wang Y, Huang D. A new risk-stratification system for hepatoblastoma in children under six years old and the significance for prognosis evaluation-a 14-year retrospective study from a single center. BMC Cancer. 2021;21(1):397. doi:10.1186/s12885-021-08095-x
- Venkatramani R, Wang L, Malvar J, et al. Tumor necrosis predicts survival following neo-adjuvant chemotherapy for hepatoblastoma. Pediatr Blood Cancer. 2012;59(3):493–498. doi:10.1002/pbc.24038
- Koh K, Namgoong J, Yoon H, et al. Recent improvement in survival outcomes and reappraisal of prognostic factors in hepatoblastoma. Cancer Med. 2021;10(10):3261–3273. doi:10.1002/cam4.3897
- Katzenstein H, Furman W, Malogolowkin M, et al. Upfront window vincristine/irinotecan treatment of high-risk hepatoblastoma: a report from the Children’s Oncology Group AHEP0731 study committee. Cancer. 2017;123(12):2360–2367. doi:10.1002/cncr.30591
- Schmidt A, Armento A, Bussolati O, et al. Hepatoblastoma: glutamine depletion hinders cell viability in the embryonal subtype but high GLUL expression is associated with better overall survival. J Cancer Res Clin Oncol. 2021;147:3169–3181. doi:10.1007/s00432-021-03713-4
- Hafberg E, Borinstein S, Alexopoulos S. Contemporary management of hepatoblastoma. Curr Opin Organ Transplant. 2019;24(2):113–117. doi:10.1097/MOT.0000000000000618
- Wu Y, Zeng L, Qiu R, et al. Two-stage laparoscopic resection of giant hepatoblastoma in infants combined with liver partial partition and artery ligation. World J Surg Oncol. 2021;19(1):63. doi:10.1186/s12957-021-02156-y
- Lee Y, Tan Y, Oon C. Molecular targeted therapy: treating cancer with specificity. Eur J Pharmacol. 2018;834:188–196. doi:10.1016/j.ejphar.2018.07.034
- Nagae G, Yamamoto S, Fujita M, et al. Genetic and epigenetic basis of hepatoblastoma diversity. Nat Commun. 2021;12(1):5423. doi:10.1038/s41467-021-25430-9
- Li J, Cao F, Yin H, et al. Ferroptosis: past, present and future. Cell Death Dis. 2020;11(2):88. doi:10.1038/s41419-020-2298-2
- Sun X, Ou Z, Chen R, et al. Activation of the p62-Keap1-NRF2 pathway protects against ferroptosis in hepatocellular carcinoma cells. Hepatology (Baltimore, Md). 2016;63(1):173–184. doi:10.1002/hep.28251
- Yu Y, Jiang L, Wang H, et al. Hepatic transferrin plays a role in systemic iron homeostasis and liver ferroptosis. Blood. 2020;136(6):726–739. doi:10.1182/blood.2019002907
- Liang J, Wang D, Lin H, et al. A novel ferroptosis-related gene signature for overall survival prediction in patients with hepatocellular carcinoma. Int J Biol Sci. 2020;16(13):2430–2441. doi:10.7150/ijbs.45050
- Lippmann J, Petri K, Fulda S, Liese J. Redox modulation and induction of ferroptosis as a new therapeutic strategy in hepatocellular carcinoma. Transl Oncol. 2020;13(8):100785. doi:10.1016/j.tranon.2020.100785
- Ku H, Cheng C. Master regulator activating transcription factor 3 (ATF3) in metabolic homeostasis and cancer. Front Endocrinol (Lausanne). 2020;11:556. doi:10.3389/fendo.2020.00556
- Wang L, Liu Y, Du T, et al. ATF3 promotes erastin-induced ferroptosis by suppressing system Xc. Cell Death Differ. 2020;27(2):662–675. doi:10.1038/s41418-019-0380-z
- Fei Z, Lijuan Y, Jing Z, Xi Y, Yuefen P, Shuwen H. Molecular characteristics associated with ferroptosis in hepatocellular carcinoma progression. Hum Cell. 2021;34(1):177–186. doi:10.1007/s13577-020-00431-w
- Wang Y, Quan F, Cao Q, et al. Quercetin alleviates acute kidney injury by inhibiting ferroptosis. J Adv Res. 2021;28:231–243. doi:10.1016/j.jare.2020.07.007
- Chen P, Wu J, Xu Y, et al. Zinc transporter ZIP7 is a novel determinant of ferroptosis. Cell Death Dis. 2021;12(2):198. doi:10.1038/s41419-021-03482-5
- Eleftheriadis T, Pissas G, Golfinopoulos S, Liakopoulos V, Stefanidis I. Role of indoleamine 2,3-dioxygenase in ischemia-reperfusion injury of renal tubular epithelial cells. Mol Med Rep. 2021;23(6). doi:10.3892/mmr.2021.12111
- Zhao W, Sun M, Li S, Chen Z, Geng D. Transcription factor ATF3 mediates the radioresistance of breast cancer. J Cell Mol Med. 2018;22(10):4664–4675. doi:10.1111/jcmm.13688
- Du A, Jiang Y, Fan C. NDRG1 downregulates ATF3 and inhibits cisplatin-induced cytotoxicity in lung cancer A549 cells. Int J Med Sci. 2018;15(13):1502–1507. doi:10.7150/ijms.28055
- Li L, Song S, Fang X, Cao D. Role of ATF3 as a prognostic biomarker and correlation of ATF3 expression with macrophage infiltration in hepatocellular carcinoma. BMC Med Genomics. 2021;14(1):8. doi:10.1186/s12920-020-00852-4
- Yan L, Gaddis S, Coletta L, et al. ATF3-induced mammary tumors exhibit molecular features of human basal-like breast cancer. Int J Mol Sci. 2021;22(5):2353. doi:10.3390/ijms22052353
- Li L, Sun R, Jiang G. ATF3 demethylation promotes the transcription of ARL4C, which acts as a tumor suppressor in human breast cancer. Onco Targets Ther. 2020;13:3467–3476. doi:10.2147/OTT.S243632
- Asakawa Y, Okabe A, Fukuyo M, et al. Epstein-Barr virus-positive gastric cancer involves enhancer activation through activating transcription factor 3. Cancer Sci. 2020;111(5):1818–1828. doi:10.1111/cas.14370
- Yuan X, Yu L, Li J, et al. ATF3 suppresses metastasis of bladder cancer by regulating gelsolin-mediated remodeling of the actin cytoskeleton. Cancer Res. 2013;73(12):3625–3637. doi:10.1158/0008-5472.CAN-12-3879
- Kelly A, Trowsdale J. Genetics of antigen processing and presentation. Immunogenetics. 2019;71(3):161–170. doi:10.1007/s00251-018-1082-2
- Liu H, Kuang X, Zhang Y, et al. ADORA1 inhibition promotes tumor immune evasion by regulating the ATF3-PD-L1 axis. Cancer Cell. 2020;37(3):324–339.e328. doi:10.1016/j.ccell.2020.02.006
- Yin X, Wolford C, Chang Y, et al. ATF3, an adaptive-response gene, enhances TGF{beta} signaling and cancer-initiating cell features in breast cancer cells. J Cell Sci. 2010;123:3558–3565. doi:10.1242/jcs.064915
- Stockwell B, Jiang X. A physiological function for ferroptosis in tumor suppression by the immune system. Cell Metab. 2019;30(1):14–15. doi:10.1016/j.cmet.2019.06.012
- Liu Y, Zhang X, Zhang J, Tan J, Li J, Song Z. Development and validation of a combined ferroptosis and immune prognostic classifier for hepatocellular carcinoma. Front Cell Dev Biol. 2020;8:596679. doi:10.3389/fcell.2020.596679