
Abstract
Background
Nonalcoholic fatty liver disease (NAFLD) is the most common progressive liver disease worldwide. It can cause liver cancer and possibly death. Abnormal immune infiltration is involved in the progression of NAFLD. The aim of this study was to identify and validate the hub immune-related genes in NAFLD.
Methods
Microarray data were downloaded from Gene Expression Omnibus, and immune-related differentially expressed genes (IRDEGs) were obtained. A protein–protein interaction network was used to further screen. The diagnostic value of the IRDEGs was evaluated by receiver operating characteristic curves. Differences in immune infiltration levels were analyzed using single-sample gene set enrichment analysis. Hub IRDEGs were identified by correlation analysis with immune infiltration levels. Finally, molecular experiments were used to confirm the expression of the hub IRDEGs and explore their roles in NAFLD.
Results
We obtained 18 IRDEGs. Five hub genes were further identified by protein–protein interaction network, receiver operating characteristic curves and correlation analysis: AQP9, BACH2, CD4, IL17RE and S100A9. Based on functional enrichment analysis, the hub genes were enriched primarily in many immune-related pathways. In NAFLD, AQP9, CD4, and IL17RE expression was significantly reduced, whereas BACH2 and S100A9 expression was elevated. PCR, oil red O staining and triglyceride detection revealed that the knock-down of BACH2 and S100A9 reduced lipid accumulation in NAFLD cells.
Conclusion
This study provided insight into the profile of immune infiltration underlying NAFLD and identified AQP9, BACH2, CD4, IL17RE and S100A9 as ancillary diagnostic indicators of NAFLD. And BACH2 and S100A9 might be therapeutic targets for NAFLD.
Introduction
Nonalcoholic fatty liver disease (NAFLD) is a potentially serious liver disease. 2019 data suggested that the prevalence of NAFLD in Asia had exceeded 30%, as high as the figures for Europe and North America.Citation1–3 NAFLD is characterized by liver steatosis without a clear cause such as excessive alcohol consumption.Citation4 Liver steatosis alone has a 20–30% chance of progressing to nonalcoholic steatohepatitis (NASH). And NASH may lead to cirrhosis, liver failure, and even hepatocellular carcinoma (HCC).Citation5,Citation6 Notably, even in the absence of cirrhosis, NAFLD may predispose patients to HCC.Citation7 Therefore, NAFLD is currently a widespread public health issue.
Abnormal lipid accumulation has been demonstrated to cause liver inflammation, a hallmark of NAFLD progression to HCC.Citation8 During this process, the immune system is abnormally activated, resulting in harmful inflammation. This state could lead to increased liver infiltration and the accumulation of inflammatory cells, which exacerbates liver damage.Citation9 Furthermore, NAFLD can promote HCC development by inducing apoptosis in CD4+ T cells.Citation10 Therefore, identifying the immune-related molecular mechanisms that play a role in the progression of NAFLD is critical for both early diagnosis and the discovery of new treatment targets.
The advancement of bioinformatics has made it possible to address the aforementioned questions. To date, various methods, such as functional enrichment analysis and immune infiltration analysis, have been widely used to investigate the molecular mechanisms of disease development. The aim of this study was to search for hub immune-related genes in the development of NAFLD by a series of bioinformatics analyses. Next, we explored the role of hub genes in NALFD. In addition, we calculated the diagnostic value of the hub genes to aid in clinical diagnosis. Finally, we performed molecular experiments to validate our findings.
Methods and Materials
Data Collection and Processing
Microarray expression data for NAFLD were downloaded from Gene Expression Omnibus. The GSE160016 dataset included data for 5 patients with NAFLD and 6 healthy controls.Citation11 When multiple probes were mapped to the same gene symbol, the mean value was selected as the gene expression value.
Identification of Immune-Related Differentially Expressed Genes (IRDEGs)
Differentially expressed genes (DEGs) were obtained using the limma packageCitation12 with screening criteria of P < 0.05 and |log fold change (FC)| > 1. We obtained immune-related genes from the ImmPort database.Citation13 Marker genes for immune cells were obtained from a previous study.Citation14 DEGs that overlapped with both of these sets of genes were defined as IRDEGs.
Functional Analysis of IRDEGs
Gene Ontology (GO) and Kyoto Encyclopedia of Genes and Genomes (KEGG) enrichment analyses were used to understand the biological functions and signaling pathways of the IRDEGs associated with NAFLD. GO analysis included the categories of biological process (BP), cellular component (CC) and molecular function (MF). Disease Ontology (DO) enrichment analysis was used to identify diseases in which the IRDEGs might be involved. Finally, enrichment analysis of IRDEGs in tissues and cells was performed using the CellMarker database.Citation15
To explore the potential mechanisms of immune function during NAFLD progression, the immunological signature gene set (c7.all.v7.5.1.symbols.gmt) in MSigDB was used as a reference for gene set enrichment analysis (GSEA). Genes for which |normalized enrichment score (NES)| > 1 and P < 0.05 were considered significantly enriched.
Finally, a protein–protein interaction (PPI) network for the IRDEGs was constructed using data from the STRING database with a confidence level of 0.4. Genes that did not interact with other nodes in this network were not included in further analyses. Furthermore, we used the maximal clique centrality (MCC) metric to determine the importance of individual nodes in the network.
Screening of Hub IRDEGs
With the data in GSE160016, we used receiver operating characteristic (ROC) curves to assess the diagnostic value for NAFLD of the IDEGs. Validation was performed using the GSE126848 dataset.
Single-sample gene set enrichment analysis (ssGSEA) was then used to investigate the level of immune infiltration in each sample. The resulting score was derived by calculating the expression levels of specific marker genes.Citation16 Box plots were used to show differences in immune infiltration levels. A gene that correlated with a differential immune infiltration level and had an area under the curve (AUC) greater than 0.7 in both datasets was defined as a hub IRDEG.
Functional Enrichment Analysis of Hub IRDEGs
Correlations between the expression of hub IRDEGs were calculated using Spearman correlation analysis. We used GeneMANIA to investigate the network of the hub IRDEGs and their coexpressed genes. Finally, GO and KEGG enrichment analyses were carried out to investigate the functions involving the hub IRDEGs.
Detecting the Role of Hub IRDEGs in NAFLD
Cell Culture, Animal Experiments and Clinical Samples
HepG2 cell line was purchased from Procell Biotechnology Co., Ltd. (Wuhan, China). The identification certificate of HepG2 was shown in Appendices I and II. Cells were maintained in MEM supplemented with 10% (v/v) heat-inactivated fetal bovine serum (FBS), penicillin G (100 units/mL) and streptomycin (100 μg/mL), and kept at 37°C in a humidified atmosphere containing 5% CO2. Based on published literature, we used palmitic acid (PA) to establish a NAFLD cell model.Citation17,Citation18 PA (Sigma, USA) was completely dissolved in anhydrous ethanol at a concentration of 500 mM and mixed with equimolar amounts of NaOH. This PA stock solution was added to the bovine serum albumin (BSA) solution to achieve a final PA concentration of 0.4 mmol/L, dissolved by heating in a water bath at 55 °C and filtered through a 0.22 um microporous membrane, and cooled to room temperature to obtain the PA-BSA complex which is the PA induction solution. Cells were inoculated in 6-well plates and then starved for 12 h. After that, PA induction solution was added and treated for 24 h.
The NAFLD model was established using C57BL/6 male mice according to previous studies.Citation19,Citation20 In a short, regular diet was replaced with a diet containing 60 kcal% fat. In addition, the sex of the mice did not hinder the establishment of animal model. Mice were purchased from Vital River (Beijing, China). The livers from animals would be used for validation. National Institutes of Health guide for the care and use of Laboratory animals (NIH Publications No. 8023, revised 1978) had been followed.
Human blood samples were obtained from NAFLD patients at Shandong Provincial Hospital from November 2021 to November 2022. Inclusion criteria: (1) patients were diagnosed with NAFLD by ultrasonography and relevant blood biochemical tests, and met the relevant diagnostic criteria in the “Guidelines for the diagnosis and treatment of non-alcoholic fatty liver disease”Citation1 developed by the Chinese Medical Association, and had no history of excessive alcohol consumption (ethanol intake < 140g/week for men and < 70g/week for women); (2) patients had no abnormal mental status.
Exclusion criteria: (1) combined with other liver diseases such as viral hepatitis, immune hepatitis, alcoholic hepatitis; (2) combined with underlying diseases such as diabetes, hypertension, coronary artery disease or renal disease; (3) combined with autoimmune diseases or hematological diseases; (4) combined with malignant neoplasm; (5) received other medications within 4 weeks.
Healthy subjects who underwent physical examination at our hospital during the same period were selected as the controls. All vital signs were normal and there was no history of underlying diseases such as diabetes, hypertension and liver diseases. All patients and subjects had signed an informed consent form.
Cell Transfection
The small interference RNA (siRNA) of BACH2 and S100A9 and negative control siRNA (siNC) were purchased from Genechem (Shanghai, China). Cells were transfected according to the manufacturer’s instructions. We used PCR to analyze transfection efficiency.
Quantitative Real-Time PCR and Immunohistochemistry
RNA was extracted using TRIzol reagent and PCR was performed to determine the mRNA expression levels of genes based on previous studies.Citation21 GAPDH was used as the internal control, and relative gene expression was calculated by the 2–ΔΔCt method. The sequences of the primers used are listed in Supplemental Table 1.
Mice were anesthetized and sacrificed. The livers were made into deparaffinized sections. For immunohistochemistry analysis, we conducted it according to previous study.Citation22 The antibodies of BACH2 and S100A9 were purchased from Affinity Biosciences (Cincinnati, USA) and diluted according to the manufacturer’s protocol. For all stains, samples with inadequate staining due to technical problems were excluded.
Oil Red O Staining and Triglyceride Detection
Based on published literature, we performed the oil red O staining to detect the lipid accumulation in cells.Citation23
According to the manufacturer’s instructions, we used commercially available kits (BC0625, Solarbio, China) to detect triglyceride in cells.
Statistical Analysis and Ethics Statements
All experiments were repeated at least three times independently. All statistical information was shown in the figures, figure legends. The data distribution was assumed to be normal but this was not formally tested. The allocation in animal experiments was random. Data collection and analysis were not blind to the conditions of the experiments. Continuous variables were expressed as the means ± standard deviations. The Student’s t-test was used to determine the significance of differences. R (version 4.1.2) was used for all statistical analyses, and the significance level was set at P < 0.05. The codes used in this study were uploaded as Supplementary Materials.
The study was conducted according to the guidelines of the Declaration of Helsinki and approved by the Biomedical Research Ethic Committee of Shandong Provincial Hospital (SWYX: NO. 2021–270; SWYX: NO. 2021–497).
Results
Identification of IRDEGs
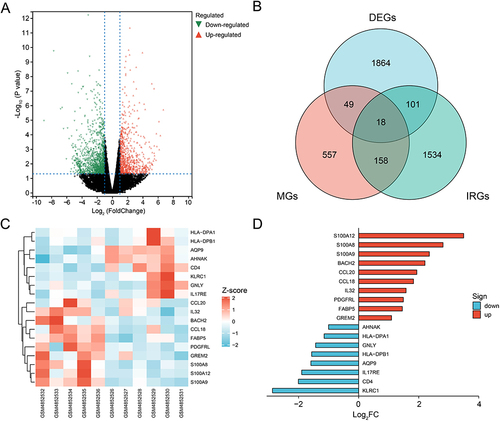
We identified 2033 DEGs based on the screening criteria: 833 upregulated genes and 1200 downregulated genes (). Eighteen IRDEGs were obtained after determining the overlap among the sets of genes (). The expression levels and log2FC values of these genes are shown in and . More detailed data is shown in .
Table 1 Detail Information of Eighteen IRDEGs
Figure 1 Identification of IRDEGs in NAFLD. Volcano map of DEGs (A). Venn diagram indicated the overlap of DEGs in NAFLD, immune-related genes from ImmPort database and marker genes of immune cells to obtain 18 IRDEGs (B). Heat plot and horizontal bar chart showed the expression profile and fold change of 18 IRDEGs (C and D).
Functional Enrichment Analysis of the IRDEGs
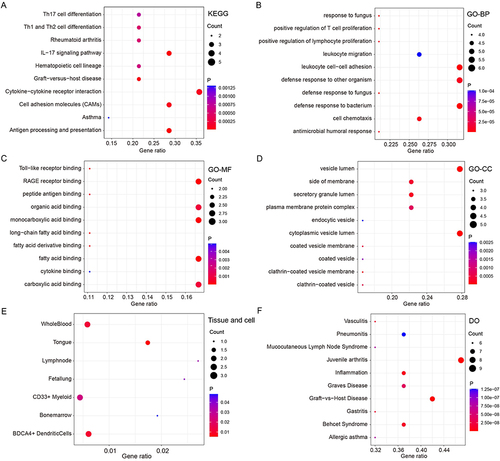
KEGG signaling pathway enrichment analysis indicated that the IRDEGs were involved in various immune-related pathways, including antigen processing and delivery, the IL-17 signaling pathway, and the differentiation of Th1, Th2, and Th17 cells (). The IRDEGs were primarily enriched in BP terms related to defense processes (eg, defense responses against bacteria and fungi and cellular chemotaxis) (). In terms of CCs and MFs, the IRDEGs were closely related to MHC and fatty acid binding ( and ). DO enrichment analysis revealed that the IRDEGs were also involved in numerous immune function-related diseases, such as psoriatic arthritis disorders (). As shown in , the IRDEGs were enriched primarily in T cells.
Figure 2 Functional enrichment analysis of IRDEGs. KEGG plot showed the top 10 enriched pathways of IRDEGs (A). GO plots showed the enriched functions of IRDEGs in biological processes (BP), cellular components (CC), and molecular functions (MF) (B–D). The enriched diseases, tissue and cell of IRDEGs (E and F).
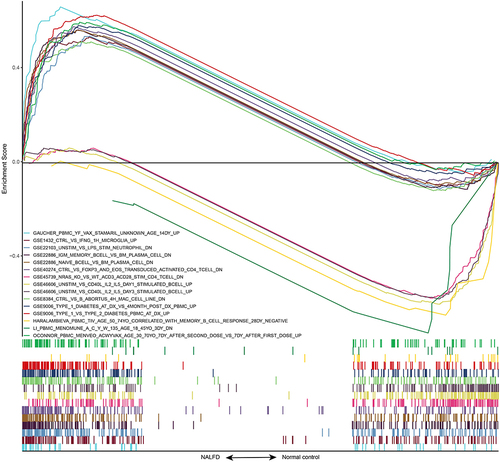
GSEA indicated that these gene sets were enriched primarily in CD4+ T cells and B cells. shows the top 15 enriched gene sets, and Supplemental Table 2 contains more information. In summary, these findings demonstrated that immune-related genes play a critical role in the development and progression of NAFLD.
Figure 3 Enrichment plot for GSEA immunologic signature database.
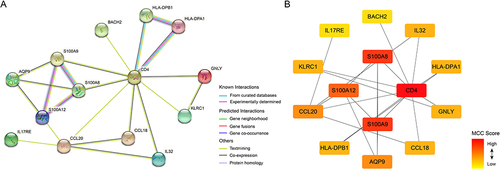
Next, we used PPI analysis to perform a preliminary screen of the IRDEGs, yielding a network of 14 genes (). The MCC scores shown in revealed that the three most central genes in this network were CD4, S100A8, and S100A9.
Figure 4 PPI network and MCC analysis. Construction of PPI network based on IRDEGs in STRING database and disconnected nodes were hided (A). The MCC scores of IRDEGs were analyzed using Cytohubba and displayed in Cytoscape software (B).
Identification of Hub IRDEGs
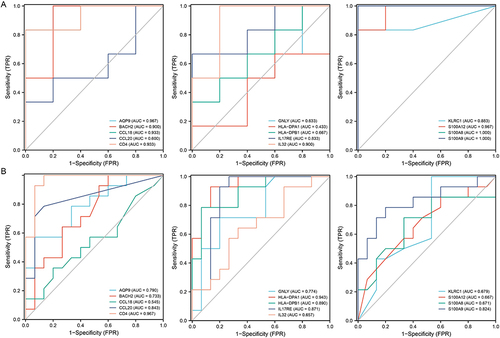
To determine the diagnostic value of the IRDEGs in NAFLD, we first used GSE160016 as the training dataset. The findings revealed that most of the IRDEGs had a high diagnostic value (AUC > 0.7). Only nine genes (AQP9, BACH2, CCL20, CD4, GNLY, HLA-DPA1, HLA-DPB1, IL17RE, and S100A9) retained an AUC of greater than 0.7 after validation with GSE126848 ().
Figure 5 Diagnostic value of 14 IRDEGs in two datasets. The ROC curves of 14 IRDEGs in GSE160016 (A). The diagnostic value of 14 IRDEGs was validated using the data in GSE126848 (B).
We used ssGSEA with the GSE160016 dataset to analyze immune infiltration in NAFLD (). In , the Wilcoxon rank–sum test results revealed that the infiltration level of T helper cells, the infiltration level of Tfh cells, and the type I IFN response were decreased in NAFLD (P < 0.05). Next, we performed Spearman correlation analysis ( and ). Finally, we identified five hub IRDEGs: AQP9, BACH2, CD4, IL17RE, and S100A9. The associations between the expression levels of these genes are shown in .
Figure 6 Correlation analysis between immune infiltration and IRDEGs. The heat map of immune infiltration levels (A). Box plot showed the level of identified immune cells and function between NAFLD and control samples (B). The correlation between IRDEGs and immune cells and function (C and D).
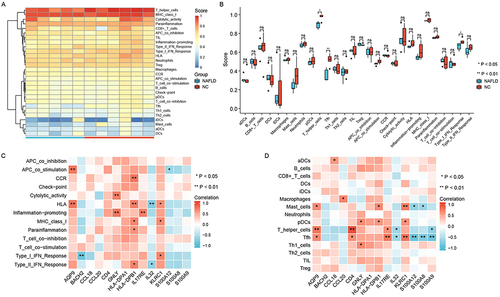
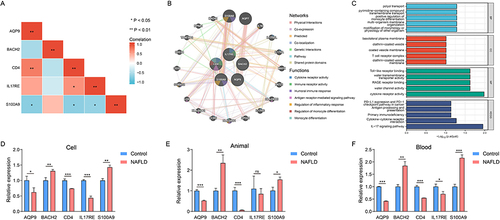
Figure 7 The function enrichment analysis and validation of hub IRDEGs. Heat map showed the correlation of hub IRDEGs expression (A). Hub IRDEGs and their co-expression genes were analyzed using GeneMANIA (B). GO and KEGG enrichment analysis of hub IRDEGs (C). Validation of hub IRDEGs expression in cell (D), animal model (E) and human blood (F) (*P < 0.05; **P < 0.01; ***P < 0.001).
Functional Enrichment Analysis of the Hub IRDEGs
We further investigated the functions of the hub IRDEGs. As shown in and , the hub genes were involved in various immune-related biological functions, such as immune receptor activity and inflammatory response regulation. These findings implied that the hub IRDEGs influence the progression of NAFLD by regulating immune function.
Validation of Hub IRDEG Expression in NAFLD
We used quantitative real-time PCR to confirm the expression levels of the hub IRDEGs. As shown in , the expression of AQP9, CD4, and IL17RE was significantly lower but that of BACH2 and S100A9 was higher in NAFLD cells. The same trend was found for all genes except for IL17RE in the established NAFLD animal model (). Finally, we obtained blood samples from 18 NAFLD patients and 18 healthy controls. The expression levels of the hub IRDEGs in human blood were consistent with those in NAFLD cells ().
The Knock-Down of BACH2 and S100A9 Reduced Lipid Accumulation in NAFLD Cells
In five hub IRDEGs, the expression of BACH2 and S100A9 was up-regulated in NAFLD. Thus, we decided to explore their roles in NAFLD.
First of all, we further confirmed the histological expression of BACH2 and S100A9. As evidenced by immunohistochemical staining analysis, the expression of BACH2 and S100A9 was increased in the livers of NAFLD mice ().
Figure 8 Detecting the role of BACH2 and S100A9 in NAFLD cells. Representative immunohistochemistry images of BACH2 and S100A9 in mice livers (scale bars, 50μm) (A). The knock-down of BAHC2 and S100A9 (***P < 0.001) (B). PCR to detect several maker genes of lipid accumulation after transfection (ns, not significant; *P < 0.05; **P < 0.01; ***P < 0.001) (C). Representative images of oil red O staining (scale bars, 50μm) (D). Triglyceride detection (**P < 0.01; ***P < 0.001) (E).
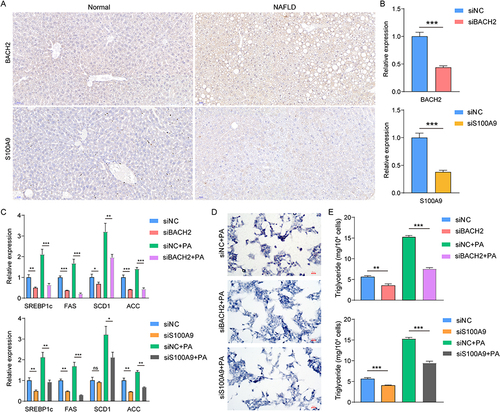
In , we successfully knocked down the expression of BACH2 and S100A9 in HepG2 cells. Next, we detected the expression of several marker genes of lipid accumulation (SREBP1c, FAS, SCD1 and ACC) (). We found that the expression of all marker genes decreased after transfection. In the NAFLD cell model established by PA, the same phenomenon was observed. Oil Red O staining revealed that siBAHC2 and siS100A9 inhibited the lipid accumulation and reduced triglyceride levels in NAFLD cells ( and ).
Discussion
Recently, studies have confirmed that the immune system plays an important role in the initiation and progression of liver inflammation in patients with NAFLD.Citation9 Different T-cell populations are involved in the immunopathogenesis of NAFLD, and the progression from steatosis to NASH is accompanied by a progressive increase in the accumulation of natural killer T cells.Citation24 Since regulatory T cells and Th17 cells represent the two extremes of the immune response (tolerance and inflammation), it has been suggested that NAFLD progression may be associated with disruption of this balance.Citation25 Our data showed that the infiltration levels of helper T cells and Tfh cells were decreased in NAFLD, reflecting the diminished partial immune response in NAFLD. Moreover, a study by Ma et al demonstrated that NAFLD led to the loss of selective CD4+ T cells and promoted hepatocarcinogenesis.Citation10 These results suggest that the immune system is suppressed during hepatic progression from steatosis through NAFLD to HCC. However, data on the behavior of T cells in the liver are scarce, and we cannot yet identify the specific mechanisms that trigger this process. In addition, some studies have shown that adipose tissue may directly contribute to the progression of NAFLD through cytokines and immune signaling and lead to liver injury.Citation26,Citation27
In the present study, we identified five hub genes: AQP9, CD4, IL17RE, BACH2 and S100A9. Among these genes, AQP9 plays a major role in glycerol uptake by mouse hepatocytes.Citation28 One study reported that AQP9 expression was downregulated in a mouse model of NAFLD,Citation29 a pattern that was also found in the human liver.Citation30 However, some studies have shown that AQP9 overexpression increases the degree of steatosis.Citation31 These findings seem to be contradictory. We think that the difference in the level of AQP9 expression may be due to the difference in the degree of steatosis, and further studies are needed to demonstrate this relationship.
S100A9 encodes a binding protein that plays an important role in the regulation of inflammatory processes and immune responses.Citation32–34 High expression levels of S100A9 have been identified in patients with cardiovascular disease and diabetes.Citation35,Citation36 Our study showed upregulation of S100A9 expression in NAFLD. And siS100A9 could inhibited NAFLD progression. Consistent with previous studies, S100A9 had a high diagnostic value in NAFLD (AUC close to 1) and was a sensitive marker of NAFLD progression.Citation37 Thus, S100A9 undoubtedly has a high potential for clinical application.
Unlike the associations of the other three genes, the associations of IL17RE and BACH2 with NAFLD were previously identified. IL17RE acts as a receptor for interleukin-17C (IL-17C), and the IL-17C/IL17RE signaling axis activates immune function during infection. Mice lacking IL17RE are unable to fight infection.Citation38 This observation demonstrates the important role of IL17RE in activating immune function. However, uncontrolled activation can sometimes occur. IL17RE has been shown to exacerbate the course of autoimmune encephalitis,Citation39 and the IL-17C/IL17RE axis was shown to significantly promote renal tissue damage in a mouse model of crescentic nephritis.Citation40 To date, IL17-RE has been little studied in the liver. Some studies have reported that the IL-17C/IL17RE axis enhances T-cell function in autoimmune hepatitis and that high IL17RE expression is associated with poor prognosis in HCC.Citation41,Citation42 Our data showed decreased expression levels of IL17RE in NAFLD. Similar to IL17RE, BACH2 is involved in T-cell regulation. BACH2 negatively regulates CD4+ T cells and can maintain CD4+ T cells in a naive state by suppressing effector memory-related genes.Citation43 Moreover, S100 calcium binding protein a was identified as a direct target gene of BACH2. In our study, the expression of both BACH2 and S100A9 was elevated in NAFLD, but the positive correlation between their expression was not statistically significant. In addition, some studies have demonstrated a low number of CD4+ T cells in NASH.Citation44 Considering the functions of IL17RE and BACH2, these results further demonstrate that immune function is suppressed in NAFLD.
Although five immune-related genes with good diagnostic value in patients with NAFLD were identified in this study, some limitations remain. First, the findings need to be validated using tissue-based flow cytometry. Second, the associations between immune cells and related genes as well as disease severity require further estimation.
Conclusions
This study provided initial insight into immune infiltration in NAFLD and identified AQP9, CD4, IL17RE, BACH2 and S100A9 as ancillary diagnostic indicators of NAFLD. However, future studies that use flow cytometry to analyze larger samples and incorporate clinical information are necessary to validate these findings.
Availability of Supporting Data
The data generated during and/or analyzed during the current study are available from the corresponding author on reasonable request.
Ethical Approval and Consent to Participate
The study was conducted according to the guidelines of the Declaration of Helsinki and approved by the Biomedical Research Ethic Committee of Shandong Provincial Hospital (SWYX: NO. 2021-270; SWYX: NO. 2021-497).
Consent for Publication
All authors have read the final version of the manuscript and agreed to its publication.
Author Contributions
All authors made substantial contributions to conception and design, acquisition of data, or analysis and interpretation of data; took part in drafting the article or revising it critically for important intellectual content; agreed to submit to the current journal; gave final approval of the version to be published; and agree to be accountable for all aspects of the work.
Disclosure
The authors state that they have no conflicts of interest in this work.
Additional information
Funding
References
- Yip TC-F, Lee HW, Chan WK, et al. Asian perspective on NAFLD-associated HCC. J Hepatol. 2022;76(3):726–734. doi:10.1016/j.jhep.2021.09.024
- Lazarus JV, Mark HE, Anstee QM, et al. Advancing the global public health agenda for NAFLD: a consensus statement. Nat Rev Gastroenterol Hepatol. 2022;19(1):60–78.
- Li J, Zou B, Yeo YH, et al. Prevalence, incidence, and outcome of non-alcoholic fatty liver disease in Asia, 1999–2019: a systematic review and meta-analysis. Lancet Gastroenterol Hepatol. 2019;4(5):389–398. doi:10.1016/S2468-1253(19)30039-1
- Chalasani N, Younossi Z, Lavine JE, et al. The diagnosis and management of non-alcoholic fatty liver disease: practice guideline by the American Association for the Study of Liver Diseases, American College of Gastroenterology, and the American Gastroenterological Association. Hepatology. 2012;55(6):2005–2023. doi:10.1002/hep.25762
- Loomba R, Adams LA. The 20% rule of NASH progression: the natural history of advanced fibrosis and cirrhosis caused by NASH. Hepatology. 2019;70(6):1885–1888. doi:10.1002/hep.30946
- Anstee QM, Reeves HL, Kotsiliti E, et al. From NASH to HCC: current concepts and future challenges. Nat Rev Gastroenterol Hepatol. 2019;16(7):411–428.
- Nati M, Chung KJ, Chavakis T. The role of innate immune cells in nonalcoholic fatty liver disease. J Innate Immun. 2022;14(1):31–41. doi:10.1159/000518407
- Meli R, Mattace Raso G, Calignano A. Role of innate immune response in non-alcoholic Fatty liver disease: metabolic complications and therapeutic tools. Front Immunol. 2014;5:177. doi:10.3389/fimmu.2014.00177
- Arrese M, Cabrera D, Kalergis AM, et al. Innate immunity and inflammation in NAFLD/NASH. Dig Dis Sci. 2016;61(5):1294–1303. doi:10.1007/s10620-016-4049-x
- Ma C, Kesarwala AH, Eggert T, et al. NAFLD causes selective CD4(+) T lymphocyte loss and promotes hepatocarcinogenesis. Nature. 2016;531(7593):253–257. doi:10.1038/nature16969
- Hou J, Zhang J, Cui P, et al. TREM2 sustains macrophage-hepatocyte metabolic coordination in nonalcoholic fatty liver disease and sepsis. J Clin Invest. 2021;131(4). doi:10.1172/JCI135197
- Ritchie ME, Phipson B, Wu D, et al. limma powers differential expression analyses for RNA-sequencing and microarray studies. Nucleic Acids Res. 2015;43(7):e47. doi:10.1093/nar/gkv007
- Bhattacharya S, Dunn P, Thomas CG, et al. ImmPort, toward repurposing of open access immunological assay data for translational and clinical research. Sci Data. 2018;5:180015. doi:10.1038/sdata.2018.15
- Bindea G, Mlecnik B, Tosolini M, et al. Spatiotemporal dynamics of intratumoral immune cells reveal the immune landscape in human cancer. Immunity. 2013;39(4):782–795. doi:10.1016/j.immuni.2013.10.003
- Zhang X, Lan Y, Xu J, et al. CellMarker: a manually curated resource of cell markers in human and mouse. Nucleic Acids Res. 2019;47:D721–D728. doi:10.1093/nar/gky900
- Subramanian A, Tamayo P, Mootha VK, et al. Gene set enrichment analysis: a knowledge-based approach for interpreting genome-wide expression profiles. Proc Natl Acad Sci U S A. 2005;102(43):15545–15550. doi:10.1073/pnas.0506580102
- Li M, Xu C, Shi J, et al. Fatty acids promote fatty liver disease via the dysregulation of 3-mercaptopyruvate sulfurtransferase/hydrogen sulfide pathway. Gut. 2018;67(12):2169–2180. doi:10.1136/gutjnl-2017-313778
- Park M, Yoo J-H, Lee Y-S, et al. Extract attenuates non-alcoholic fatty liver disease in free fatty acid-induced HepG2 hepatocytes and in high fat diet-fed mice. Nutrients. 2019;11(3):494. doi:10.3390/nu11030494
- Jiang C, Xie C, Li F, et al. Intestinal farnesoid X receptor signaling promotes nonalcoholic fatty liver disease. J Clin Invest. 2015;125(1):386–402. doi:10.1172/JCI76738
- Wang M, Li B, Qin F, et al. Obesity induced Ext1 reduction mediates the occurrence of NAFLD. Biochem Biophys Res Commun. 2022;589:123–130. doi:10.1016/j.bbrc.2021.12.017
- Zhang L, Jiao G, Ren S, et al. Exosomes from bone marrow mesenchymal stem cells enhance fracture healing through the promotion of osteogenesis and angiogenesis in a rat model of nonunion. Stem Cell Res Ther. 2020;11(1):38. doi:10.1186/s13287-020-1562-9
- You Y, Liu J, Zhang L, et al. WTAP-mediated m(6)A modification modulates bone marrow mesenchymal stem cells differentiation potential and osteoporosis. Cell Death Dis. 2023;14(1):33. doi:10.1038/s41419-023-05565-x
- Zhao NQ, Li X-Y, Wang L, et al. Palmitate induces fat accumulation by activating C/EBPβ-mediated G0S2 expression in HepG2 cells. World J Gastroenterol. 2017;23(43):7705–7715. doi:10.3748/wjg.v23.i43.7705
- Syn WK, Htun Oo Y, Pereira TA, et al. Accumulation of natural killer T cells in progressive nonalcoholic fatty liver disease. Hepatology. 2010;51(6):1998–2007. doi:10.1002/hep.23599
- Rau M, Schilling A-K, Meertens J, et al. Progression from nonalcoholic fatty liver to nonalcoholic steatohepatitis is marked by a higher frequency of Th17 Cells in the liver and an increased Th17/resting regulatory T cell ratio in peripheral blood and in the liver. J Immunol. 2016;196(1):97–105. doi:10.4049/jimmunol.1501175
- du Plessis J, van Pelt J, Korf H, et al. Association of adipose tissue inflammation with histologic severity of nonalcoholic fatty liver disease. Gastroenterology. 2015;149(3):635–648.e14. doi:10.1053/j.gastro.2015.05.044
- Wieser V, Adolph TE, Grander C, et al. Adipose type I interferon signalling protects against metabolic dysfunction. Gut. 2018;67(1):157–165. doi:10.1136/gutjnl-2016-313155
- Rojek AM, Skowronski MT, Füchtbauer E-M, et al. Defective glycerol metabolism in aquaporin 9 (AQP9) knockout mice. Proc Natl Acad Sci U S A. 2007;104(9):3609–3614. doi:10.1073/pnas.0610894104
- Gena P, Mastrodonato M, Portincasa P, et al. Liver glycerol permeability and aquaporin-9 are dysregulated in a murine model of non-alcoholic fatty liver disease. PLoS One. 2013;8(10):e78139. doi:10.1371/journal.pone.0078139
- Rodríguez A, Gena P, Méndez-Giménez L, et al. Reduced hepatic aquaporin-9 and glycerol permeability are related to insulin resistance in non-alcoholic fatty liver disease. Int J Obes. 2014;38(9):1213–1220. doi:10.1038/ijo.2013.234
- Wang C, Lv Z-L, Kang Y-J, et al. Aquaporin-9 downregulation prevents steatosis in oleic acid-induced non-alcoholic fatty liver disease cell models. Int J Mol Med. 2013;32(5):1159–1165. doi:10.3892/ijmm.2013.1502
- Quoc QL, Choi Y, Thi Bich TC, et al. S100A9 in adult asthmatic patients: a biomarker for neutrophilic asthma. Exp Mol Med. 2021;53(7):1170–1179. doi:10.1038/s12276-021-00652-5
- Ding Z, Du F, Averitt V RG, et al. Targeting S100A9 reduces neutrophil recruitment, inflammation and lung damage in abdominal sepsis. Int J Mol Sci. 2021;22(23):12923. doi:10.3390/ijms222312923
- Marinković G, Koenis DS, de Camp L, et al. S100A9 links inflammation and repair in myocardial infarction. Circ Res. 2020;127(5):664–676. doi:10.1161/CIRCRESAHA.120.315865
- Agra RM, Fernández-Trasancos Á, Sierra J, et al. Differential association of S100A9, an inflammatory marker, and p53, a cell cycle marker, expression with epicardial adipocyte size in patients with cardiovascular disease. Inflammation. 2014;37(5):1504–1512. doi:10.1007/s10753-014-9876-3
- Bouma G, Lam-Tse WK, Wierenga-Wolf AF, et al. Increased serum levels of MRP-8/14 in type 1 diabetes induce an increased expression of CD11b and an enhanced adhesion of circulating monocytes to fibronectin. Diabetes. 2004;53(8):1979–1986. doi:10.2337/diabetes.53.8.1979
- Liu X, Wang Y, Ming Y, et al. S100A9: a potential biomarker for the progression of non-alcoholic fatty liver disease and the diagnosis of non-alcoholic steatohepatitis. PLoS One. 2015;10(5):e0127352. doi:10.1371/journal.pone.0127352
- Nies JF, Panzer U. IL-17C/IL-17RE: emergence of a unique axis in T17 biology. Front Immunol. 2020;11:341. doi:10.3389/fimmu.2020.00341
- Chang SH, Reynolds J, Pappu B, et al. Interleukin-17C promotes Th17 cell responses and autoimmune disease via interleukin-17 receptor E. Immunity. 2011;35(4):611–621. doi:10.1016/j.immuni.2011.09.010
- Krohn S, Nies JF, Kapffer S, et al. IL-17C/IL-17 receptor E signaling in CD4 T cells promotes T17 cell-driven glomerular inflammation. JASN. 2018;29(4):1210–1222. doi:10.1681/ASN.2017090949
- Huang J, Yuan Q, Zhu H, et al. IL-17C/IL-17RE augments T cell function in autoimmune hepatitis. J Immunol. 2017;198(2):669–680. doi:10.4049/jimmunol.1600977
- Liao R, Sun J, Wu H, et al. High expression of IL-17 and IL-17RE associate with poor prognosis of hepatocellular carcinoma. J Exp Clin Cancer Res. 2013;32:3. doi:10.1186/1756-9966-32-3
- Tsukumo S-I, Unno M, Muto A, et al. Bach2 maintains T cells in a naive state by suppressing effector memory-related genes. Proc Natl Acad Sci U S A. 2013;110(26):10735–10740. doi:10.1073/pnas.1306691110
- Wang H, Zhang H, Wang Y, et al. Regulatory T-cell and neutrophil extracellular trap interaction contributes to carcinogenesis in non-alcoholic steatohepatitis. J Hepatol. 2021;75(6):1271–1283. doi:10.1016/j.jhep.2021.07.032