
Abstract
Background
Insulin resistance (IR) and hyperhomocysteinemia (HHcy) are significant risk factors for cardiovascular disease (CVD). As an important marker for IR, Triglyceride-Glucose (TyG) index maybe a significant predictor for HHcy progression, reflecting cardiovascular risk. However, the relationship between TyG index and HHcy has been unknown, especially for the high-risk occupation group of male bus drivers. This longitudinal study was initially conducted to explore the outcome of TyG index in predicting HHcy among male bus drivers.
Methods
In total, 1018 Chinese male bus drivers with Hcy data and regular follow-up from 2017 to 2021 were screened, and 523 non-HHcy subjects at baseline were included in the longitudinal cohort. A restricted cubic spline (RCS) was performed to investigate the possible non-linear relationship between TyG index and the progression of HHcy. A multivariate logistic regression model was used to explore the association between TyG index and developing HHcy via assessing the value of odds ratio (OR) and 95% confidence interval (CI).
Results
After the median follow up time of 2.12 years, approximately 27.7% of male bus drivers (mean age: 48.1 years) was identified as new incidents HHcy. Multivariate logistic regression found that the higher level of TyG was associated with an increased risk of new onset HHcy (OR = 1.47; 95% CI: 1.11–1.94); and the association seemed to be strong among male bus drivers with elevated low-density lipoprotein cholesterol (LDL-C) (P for interaction < 0.05).
Conclusion
As a higher risk occupation group for HHcy, male bus drivers should cause much more attentions from policy makers, employers, and health professionals in China. Identifying male bus drivers with HHcy is of significance at an earlier stage in the primary care setting. Being a significant predictive factor for HHcy, TyG index could be used to monitor and prevent Chinese male bus drivers from HHcy, especially for individuals with elevated LDL-C.
Introduction
Cardiovascular disease (CVD) has been identified as one of the most significant leading causes of mortality and morbidity globally,Citation1 as well the top cause of death in China.Citation2 Owing to the sensitive and stressful occupation characteristics, bus drivers were reported to have a higher risk of CVD.Citation3 Homocysteine (Hcy) is a sulfhydryl-containing amino acid presenting in plasma and an important in-process product in the metabolism of cysteine and methionine.Citation1,Citation4,Citation5 Recent research has proved that hyperhomocysteinemia (HHcy) was an independent predictor for CVD,Citation4–6 defined as the level of serum Hcy greater than 15.0µmol/L.Citation7 In addition, HHcy was verified to be associated with carcinoma, Alzheimer’s disease, vascular dementia, Parkinson’s disease, and diabetic kidney disease.Citation8–11 It is worth noting that the prevalence of HHcy in China is significantly higher than in other countries;Citation12–16 and its incidence is much higher in men than in women.Citation1,Citation16–18
Numerous studies had conducted to explore HHcy being a CVD risk factor, whereas relatively few studies had focused on factors related with HHcy in healthy population,Citation1 especially for the special occupation group of bus drivers. Moreover, there is an undisputed obvious sex ratio gap in this occupation, and the majority of bus drivers were male.Citation19 Therefore, as a possible high risk of occupational group, it is warranted to explore the prevalence of HHcy and its predictors for male bus drivers.
In addition to HHcy, insulin resistance (IR) was likewise found as one of the main contributors to CVD,Citation20 which is regarded as an insulin-regulated defect in tissue glucose metabolism control.Citation21,Citation22 The “gold standard method” for IR assessing is hyperinsulinemic-euglycemic clamp,Citation23–25 and its alternative method was Homeostatic Model Assessment (HOMA-IR) by calculating insulin and glucose levels to determine IR.Citation26 However, these tests are so expensive and complex to detrimentally restrict their wide use.Citation23,Citation24,Citation27 As a low cost, easily accessible biochemistry test,Citation28 Triglyceride-glucose (TyG) index calculated via fasting serum glucose (GLU) and triglyceride values, has been reported as an appropriate surrogate indicator of IR.Citation29,Citation30 Previous research found that TyG Index was positively related with IR that was measured via the glucose clampCitation23 and HOMA-IR.Citation31 Furthermore, recent research reported that TyG index was a reliable diagnostic tool for IR; and in some cases, it may even better than HOMA-IR,Citation32–34 being suitable for large population research and clinical settings.Citation23 Therefore, TyG index was chosen as an IR biomarker in the present study.
As discussed above, HHcy and IR are significant risk factors for CVD.Citation5,Citation6,Citation20 As an important marker for IR, TyG index maybe a predictor for HHcy progression, reflecting cardiovascular risk. However, the relationship of TyG index and HHcy has been not explored in the existing literature, especially for the possible high-risk occupation group of male bus drivers for HHcy. Thus, this longitudinal study firstly investigate the association between TyG level and the development of HHcy for Chinese male bus drivers as well as to provide the effective evidence for protecting these bus drivers from HHcy.
Methods
Research Design
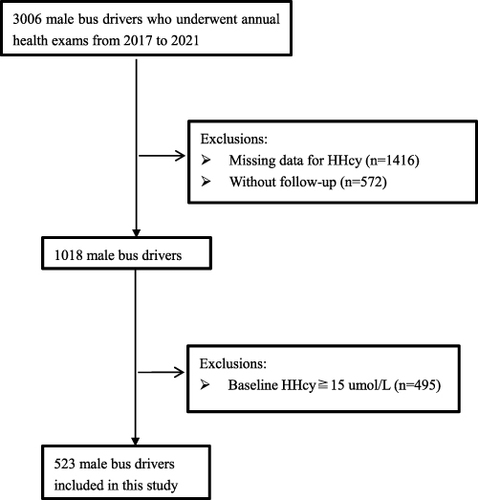
In the current longitudinal research, study subjects included 523 male bus drivers, as one part of an annual health examination program at Shenzhen People’s Hospital in Shenzhen City, China, from 2017 to 2021. Initially, 3006 male bus drivers who had worked for more than two years and underwent the annual physical examinations at this period were recruited. After screening, individual with missing data on Hcy (n = 1416), without follow-up (n = 572) were excluded; and 1018 male bus drivers were enrolled in the longitudinal cohort. Excluded ones with HHcy (Hcy⩾15.0µmol/L) at baseline checkup (n = 495), at final 523 subjects were included in data analysis and their median follow up period was 2.12 years. The study flow chart was illustrated in . The current research was undertaken in accordance with the Declaration of Helsinki, and was approved by the institutional ethics committee of Shenzhen People’s Hospital. Prior to participation, all subjects offered their signed consent form.
Figure 1 Flow chart of our study population selection.
Anthropometric Measurement and Laboratory Assessment
During the process of annual health examination, study subjects’ age and sex were recorded, and their weight, height, systolic blood pressure (SBP), and diastolic blood pressure (DBP) were obtained by experienced professional health workers. The data of comorbidities comprised whether these bus drivers were diagnosed as dyslipidemia, hypertension, diabetes, or hyperuricemia. Fasting blood samples were collected by venipuncture in the morning and analyzed in a core laboratory. Serum Hcy level was measured by enzyme cycling method. The information about laboratory assessment included total cholesterol (TC), triglyceride (TG), low-density lipoprotein cholesterol (LDL-C), high-density lipoprotein cholesterol (HDL-C), aspartate aminotransferase (AST), alanine aminotransferase (ALT), gamma glutamyl transpeptidase γ (GGTP), serum uric acid (SUA), creatinine (Cr), blood urea nitrogen (BUN), GLU, hemoglobin (HGB), homocysteine (Hcy), urine pondus hydrogenii (UPH), urine proteinuria (PRO), and estimated glomerular filtration rate (eGFR).
Study Definitions
In our study, the calculation formula of TyG was: Ln[fasting triglycerides (mg/dl) × fasting glucose (mg/dl)/2].Citation35,Citation36 HHcy was regarded as the serum Hcy⩾15.0µmol/L.Citation7 Body mass index (BMI) calculation divided an individual’s weight in kilograms by the height in meters squared.Citation37 In regarding to the new guideline for hyperuricemia diagnosis and management in China,Citation38 SUA ≥420μmol/L (7mg/dl) was defined as hyperuricemia for male bus drivers. According to the guideline of dyslipidaemia management for Chinese adults, TC≥6.2mmol/L, LDL-C≥4.1mmol/L, HDL-C<1.0mmol/L, TG≥2.3mmol/L were defined as elevated TC, elevated LDL-C, lower HDL-C, and elevated TG, respectively;Citation39 and TC≥6.2 mmol/L, TG≥2.3 mmol/L, HDL-C <1.0 mmol/L and/or LDL-C≥4.1 mmol/L, or currently conducting pharmacological treatment, were regarded as dyslipidaemia.Citation40 PRO was recorded as negative (−) and positive (+).
Data Analysis
The descriptive statistics of categorical variables and continuous variables were presented by numbers, percentages (%), and mean, standard deviation (SD), respectively. The comparison of socio-demographic and clinical characteristics among two groups according to the diagnosis of HHcy was conducted via Student’s t-test and one-way ANOVA (analysis of variance) in terms of continuous data, and X2 (chi-square) tests in terms of categorical data. A restricted cubic spline (RCS) was used with knots placed at the 5th, 35th, 50th, 65th, and 95th percentiles to explore the possible non-linear relationship between TyG index and the risk of HHcy after adjusting for confounders of age, Cr, SBP, and DBP. The univariate and multivariate logistic regression models were undertaken to investigate the relationship between the TyG index and the progression of HHcy via assessing the value of odds ratio (OR) and 95% confidence interval (CI). Three multivariate logistic regression models were constructed in our study and these models comprised known potential confounders between TyG index and HHcy, as well as significant covariates in univariate analysis (P < 0.05). Model 1 was not adjusted; model 2 was adjusted for age, Cr and SUA; and model 3 was adjusted for age, Cr, SUA, SBP, and DBP. Moreover, subgroup analysis was performed to explore the potential factors to modify the relationship. R 4.1.3 software (R Foundation, Vienna, Austria) performed all statistical analysis and the P-value <0.05 (two-tailed) was regarded as statistically significant.
Results
Baseline Characteristics of Male Bus Drivers
To assess the outcome of TyG Index in predicting incident HHcy, 523 male bus drivers without HHcy at baseline were included in our longitudinal cohort, and the mean age of these participants was 48.1 (2.88) years. After a median follow up period of 2.12 years, approximately 27.7% (145/523) of male bus drivers suffered from HHcy. described the comparisons of baseline characteristics between subjects classified with and without HHcy in the longitudinal cohort. Individuals with developing HHcy were more likely to have higher values of SBP, DBP, BMI, TG, Cr, GLU, HGB, TyG index; to have higher incidences of hypertension, obesity, elevated TC, and positive PRO; and have a lower level of eGFR compared with ones without developing HHcy.
Table 1 Baseline Characteristics Among Male Bus Drivers Classified by with and without HHcy
Dose-Response Relationship Between TyG Index and HHcy
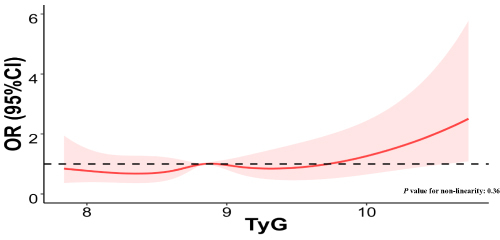
illustrated a RCS model with five knots (the 5th, 35th, 50th, 65th, and 95th percentiles) to investigate the possible non-linear relationship between TyG index and the progression of HHcy after adjusting for confounders. The findings indicated that no significant non-linear relationship was observed between TyG index and HHcy (P value for non-linearity: 0.36).
Figure 2 The RCSfor the possible non-linear relationship between TyG index and HHcy in male bus drivers.
The Relationship of TyG Index with Developing HHcy
The multivariate-adjusted logistic regression results were shown in to explore the association between TyG index and developing HHcy. It indicated that TyG index was positively related with HHcy. To be more specific, with 1 unit increment in TyG index, all male bus drivers’ risk of developing HHcy was 1.47 times higher (OR = 1.47; 95% CI: 1.11–1.94). This relationship remained statistically significant after adjustment for other confounding factors, such as age, Cr, SUA, SBP, and DBP (OR = 1.47; 95% CI: 1.11–1.94).
Table 2 Relationship of TyG Index with Developing HHCY Among Male Bus Drivers
Subgroup Analysis on Relationship of TyG Index with Developing HHcy by Different Groups
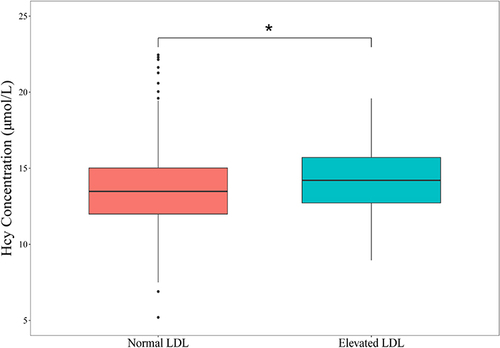
Stratification analysis likewise was conducted to reveal the association between TyG index and developing HHcy by different groups. shown that there were no significant interactions in these subgroups, including BMI group (<24 vs. 24–28 vs. ≥28 kg/m2), diabetes (no vs. yes), hypertension (no vs. yes), hyperuricemia (no vs. yes), age group (40–49 years vs. 50–59 years), elevated TC group (no vs. yes), lower HDL-C group (no vs. yes), and elevated TG group (no vs. yes) (P value for interaction > 0.05); while the significant interaction was found in the elevated LDL-C group (no vs. yes) (P value for interaction < 0.05). It indicated that the association between TyG index and HHcy seemed to be strong among these male bus drivers with elevated LDL-C. likewise illustrated that a significant difference existed in the mean serum Hcy level between normal LDL-C group (13.7µmol/L) and elevated LDL-C group (14.2µmol/L) (P < 0.05).
Table 3 Subgroup Analysis for the Association Between TyG Index and Developing HHcy
Figure 3 The comparison of Hcy concentration between normal LDL-C group and elevated LDL-C group.
Discussion
Sound evidence have proved that both HHcy and IR were the significantly independent risk factors for CVD,Citation4–6,Citation20 which was regarded as one of the most common leading causes of mortality and morbidity globally.Citation1 As an important marker of IR, TyG index could be monitored to predict HHcy progression. However, the relationship between TyG index and HHcy has been unknown in the existing literature, especially for the possible high-risk occupation group of male bus drivers. Thereby, the longitudinal study was initially conducted to demonstrate the outcome of TyG index in predicting incident HHcy among male bus drivers to fill the research gap.
First of all, we observed that these male bus drivers had a higher prevalence of the development of HHcy. For instance, approximately 27.7% of male bus drivers (mean age: 48.1 years) was identified as new incidents HHcy after a median follow up time of 2.12 years in the current research, which was higher than the corresponding incidents among other working population reported in the previous studies. For example, the other longitudinal study found that followed by the median years of 2.98, about 23.5% of community residents (mean age: 57.5) from Shanghai, China, developed to encounter new HHcy.Citation2 Another retrospective cross-sectional study found that only 8.2% of relatively healthy Taiwanese working population had HHcy, and their mean age of was 57.4 years.Citation1 The recent systematic review summarized the incidence of HHcy in China, and reported that the pooled prevalence of HHcy was 22.7% and 17.9% among Chinese population aged from 45–65 years and <45 years, respectively.Citation16
A meta-analysis reviewing 92 studies estimated that decreasing Hcy by only 3μmol/L could diminish the risk of stroke by 24% and ischaemic heart disease by 16%.Citation15 HHcy has been proved to pose a heavy metabolic burden,Citation41 and higher level of Hcy could negatively influence multiple organs via forming species of active oxygen and promoting dysfunction of endothelial smooth muscle cell, which resulted in varied diseases.Citation42 Thereby, as a higher risk occupation group for HHcy, male bus drivers should cause much more attentions from policy makers, employers, and health professionals. Our research findings indicate that it is urgent to develop effective prevention and intervention to reduce this preventable disorder for male bus drivers. Moreover, identifying male bus drivers with HHcy is of significance at an earlier stage in the primary care setting, so that timely treatment might be conducted for the control and prevention of HHcy progression and its consequences.
The other significant finding in the current research was that TyG index could independently predict the progression of HHcy for male bus drivers. To be more specific, our multivariate analysis found that the higher level of plasma TyG was related with an increased risk of new HHcy (OR = 1.46; 95% CI: 1.09–1.97) among male bus drivers, independently of other known risk factors for HHcy; and the relationship of TyG index with HHcy seemed to be strong among these subjects with elevated LDL-C (P value for interaction < 0.05). Even though the mechanism behind the correlation is not well understood, some factors maybe contribute to it. First of all, IR has been shown to cause substrate metabolism change and inefficient energy metabolism,Citation43 thus might detrimentally affecting the renal excretory function for Hcy. Moreover, IR has been proved to induce inappropriate activation of the renin–angiotensin–aldosterone system and the sympathetic nervous system,Citation44 which could negatively influence kidney function. Furthermore, relating with hyperglycemia and free fatty acid elevation, IR could cause the various local and systematic inflammation.Citation45
To our knowledge, this is the first study investigating the association between TyG index and HHcy for Chinese male bus drivers in the literature. Our findings indicated that measurement of TyG Index could be beneficial in the early screening of HHcy for male bus drivers. It needs to be noted that TyG index has the advantage for clinical applications as TG and glucose concentrations are tested routinely. For instance, all of 3006 Chinese male bus drivers recruited in the study measured the level of TG and glucose; while only 1560 of them measured the serum Hcy. Therefore, being a significant predictive factor for HHcy, TyG index can be used to monitor and prevent male bus drivers from HHcy.
The strength of the current research was that it is the first to explore the association between TyG index and HHcy for Chinese male bus drivers, so that it has significant implications for the prevention and control of HHcy for Chinese male bus drivers especially in the primary care setting. Another is the longitudinal research design that could diminish the reverse causation effect. By contrast, several limitations related to the research need to be reported. First, our research subjects of male bus drivers were from single city of Shenzhen, Southeast area of China, which would limit the generalizability of our research findings. Second, the sample size was relatively small in the present longitude study as almost half of male bus drivers did not choose to test their serum Hcy level and about one fifth of our subjects were lost during the follow up period. Thus, the basis of data could not be avoided. We recommend that the HHcy test would be a required item in the annual physical examination for male bus drivers. Third, some covariates about the lifestyle of male bus drivers that potentially influence their Hcy levels were not included in the research, such as dietary habits, smoking and alcohol habit, and supplement of B vitamins and folate, which should be considered in the further research.
Conclusion
As a higher risk occupation group for HHcy, male bus drivers should cause much more attentions from policy makers, employers, and health professionals in China. Identifying male bus drivers with HHcy is of significance at an earlier stage in the primary care setting, so that timely intervention and treatment can be conducted for the prevention of HHcy progression and its consequences. Higher TyG index was proved to be significantly associated with a higher prevalence of new HHcy for male bus drivers. Being a significant predictive factor for HHcy, TyG index can be used to monitor and prevent Chinese male bus drivers from HHcy that are much more meaningful in clinical practice, especially for subjects with elevated LDL-C.
Data Sharing Statement
The data presented in this study are available on request from the corresponding author. The data are not publicly available due to privacy restrictions.
Ethics Approval
The present study was undertaken in accordance with the Declaration of Helsinki, and was approved by the institutional ethics committee of Shenzhen People’s Hospital (Ethical approval number: LL-KY-202224).
Informed Consent Statement
Informed consent was obtained from all subjects involved in the study.
Disclosure
The authors declare no conflicts of interest.
Acknowledgments
We would like to thank all participants included in the studies.
Additional information
Funding
References
- Chen PJ, Lu YC, Wang PM, Huang CF, Loke SS. Factors associated with hyperhomocysteinemia in relatively healthy Taiwanese adults: a retrospective medical record study. Medicine. 2021;100(3):e23829. doi:10.1097/MD.0000000000023829
- Xiang Y, Zhao Q, Wang N, et al. Association of obesity with the risk of hyperhomocysteinemia among the Chinese community residents: a prospective cohort study in Shanghai, China. Nutrients. 2021;13(10):3648. doi:10.3390/nu13103648
- Golinko V, Cheberyachko S, Deryugin O, Tretyak O, Dusmatova O. Assessment of the risks of occupational diseases of the passenger bus drivers. Saf Health Work. 2020;11:543–549. doi:10.1016/j.shaw.2020.07.005
- Guieu R, Ruf J, Mottola G. Hyperhomocysteinemia and cardiovascular diseases. Ann Biol Clin. 2022;80(1):7–14. doi:10.1684/abc.2021.1694
- Faeh D, Chiolero A, Paccaud F. Homocysteine as a risk factor for cardiovascular disease: should we (still) worry about? Swiss. Med Wkly. 2006;136:745–756.
- Cacciapuoti F. Hyper-homocysteinemia: a novel risk factor or a powerful marker for cardiovascular diseases? Pathogenetic and therapeutical uncertainties. J Thromb Thrombolysis. 2011;32(1):82–88. doi:10.1007/s11239-011-0550-4
- Tu W, Yan F, Chao B, Ji X, Wang L. Status of hyperhomocysteinemia in China: results from the China stroke high-risk population screening program, 2018. Front Med. 2021;15:903–912. doi:10.1007/s11684-021-0871-4
- Kim J, Kim H, Roh H, Kwon Y. Causes of hyperhomocysteinemia and its pathological significance. Arch Pharm Res. 2018;41:372–383. doi:10.1007/s12272-018-1016-4
- Van Dam F, Van Gool WA. Hyperhomocysteinemia and Alzheimer’s disease: a systematic review. Arch Gerontol Geriatr. 2009;48:425–430. doi:10.1016/j.archger.2008.03.009
- Smith AD, Refsum H. Homocysteine, B vitamins, and cognitive impairment. Annu Rev Nutr. 2016;36:211–239. doi:10.1146/annurev-nutr-071715-050947
- Ma N, Xu N, Yin D, Liu W, Wu M, Cheng X. Relationship between plasma total homocysteine and the severity of renal function in Chinese patients with type 2 diabetes mellitus aged ≥75 years. Medicine. 2020;99(27):e20737. doi:10.1097/MD.0000000000020737
- Cohen E, Margalit I, Shochat T, Goldberg E, Krause I. Gender differences in homocysteine concentrations, a population-based cross-sectional study. Nutr Metab Cardiovasc Dis. 2019;29(1):9–14. doi:10.1016/j.numecd.2018.09.003
- Wang W, Ji P, Wang Y, et al. Prevalence of hyperhomocysteinemia and its associated factors in patients with primary hypertension in Chinese urban communities: a cross-sectional study from Nanjing. Clin Exp Hypertens. 2018;40(5):495–500. doi:10.1080/10641963.2017.1403621
- Osibogun O, Ogunmoroti O, Tibuakuu M, Benson EM, Michos ED. Sex differences in the association between ideal cardiovascular health and biomarkers of cardiovascular disease among adults in the United States: a cross-sectional analysis from the multiethnic study of atherosclerosis. BMJ Open. 2019;9(11):e031414. doi:10.1136/bmjopen-2019-031414
- Yang Y, Zeng Y, Yuan S, et al. Prevalence and risk factors for hyperhomocysteinemia: a population-based cross-sectional study from Hunan, China. BMJ Open. 2021;11(12):e048575. doi:10.1136/bmjopen-2020-048575
- Yang B, Fan S, Zhi X, et al. Prevalence of hyperhomocysteinemia in China: a systematic review and meta-analysis. Nutrients. 2015;7:74–90. doi:10.3390/nu7010074
- Tao K, Li M, Ling J, Tu Y. Prevalence and correlative factors of hyperhomocysteinemia in elderly patients with femoral neck fracture: a cross-sectional study. J Clin Lab Anal. 2022;36(7):e24563. doi:10.1002/jcla.24563
- Liu XD, Gao B, Sun D, et al. Prevalence of hyperhomocysteinaemia and some of its major determinants in Shaanxi Province, China: a cross-sectional study. Br J Nutr. 2015;113(4):691–698. doi:10.1017/S0007114514004218
- Wu Y, Wu W, Lin Y, Xiong J, Zheng X. Blood pressure states transitions among bus drivers: the application of multi-state Markov model. Int Arch Occup Environ Health. 2022;95:1995–2003. doi:10.1007/s00420-022-01903-2
- Park K, Ahn CW, Lee SB, et al. Elevated TyG Index Predicts Progression of Coronary Artery Calcification. Diabetes Care. 2019;42(8):1569–1573. doi:10.2337/dc18-1920
- Ormazabal V, Nair S, Elfeky O, Aguayo C, Salomon C, Zuñiga FA. Association between insulin resistance and the development of cardiovascular disease. Cardiovasc Diabetol. 2018;17(1):122. doi:10.1186/s12933-018-0762-4
- James DE, Stöckli J, Birnbaum MJ. The aetiology and molecular landscape of insulin resistance. Nat Rev Mol Cell Biol. 2021;22(11):751–771. doi:10.1038/s41580-021-00390-6
- Guerrero-Romero F, Simental-Mendía LE, González-Ortiz M, et al. The product of triglycerides and glucose, a simple measure of insulin sensitivity. Comparison with the euglycemic-hyperinsulinemic clamp. J Clin Endocrinol Metab. 2010;95(7):3347–3351. doi:10.1210/jc.2010-0288
- Lv L, Zhou Y, Chen X, et al.; Chongqing Diabetes Registry Group. Relationship Between the TyG index and diabetic kidney disease in patients with type-2 diabetes mellitus. Diabetes Metab Syndr Obes. 2021;14:3299–3306. doi:10.2147/DMSO.S318255
- Zhang R, Xu J, Li R, et al. Association between serum spermidine and TyG index: results from a cross-sectional study. Nutrients. 2022;14(18):3847. doi:10.3390/nu14183847
- Bonora E, Targher G, Alberiche M, et al. Homeostasis model assessment closely mirrors the glucose clamp technique in the assessment of insulin sensitivity: studies in subjects with various degrees of glucose tolerance and insulin sensitivity. Diabetes Care. 2000;23(1):57–63. doi:10.2337/diacare.23.1.57
- Yilmaz M, Karaaslan M, Tonyali S, Celik M, Toprak T, Odabas O. Triglyceride-Glucose Index (TyG) is associated with erectile dysfunction: a cross-sectional study. Andrology. 2021;9(1):238–244. doi:10.1111/andr.12904
- Unger G, Benozzi SF, Perruzza F, Pennacchiotti GL. Triglycerides and glucose index: a useful indicator of insulin resistance. Endocrinol Nutr. 2014;61(10):533–540. doi:10.1016/j.endonu.2014.06.009
- Huang R, Wang Z, Chen J, et al. Prognostic value of triglyceride glucose (TyG) index in patients with acute decompensated heart failure. Cardiovasc Diabetol. 2022;21(1):88. doi:10.1186/s12933-022-01507-7
- Guerrero-Romero F, Villalobos-Molina R, Jiménez-Flores JR, et al. Fasting triglycerides and glucose index as a diagnostic test for insulin resistance in young adults. Arch Med Res. 2016;47(5):382–387. doi:10.1016/j.arcmed.2016.08.012
- Kang B, Yang Y, Lee EY, et al. Triglycerides/glucose index is a useful surrogate marker of insulin resistance among adolescents. Int J Obes. 2017;41(5):789–792. doi:10.1038/ijo.2017.14
- Toro-Huamanchumo CJ, Urrunaga-Pastor D, Guarnizo-Poma M, et al.; Insulin Resistance and Metabolic Syndrome Research Group. Triglycerides and glucose index as an insulin resistance marker in a sample of healthy adults. Diabetes Metab Syndr. 2019;13(1):272–277. doi:10.1016/j.dsx.2018.09.010
- Lee SB, Kim MK, Kang S, et al. Triglyceride glucose index is superior to the homeostasis model assessment of insulin resistance for predicting nonalcoholic fatty liver disease in Korean adults. Endocrinol Metab. 2019;34(2):179–186. doi:10.3803/EnM.2019.34.2
- Vasques AC, Novaes FS, de Oliveira Mda S, et al. TyG index performs better than HOMA in a Brazilian population: a hyperglycemic clamp validated study. Diabetes Res Clin Pract. 2011;93(3):e98–e100. doi:10.1016/j.diabres.2011.05.030
- Simental-Mendía LE, Rodríguez-Morán M, Guerrero-Romero F. The product of fasting glucose and triglycerides as surrogate for identifying insulin resistance in apparently healthy subjects. Metab Syndr Relat Disord. 2008;6(4):299–304. doi:10.1089/met.2008.0034
- Simões CF, Locatelli JC, de Oliveira GH, Lopes WA. It is time to standardize the TyG index. Endocrine. 2021;71(2):522–523. doi:10.1007/s12020-020-02448-5
- World Health Organization. The WHO STEPwise approach to noncommunicable disease risk factor surveillance. World Heal Organ. 2017;36:1–474.
- Huang YF, Yang KH, Chen SH, et al. 高尿酸血症/痛风患者实践指南[Practice guideline for patients with hyperuricemia/gout]. Zhonghua Nei Ke Za Zhi. 2020;59(7):519–527. Chinese. doi:10.3760/cma.j.cn112138-20200505-00449
- Joint committee issued Chinese guideline for the management of dyslipidemia in adults. 中国成人血脂异常防治指南(2016年修订版)[2016 Chinese guideline for the management of dyslipidemia in adults]. Zhonghua Xin Xue Guan Bing Za Zhi. 2016;44(10):833–853. Chinese. doi:10.3760/cma.j.issn.0253-3758.2016.10.005
- Tao M, Pi X, Ma X, et al. Relationship between serum uric acid and clustering of cardiovascular disease risk factors and renal disorders among Shanghai population: a multicentre and cross-sectional study. BMJ Open. 2019;9:e025453. doi:10.1136/bmjopen-2018-025453
- Yoo TK, Rhim HC, Lee YT, Yoon KJ, Park CH. Relationship between hyperhomocysteinemia and coexisting obesity with low skeletal muscle mass in asymptomatic adult population. Sci Rep. 2022;12(1):12439. doi:10.1038/s41598-022-16401-1
- Choi JH, Seo JW, Lee MY, Lee YT, Yoon KJ, Park CH. Association between elevated plasma homocysteine and low skeletal muscle mass in asymptomatic adults. Endocrinol Metab. 2022;37(2):333–343. doi:10.3803/EnM.2021.1202
- Zheng L, Li B, Lin S, Chen L, Li H. Role and mechanism of cardiac insulin resistance in occurrence of heart failure caused by myocardial hypertrophy. Aging. 2019;11(16):6584–6590. doi:10.18632/aging.102212
- Zhou MS, Schulman IH, Zeng Q. Link between the renin-angiotensin system and insulin resistance: implications for cardiovascular disease. Vasc Med. 2012;17(5):330–341. doi:10.1177/1358863X12450094
- Bloomgarden ZT. Inflammation and insulin resistance. Diabetes Care. 2003;26(6):1922–1926. doi:10.2337/diacare.26.6.1922