
Abstract
Background
Owing to the stressful occupational characteristics, bus drivers have been reported to have a higher risk of renal dysfunction. However, the related factors associated with rapid kidney function decline among bus drivers have not been explored in the existing literature. Therefore, our research aimed to investigate factors related with rapid kidney function decline, and to explore the correlation of baseline SUA (serum uric acid), longitudinal changes in SUA, and rapid eGFR (estimated glomerular filtration rate) decline for bus drivers.
Methods
This was a five-year cohort study in Shenzhen, China, between 2017 and 2021. We included 832 bus drivers with normal kidney function at baseline. Study subjects were stratified into four quartiles of change in eGFR, and rapid eGFR decline was regarded as the highest (4th) quartile of ΔeGFR (eGFR in 2017-eGFR in 2021). Univariable and multivariable logistic regressions were conducted to explore factors affecting rapid eGFR decline.
Results
The incidence of hyperuricemia among bus drivers was 37.7% in 2017 and 40.5% in 2021. The overall subjects had a median 5-year decrease in eGFR of 6.72 mL/min/1.73 m2, and individuals with increased SUA from normal to hyperuricemia group had the greatest decline of eGFR. Multivariate analysis showed bus drivers’ age (Odds radio: OR, 1.04), elevated baseline eGFR (OR, 1.08), and SUA increase (OR, 1.38) were significantly associated with rapid eGFR changes.
Conclusion
The high prevalence of hyperuricemia among bus drivers should warrant more attention from health professionals. Subjects’ age, elevated baseline eGFR, and SUA increase were risk factors for rapid eGFR decline over 5-year. The findings can provide significant evidence for timely prevention and intervention to decrease the incidence of rapid renal function decline among bus drivers.
Introduction
Public transportation makes a great contribution to meeting the travel needs of people worldwide.Citation1 Nowadays, China has about total one million bus drivers.Citation2 It is worth noting that bus driver is a rather stressful and susceptible occupation in comparison with other jobs.Citation3,Citation4 Bus drivers typically suffer from considerable occupational pressures, ie, daily tight schedules, frequent traffic congestion, changeable weather conditions, possible conflicts with passengers, and poor cabin ergonomics.Citation3 These occupational characteristics can predispose them to encounter certain occupational diseases.Citation1,Citation5–7 For instance, previous research found that bus drivers had a higher risk of renal dysfunction.Citation8
Chronic Kidney Disease (CKD) has been regarded as a growing worldwide public issue,Citation9,Citation10 influencing an approximate 850 million population.Citation11 Other than the increasing global prevalence, CKD was related to high mortality and morbidity, even in its earlier stages.Citation10 On the basis of Global Burden of Disease Report, CKD caused 1.2 million deaths worldwide in 2017.Citation12 As a significant indicator of renal function,Citation13,Citation14 the glomerular filtration rate (GFR) is usually estimated from serum creatinine levels. Under normal physiological conditions, the estimated glomerular filtration rate (eGFR) may generally decline with aging via 0.5 to 1.0 mL/min/1.73 m2 annually.Citation15,Citation16 However, the rapid eGFR decline is verified as one significant marker for the progression of kidney disease and a risk factor for CVD (cardiovascular disease) and all-cause mortality.Citation16
Serum uric acid (SUA), as the end product of purine metabolism, is mainly excreted via the kidneys.Citation17 Even though many epidemiologic studies have been undertaken to examine the relationship between elevated SUA and renal dysfunction, several limitations need to be considered.Citation10 Firstly, the factors influencing rapid renal function decline remain controversial in the current document.Citation18 For example, some studies found that elevated SUA was related with a raising risk of renal disease onset and progression,Citation10,Citation19 and with an increased rate of eGFR rapid decline.Citation20,Citation21 By contrast, an association of SUA with CKD and with eGFR rapid decline was not demonstrated in other studies.Citation22,Citation23 Secondly, most research used cross-sectional design,Citation17,Citation21,Citation22,Citation24,Citation25 and only a few studies explored whether longitudinal changes in SUA affect the risk of kidney dysfunction among the general population.Citation20,Citation26,Citation27 Thirdly, the existing literature did not focus on the higher-risk subgroup of bus drivers. Therefore, our study was firstly conducted to explore potential factors predicting rapid kidney function decline among bus drivers, and to investigate the correlation of baseline SUA, longitudinal changes in SUA, and rapid eGFR decline over five years for bus drivers with normal kidney function at baseline. These findings can supply significant evidence to better understand the progress of rapid renal function decline for bus drivers; and offer a basis for timely prevention and targeted intervention to decrease the incidence of rapid renal function decline for bus drivers.
Materials and Methods
Study Design and Subjects
A 5-year follow-up study was conducted in the current research. Complied with the Declaration of Helsinki, the present study was approved by the ethics committee of Shenzhen People’s Hospital (Ethical approval number: LL-KY-202224) with the written informed consent of each subject.
Our subjects were bus drivers who had been working in a single bus driver company for at least five years in Shenzhen City, Guangdong Province, China. We used the medical records of these bus drivers who had an annual health checkup in the same hospital both in 2017 and 2021. Bus drivers were eligible for the study if they were 18 years or older; had the baseline medical record in 2017 and the follow-up medical record in 2021. Bus drivers were excluded from this research if they were with CKD (an eGFR <60mL/min/1.73m2 or a urinary albumin-to-creatinine ratio >30 mg/g), or with other severe diseases at the baseline record of 2017.
Study subjects’ weight, height, and blood pressure were measured by professional health workers, and their age, gender, smoking history, and medical history were likewise recorded in the annual checkup. Venous blood samples from all subjects were taken in fasting state to monitor their fasting plasma glucose (FPG), triglyceride (TG), cholesterin (CHOL), blood urea nitrogen (BUN), serum creatinine (SCr), and SUA.
Study Definition and Measurement
In the research, creatinine-based eGFR was used to assess renal function, which was calculated via the MDRD (Modification of Diet in Renal Disease) formula: 186×Scr−1.154×age−0.203×0.742 [if female].Citation28 The subjects’ kidney function was tested once a year. An eGFR <60mL/min/1.73m2 or a urinary albumin-to-creatinine ratio >30 mg/g was regarded as a marker of CKD.Citation29 SUA change and eGFR change were regarded as the absolute variation between 2017 and 2021 data. To evaluate eGFR change over five years, we stratified the participants into four quartiles of ΔeGFR (eGFR in 2017-eGFR in 2021). In the study, the highest (4th) quartile of ΔeGFR was regarded as rapid eGFR decline. Hyperuricemia is defined as SUA levels >6 mg/dl (>360 umol/L) for females and >7 mg/dl (420 umol/L) for males or taking xanthine oxidase inhibitors.Citation22 We further divided the study subjects into four groups according to baseline and follow-up SUA levels: 1. normal SUA during the period of follow-up (N-N group); 2. normal SUA in baseline and hyperuricemia in follow-up (N-H group); 3. hyperuricemia in baseline and normal in follow-up (H-N group); and 4. hyperuricemia through the period of follow-up (H-H group).
The systolic blood pressure (SBP) and diastolic blood pressure (DBP) were measured using an electronic sphygmomanometer (Omro, HBP-9020).Citation30 The resting BP was measured at least two times with a 10–15 min interval in the upper right arm of participants with sitting position, and then the average was used. Hypertension was defined as SBP ≥140 mmHg or diastolic pressure ≥90 mmHg or taking any antihypertensive medicine.Citation31 Body mass index (BMI, kg/m2) was calculated by dividing weight by the square of height. We defined individuals with BMI less than 18.5 kg/m2, from 18.5 to 24.9 kg/m2, from 25.0 to 29.9 kg/m2 and more than 30 kg/m2 as the group of underweighted, normal weight, overweight and obesity, respectively.Citation32 Diabetes was considered as FPG ≥7.0mmol/ L or a current history of diabetes mellitus.Citation33
Statistical Analysis
All statistical analyses were conducted by R software. The P-value with two-side less than 0.05 was regarded as statistically significant. Percentage (frequency), mean (standard deviation, SD), and median (interquartile range, IQR) were computed for categorical variables, continuous variables with normally distributed, and continuous variables with nonnormally distributed, respectively. The normality of variables was tested by the Shapiro–Wilk test, and homogeneity of variance was assessed by the Levene test. We used Kruskal–Wallis test and Pearson’s Chi-square test to compare differences among four quartiles of ΔeGFR, and used Wilcoxon signed rank sum test to make a comparison in eGFR difference from baseline to follow-up categorized via different SUA subgroups. Univariable and multivariable logistic regressions were conducted to investigate the potential factors influencing rapid eGFR decline. Only factors with P-values less than 0.20 in univariate analysis were further considered in subsequent multivariate models. The correlation between change in SUA and eGFR over five years, between baseline SUA and baseline eGFR, and between follow-up SUA and follow-up eGFR were all performed using Spearman correlation.
Results
Participant Profile
There were 844 bus drivers who had annual checkup records at the hospital both in 2017 and in 2021. We excluded 12 individuals, 7 of whom with eGFR <60 mL/min/1.73m2, 3 of whom with carcinoma, and 2 of whom with severe cirrhosis at the baseline record of 2017. Finally, in total 832 bus drivers were included in the study. The median age of these subjects was 43.00 (38.00, 47.00) years, and the majority of them (82.9%) were male. Among these bus drivers, the incidence of hyperuricemia was 37.7% in 2017, and increased to 40.5% in 2021. The characteristics of all subjects and their differences stratified by quartiles of eGFR change are summarized in . Participants with the rapid eGFR decline (4th quartile) were more likely to be younger, with higher rate of diabetes, lower TG, lower SCr, lower baseline SUA, and higher baseline eGFR.
Table 1 Characteristics of Study Subjects Among the Quartile of eGFR Change
The Relationship Between SUA and eGFR
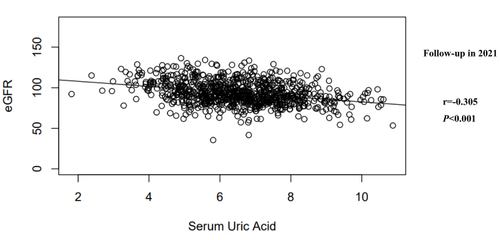
illustrates the correlation between SUA change and eGFR change over five years. As shown, change in SUA was significantly negative related with changes in eGFR over 5 years (r=−0.169, P<0.001). Likewise, there was significantly inverse correlation between baseline SUA and baseline eGFR (r=−0.357, P<0.001, see ), and between follow-up SUA and follow-up eGFR (r=−0.305, P<0.001, see ).
Figure 1 The correlation between SUA change and eGFR change over five years.
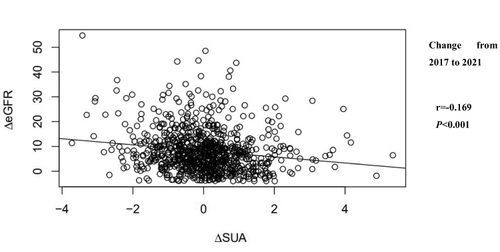
Figure 2 The correlation between baseline SUA and baseline eGFR.
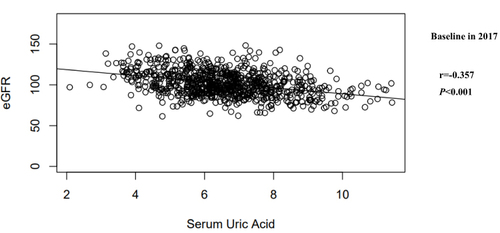
Figure 3 The correlation between follow-up SUA and follow-up eGFR.
Risk Factors Associated with Rapid eGFR Decline
In the current research, the 2017 (baseline) eGFR was 99.71 (90.98, 111.93) mL/min/1.73m2, and the 2021 (follow-up) eGFR was 91.72 (83.66, 103.14) mL/min/1.73m2. Our study subjects had a median 5-year decrease in eGFR of 6.72 mL/min/1.73 m2. The quartiles of eGFR change over 5 years comprised 208 participants in 1st quartile (eGFR change < 2.08 mL/min/1.73m2), 208 individuals in 2nd quartile (2.08 ≤ eGFR change < 6.72 mL/min/1.73m2), 208 ones in 3rd quartile (6.72 ≤ eGFR change < 11.66 mL/min/1.73m2), and 208 ones in 4th quartile (≧11.66 mL/min/1.73m2).
Our univariate analysis found that rapid eGFR change was significantly related to baseline eGFR (OR, 1.07; 95% CI, 1.05–1.09), baseline SUA (OR, 0.76; 95% CI, 0.66–0.87), and SUA change (OR, 1.50; 95% CI, 1.25–1.81). Only factors with P-values less than 0.20 in univariate analysis were entered in the multiple logistic regression models; and the variables that met the requirements were age, FPG, hypertension, BMI, baseline eGFR, baseline SUA, SUA change, TG and CHOL. As described in , our multivariate analysis showed that age, elevated baseline eGFR, and SUA increase were risk factors for rapid eGFR change (P<0.05).
Table 2 Risk Factors for Rapid eGFR Decline
Difference in eGFR from Baseline to Follow-Up by SUA Change Subgroups
In addition, our study subjects were stratified to four groups in terms of further analysis (see ). In total, 397 subjects belonging to N-N group had normal SUA during the period of follow-up (5.64 mg/dL in 2017 and 5.60 mg/dL in 2021); 121 subjects in N-H group had normal SUA in baseline (6.34 mg/dL in 2017) and had hyperuricemia in follow-up (7.55 mg/dL in 2021); 98 subjects belonging to H-N group had hyperuricemia in baseline (7.19 mg/dL in 2017) and normal SUA in follow-up (5.72 mg/dL in 2021); and 216 participants in H-H group observed hyperuricemia through the period of follow-up (7.96 mg/dL in 2017 and 7.84 mg/dL in 2021). As shown in , the significant eGFR decrease from 2017 to 2021 was witnessed among all four groups of study subjects (P<0.001); however, the individuals in the N-H group had the highest eGFR decline after the follow-up of five years compared with other groups.
Table 3 Difference in eGFR from Baseline to Follow-Up by SUA Change Subgroups
Discussion
Owing to the stressful occupational characteristics,Citation1,Citation5–7 bus drivers have been reported to have a higher risk of renal dysfunction.Citation8 However, the related factors associated with rapid kidney function decline among bus drivers have not been explored in the existing literature. Therefore, the present study aimed to initially investigate potential factors associated with rapid eGFR decline, as well as to examine the correlation between SUA and eGFR decline over five years for bus drivers with normal kidney function at baseline.
There were some significant findings in the current research. First, our study reported that the prevalence of hyperuricemia among these Chinese bus drivers was 37.7% at baseline and increased to 40.5% after 5-year follow-up, much higher than the corresponding rates in other studies. For example, a 10-year follow-up study in Thailand found that the prevalence of hyperuricemia was 17.3% in baseline and 20.2% in follow-up among the general population.Citation10 One cross-sectional study in Japan reported about 15.3% of the elderly population had hyperuricemia.Citation26 The other cross-sectional study with larger sample size in China showed that the overall prevalence of hyperuricemia was 25.8% in the general population.Citation34 A meta-analysis reviewing 38 studies from mainland China reported that the pooled prevalence of hyperuricemia among Chinese adults was 13.3% from 2000 to 2014.Citation35 These findings indicated that these bus drivers were more prone to suffer from hyperuricemia in comparison with other adults. Convincing evidence identified that hyperuricemia could increase mortality and result in various chronic diseases, ie, CVD, diabetes, dyslipidaemia, and metabolic syndrome.Citation13,Citation34,Citation36 Thus, the higher prevalence of hyperuricemia in bus drivers should be caused great concern from health professionals; and the urgent intervention could be conducted to prevent and control hyperuricemia for bus drivers.
Second, our research found that SUA levels at baseline and follow-up had a significantly inverse correlation with eGFR at baseline and follow-up, respectively; and the longitudinal elevated change in SUA was inversely associated with rapid eGFR decline over five years for bus drivers. The results were consistent with previous cross-sectional and longitudinal research.Citation10,Citation17,Citation20,Citation25–27 Clinical trials likewise reported a significant decrease of SCr levels and an increase of eGFR via the therapy of lowering SUA levels.Citation37
Furthermore, the current research witnessed that these bus drivers experienced a median 5-year decrease in eGFR of 6.72 mL/min/1.73 m2 (average age of 43 years), which was even higher than the eGFR decline of 6.40 mL/min/1.73 m2 in five years among Japanese elderly adults (mean age of 62.5) without CKD;Citation38 and almost equal to a median ten years decrease in eGFR of 6.80 mL/min/1.73 m2 among similar age of adults (mean age of 40.0 year).Citation10 The eGFR is a crucial index for evaluating renal function, which decreases at a rate of 0.75–1 mL/min/1.73 m2/year for individuals aged over 40 years.Citation39 Our findings indicated that bus drivers could experience a greater annual decrease in eGFR compared with general people. The rapid eGFR decline is regarded as an early marker of the initiation and progression of renal disease.Citation16 Thus, it is necessary to explore potential factors affecting rapid kidney function decline for bus drivers.
In the research, SUA increase (OR, 1.38; 95% CI, 1.10–1.75) was identified as a significant risk factor for rapid eGFR change. Aligned with our findings, the other three longitudinal studies reported that an increase in SUA during the period of follow-up significantly predicted the rapid eGFR decline after 5–10 years for the general population in Japan and Thailand.Citation10,Citation20,Citation26 The other study reported that lowering SUA increase significantly improved the level of eGFR.Citation40 Our study also reported that subjects with increased SUA from normal group to hyperuricemia group had a greater eGFR decline after follow-up of five years in comparison with ones in other groups. As a reliable, low-cost, and easily accessible surrogate biochemical marker for the rapid renal function decline, monitoring the SUA change could be beneficial for early prevention of rapid kidney function decline for Chinese bus drivers.
In addition to SUA increase, older age (OR, 1.04; 95% CI, 1.01–1.08) and elevated baseline eGFR (OR, 1.08; 95% CI, 1.06–1.10) were likewise risk factors for rapid eGFR decline of bus drivers. Prior research had similar results that the incidence of rapid decline in kidney function improved with increasing ageCitation10,Citation27 and the higher baseline eGFR.Citation41,Citation42 The findings indicated that health professionals and bus companies ought to give more concern to these kinds of bus drivers, who were more likely to encounter rapid kidney function decline: older age, with elevated baseline eGFR, and with SUA increase. In other words, individuals with the above risk factors should be the priority of public health interventions on the rapid kidney function decline control, which had great significance in primary and secondary prevention to decrease the tendency of rapid kidney function decline for Chinese bus drivers.
Several limitations of the research need to be mentioned. First of all, bus drivers were recruited in one workplace, which limited the external validity of the study findings. Furthermore, the formula of MDRD was conducted to calculate eGFR that may under-rate higher levels of GFR and might lead to less accuracy.Citation43 Moreover, the majority of study subjects were male bus drivers in the research, and the gender’s influence on SUA and eGFR among bus drivers should be explored in further study. In addition, previous study reported that nicotine could induce acute kidney injury.Citation44 However, smoking history was not identified as one risk factor of rapid kidney function decline among bus drivers in the present study. Thus, not only whether smoking but also the daily smoking consumption may be considered to explore the influencing of smoking on rapid kidney function decline for bus drivers in the future.
Conclusion
Our research reported that bus drivers had a higher prevalence of hyperuricemia and a greater annual decrease in eGFR in comparison with other adults, which should be causing more concern from health professionals. Bus drivers’ age, elevated baseline eGFR, and SUA increase were risk factors for rapid eGFR decline over 5 years. The derived study findings can provide significant evidence to better understand the progress of rapid renal function decline for bus drivers; and offer a basis for timely prevention and targeted intervention to decrease the incidence of rapid renal function decline for bus drivers.
Data Sharing Statement
The datasets generated during and/or analysed during the current study are available from the corresponding author on reasonable request.
Ethical Approval
The study was conducted according to the guidelines of the Declaration of Helsinki and approved by the Ethics Committee of Shenzhen People’s Hospital (Ethical approval number: LL-KY-202224).
Disclosure
The authors report no conflicts of interest in this work.
Additional information
Funding
References
- Golinko V, Cheberyachko S, Deryugin O, et al. Assessment of the risks of occupational diseases of the passenger bus drivers. Saf Health Work. 2020;11:543–549. doi:10.1016/j.shaw.2020.07.005
- Remembering responsibility to give bus drivers a sense of professional honor. Nanfan Daily; 2021. Available from: https://www.chinabuses.com/keyun/2021/0303/article_97661.html. Accessed March 13, 2022.
- Chen CF, Hsu YC. Taking a closer look at bus driver emotional exhaustion and well-being: evidence from Taiwanese urban bus drivers. Saf Health Work. 2020;11:353–360. doi:10.1016/j.shaw.2020.06.002
- Tu ZH, He JW, Zhou N, et al. Driver-passenger communicative stress and psychological distress among Chinese bus drivers: the mediating effect of job burnout. BMC Public Health. 2021;21:547. doi:10.1186/s12889-021-10618-x
- Wu WT, Tsai SS, Wang CC, et al. Professional driver’s job stress and 8-year risk of cardiovascular disease: the Taiwan bus driver cohort study. Epidemiology. 2019;30:S39–S47. doi:10.1097/EDE.0000000000001003
- Mohsen A, Hakim S. Workplace stress and its relation to cardiovascular disease risk factors among bus drivers in Egypt. East Mediterr Health J. 2019;25(12):878–886. doi:10.26719/emhj.19.056
- Kasemsan A, Joseph L, Paungmali A, et al. Prevalence of musculoskeletal pain and associated disability among professional bus drivers: a cross‑sectional study. Int Arch Occ Env Hea. 2021;4:1263–1270. doi:10.1007/s00420-021-01683-1
- Meng CQ, Nie Q, Zhang XL, et al. 石家庄市职业性公交车司机健康状况调查及性别、年龄差异分析 [Survey on health status of professional bus drivers and variation analysis of gender and age in Shijiazhuang City] . Hebei Med J. 2022;3:456–459. Chinese.
- Hill NR, Fatoba ST, Oke JL, et al. Global prevalence of chronic kidney disease: a systematic review and meta-analysis. PLoS One. 2016;11(7):e0158765. doi:10.1371/journal.pone.0158765
- Kritmetapak K, Charoensri S, Thaopanya R, et al. Elevated serum uric acid is associated with rapid decline in kidney function: a 10-year follow-up study. Int J Gen Med. 2020;13:945–953. doi:10.2147/IJGM.S277957
- Jager KJ, Kovesdy C, Langham R, et al. A single number for advocacy and communication-worldwide more than 850 million individuals have kidney diseases. Nephrol Dial Transplant. 2019;34:1803–1805. doi:10.1093/ndt/gfz174
- Bikbov B, Purcell CA, Levey AS, et al. Global, regional, and national burden of chronic kidney disease, 1990–2017: a systematic analysis for the global burden of disease study 2017. Lancet. 2020;395:709–733. doi:10.1016/S0140-6736(20)30045-3
- Guan H, Zheng Y, Zhou X, et al. Efficacy of different urinary uric acid indicators in patients with chronic kidney disease. BMC Nephrol. 2020;21(1):290. doi:10.1186/s12882-020-01953-z
- Hirst JA, Montes MDV, Taylor CJ, et al. Impact of a single eGFR and eGFR-estimating equation on chronic kidney disease reclassification: a cohort study in primary care. Br J Gen Pract. 2018;68(673):e524–e530. doi:10.3399/bjgp18X697937
- Lindeman RD, Tobin J, Shock NW. Longitudinal studies on the rate of decline in renal function with age. J Am Geriatr Soc. 1985;33(4):278–285. doi:10.1111/j.1532-5415.1985.tb07117.x
- Rifkin DE, Shlipak MG, Katz R, et al. Rapid kidney function decline and mortality risk in older adults. Arch Intern Med. 2008;168(20):2212–2218. doi:10.1001/archinte.168.20.2212
- Silva NR, Gonçalves CET, Gonçalves DLN, et al. Association of uric acid and uric acid to creatinine ratio with chronic kidney disease in hypertensive patients. BMC Nephrol. 2021;22(1):311. doi:10.1186/s12882-021-02521-9
- Shibata Y, Yamazaki M, Kitahara J, et al. Changes in serum uric acid levels as a predictor of future decline in renal function in older adults with type 2 diabetes. Medicine. 2021;100(40):e27420. doi:10.1097/MD.0000000000027420
- Bonino B, Leoncini G, Russo E, et al. Uric acid in CKD: has the jury come to the verdict? J Nephrol. 2020;33:715–724. doi:10.1007/s40620-020-00702-7
- Kuwabara M, Bjornstad P, Hisatome I, et al. Elevated serum uric acid level predicts rapid decline in kidney function. Am J Nephrol. 2017;45(4):330–337. doi:10.1159/000464260
- Di Bonito P, Valerio G, Licenziati MR, et al. High uric acid, reduced glomerular filtration rate and non-alcoholic fatty liver in young people with obesity. J Endocrinol Invest. 2020;43(4):461–468. doi:10.1007/s40618-019-01130-6
- Xu Y, Liu X, Sun X, et al. The impact of serum uric acid on the natural history of glomerular filtration rate: a retrospective study in the general population. Peer J. 2016;4:e1859. doi:10.7717/peerj.1859
- Zeng C, Cheng D, Sheng X, et al. Increased serum uric acid level is a risk factor for left ventricular hypertrophy but not independent of eGFR in patients with type 2 diabetic kidney disease. J Diabetes Res. 2017;2017:5016093. doi:10.1155/2017/5016093
- Ohta Y, Tsuchihashi T, Kiyohara K, et al. Increased uric acid promotes decline of the renal function in hypertensive patients: a 10-year observational study. Intern Med. 2013;52(13):1467–1472. doi:10.2169/internalmedicine.52.0141
- Oliveira IO, Mintem GC, Oliveira PD, et al. Uric acid is independent and inversely associated to glomerular filtration rate in young adult Brazilian individuals. Nutr Metab Cardiovasc Dis. 2020;30(8):1289–1298. doi:10.1016/j.numecd.2020.04.016
- Kawamoto R, Ninomiya D, Akase T, et al. Interactive association of baseline and changes in serum uric acid on renal dysfunction among community-dwelling persons. J Clin Lab Anal. 2020;34(5):e23166. doi:10.1002/jcla.23166
- Xiong J, Zheng X, Luo J, et al. A follow-up study to explore factors associated with rapid kidney function decline and new-onset kidney disease among Chinese elderly population. Geriatr Gerontol Int. 2022:1–8. doi:10.1111/ggi.14480.
- Tao M, Pi X, Ma X, et al. Relationship between serum uric acid and clustering of cardiovascular disease risk factors and renal disorders among Shanghai population: a multicentre and cross-sectional study. BMJ Open. 2019;9(3):e025453. doi:10.1136/bmjopen-2018-025453
- Levey AS, de Jong PE, Coresh J, et al. The definition, classification, and prognosis of chronic kidney disease: a KDIGO controversies conference report. Kidney Int. 2011;80(1):17–28. doi:10.1038/ki.2010.483
- CDC. Measure your blood pressure; 2021. Available from: https://www.cdc.gov/bloodpressure/measure.htm. Accessed April 4, 2022.
- Wang YF, Ma ZM, Xu CN, et al. Prediction of transfer among multiple states of blood pressure based on Markov model: an 18-year cohort study. J Hypertens. 2018;36:15061513. doi:10.1097/HJH.0000000000001722
- The WHO STEPwise approach to non-communicable disease risk factor surveillance. WHO STEPS surveillance manual. BMI Classification Chart. World Health Organization; 2017. Available from: https://cdn.who.int/media/docs/default-source/ncds/ncd-surveillance/steps/steps-manual_f0075411-1e6d-46ef-85befe826d2b9c47.pdf?sfvrsn=c281673d_5. Accessed April 22, 2022.
- Alberti KG, Zimmet PZ. Definition, diagnosis and classification of diabetes mellitus and its complications. Part 1: di-agnosis and classification of diabetes mellitus provisional report of a WHO consultation. Diabet Med. 1998;15:539–553. doi:10.1002/(SICI)1096-9136(199807)15:7<539::AID-DIA668>3.0.CO;2-S
- Wan Z, Song L, Hu L, et al. Temporal trends in hyperuricaemia among adults in Wuhan city, China, from 2010 to 2019: a cross-sectional study. BMJ Open. 2021;11(3):e043917. doi:10.1136/bmjopen-2020-043917
- Liu R, Han C, Wu D, et al. Prevalence of hyperuricemia and gout in mainland China from 2000 to 2014: a systematic review and meta-analysis. Biomed Res Int. 2015;2015:762820. doi:10.1155/2015/762820
- Virdis A, Masi S, Casiglia E, et al. Identification of the uric acid thresholds predicting an increased total and cardiovascular mortality over 20 years. Hypertension. 2020;75(2):302–308. doi:10.1161/HYPERTENSIONAHA.119.13643
- Wang H, Wei Y, Kong X, et al. Effects of urate-lowering therapy in hyperuricemia on slowing the progression of renal function: a meta-analysis. J Ren Nutr Offic J Counc Ren Nutr Natl Kidn Found. 2013;23(5):389e96. doi:10.1053/j.jrn.2012.08.005
- Fujii R, Yamada H, Tsuboi Y, et al. Association between circulating microRNAs and changes in kidney function: a five-year prospective study among Japanese adults without CKD. Clin Chim Acta. 2021;521:97–103. doi:10.1016/j.cca.2021.07.002
- Yan G, Zhao W-H, Wan Y, Ren J-H, Shen J-H. Risk factor analysis of the decline in the estimated glomerular filtration rate in a healthy population. J Biol Regul Homeost Agents. 2023;37(5):2733–2737. doi:10.23812/j.biol.regul.homeost.agents.20233705.270
- Whelton A, MacDonald PA, Chefo S, et al. Preservation of renal function during gout treatment with febuxostat: a quantitative study. Postgrad Med. 2013;125(1):106–114. doi:10.3810/pgm.2013.01.2626
- Lin YC, Lai TS, Lin SL, Chen YM, Chu TS, Tu YK. The impact of baseline glomerular filtration rate on subsequent changes of glomerular filtration rate in patients with chronic kidney disease. Sci Rep. 2021;11(1):7894. doi:10.1038/s41598-021-86955-z
- Melsom T, Nair V, Schei J, et al. Correlation between baseline GFR and subsequent change in GFR in Norwegian adults without diabetes and in Pima Indians. Am J Kidney Dis. 2019;73(6):777–785. doi:10.1053/j.ajkd.2018.11.011
- Kilbride HS, Stevens PE, Eaglestone G, et al. Accuracy of the MDRD (modification of diet in renal disease) study and CKD-EPI (CKD epidemiology collaboration) equations for estimation of GFR in the elderly. Am J Kidney Dis. 2013;61(1):57–66. doi:10.1053/j.ajkd.2012.06.016
- Xin Chakkarwar VA, Kawtikwar P. Fenofibrate prevents nicotine-induced acute kidney injury: possible involvement of endothelial nitric oxide synthase. Indian J Nephrol. 2021;31(5):435–441. doi:10.4103/ijn.IJN_380_20