
Abstract
Background
Hepatocellular carcinoma (HCC) relapse is the main reason for the poor prognosis of HCC after Liver transplantation (LT). This study aimed to explore the molecular mechanisms and immune repertoire profiles of HCC relapse.
Material and Methods
RNA-seq of blood samples from patients with normal (n=12) and HCC relapse (n=6) after LT was performed to identify differentially expressed genes (DEGs) and key signalling pathways. The DEGs and immune genes were further analyzed by bioinformatics. TRUST4 was used to analyze the differences in the immune repertoire between the two groups. Another 11 blood samples from patients with HCC who had received LT were collected for RT-qPCR verification of key genes.
Results
A total of 131 upregulated and 157 downregulated genes were identified using RNA-seq, and GO enrichment analysis revealed that the top 15 pathways were immune-related. The PPI network identified 10 key genes. Immune infiltration analysis revealed a significant difference in the five immune cell types between the two groups. A total of 83 intersecting genes were obtained by intersecting DEGs and immune genes. 6 key genes, including MX1, ISG15, OAS1, PRF1, SPP1, and THBS1 were obtained according to the intersection of DEGs, PPI network top 10 genes and immune intersecting genes. Immune repertoire analysis showed that the usage frequency of variable (V) and joining (J) genes in the normal group was higher than that in the relapse group. RT-qPCR validation showed that the expression levels of key genes were consistent with the RNA-seq results.
Conclusion
Our study identified key pathways and genes that could help determine whether transplant recipients are more prone to HCC relapse. Immune repertoire analysis revealed a difference in the usage frequency of VJ genes between the normal and relapse groups, providing a research direction for immunotherapy in patients with HCC relapse after liver transplantation.
Background
Hepatocellular carcinoma (HCC) is currently one of the most common malignant tumors and ranks sixth in the global cancer incidence rate and fourth in cancer-related deaths worldwide.Citation1,Citation2 Currently, liver transplantation (LT) is considered the optimal treatment strategy for early HCC [meeting the Milan or University of California-San Francisco (UCSF) criteria)], and LT for HCC accounts for 15–50% of all liver transplants performed in most centers.Citation3 Nevertheless, the recurrence rate of HCC after LT is approximately 10–20%, which is the main problem affecting prognosis.Citation4 The median survival of patients with relapsed HCC is approximately 1 year, and most patients (55%) experience hepatic recurrence.Citation5 Although the survival rate of patients with HCC has greatly improved,Citation6,Citation7 HCC relapse after LT cannot be accurately predicted.
To accurately predict the progression and prognosis of HCC relapse after LT, several molecular biological studies have been carried out.Citation8–13 Some biomarkers such as alpha-fetoprotein (AFP) have been used to detect recurrence after LT, but they cannot be adjusted for the risk of recurrence of an individual patient.Citation14 Evidence suggests that overexpression of osteopontin may be an unfavorable prognostic factor and a useful marker for predicting the early recurrence of early HCC.Citation9 A study based on miRNA microarray showed that there were different miRNA expression patterns between HCC samples from relapsed and non-relapsed patients, and it was significantly related to tumor recurrence and survival of HCC patients after LT.Citation8 An integration analysis of HCC showed that an IFN-induced HECT-type E3 protein ligase gene (HERC5) is related to shorter tumor recurrence time and overall survival time of HCC patients.Citation13 Although a large number of biomarkers have been reported, the molecular mechanism of HCC relapse after LT has not been fully elucidated, and further research is needed to identify the key signaling pathways and genes.
Recently, cancer immunotherapies have attracted widespread attention, with prominent breakthroughs in the field of tumor immunology, and the identification of immune receptor sequences is of great significance in immunological.Citation15 Both T-cell receptors (TCRs) and B-cell receptors (BCRs) have a highly variable complementarity-determining region 3 (CDR3) that determines the specificity of antigen recognition by T and B cells.Citation16 The diversity of CDR3 mainly depends on the recombination of variable (V), diversity (D), and joining (J) gene fragments as well as gene insertion/deletion.Citation15 RNA-seq data contain expressed TCR and BCR sequences in peripheral blood mononuclear cells. However, because repertoire sequences from V (D) J recombination and SHM are different from the germline, they are often eliminated in the read-mapping step.Citation17,Citation18 TRUST4 is a computational method that suitable for reconstructing immune receptor libraries in T and B cells from RNA-seq data and mining immune repertoire profiling. It not only led to more accurate estimations of receptor diversities, but also allows a more detailed characterization of SHM in the CDR3s.Citation18,Citation19 Through collecting immune repertoire data, the state of tumor microenvironment can be evaluated, personalized immunotherapy can be designed, and the effectiveness of immunotherapy can be predicted. To the best of our knowledge, there are no reports on the use of TRUST4 for immune repertoire profiling of HCC relapses after LT.
In this study, RNA-seq analysis was conducted on normal and relapse HCC patients after LT to analyze the key genes and signal pathways for HCC relapse, and TRUST4 was used to mine immune repertoire profiling from RNA-seq data, providing novel insights on TCR and BCR in HCC relapse after LT.
Materials and Methods
Patients and Tissue Specimens
Patients with HCC who had received LT in the Third Hospital of Hebei Medical University from December 2017 to May 2021 were included in our study. Eighteen patients were divided into a normal group (n=12) and a relapse group (n=6) based on whether HCC relapsed after LT. There were no significant differences in the clinical and pathological information between the normal and relapse groups after LT, including age, sex, main indications, tumor size, and grade (Supplementary Table 1). All the donated organs were from the Third Hospital of Hebei Medical University, and were donated voluntarily with written informed consent, and that this was conducted in accordance with the Declaration of Istanbul. This study was conducted in accordance with the Declaration of Istanbul and Helsinki and the samples obtained were approved by the ethics committee of the Third Hospital of Hebei Medical University (20210101). The written informed consent was obtained from each patient and their family for clinical data and publication.
The inclusion criteria for patients were as follows:1) radiological examination combined with serum alpha-fetoprotein (AFP) and pathology showed normal liver tissue or HCC relapse; 2) Received LT within 3 years (met the Milan or UCSF criteria when receiving LT); 3) blood samples were available; and 4) patients with detailed clinical information and completed follow-up for 12 months. The exclusion criteria were as follows:1) patients with primary HCC or less than 3 years of survival after LT and 2) patients with other serious diseases or long-term use of large amounts of psychotropic drugs. Through the TIMER database (https://cistrome.shinyapps.io/timer/), the influence of copy number alterations of genes on immune cell infiltration was evaluated.
RNA Sequencing (RNA-Seq) and Data Processing
Total RNA extraction and RNA-seq of blood samples from the patients were performed. An RNAliquid ultrafast whole blood (liquid sample) total RNA extraction kit (Beijing Huitian Oriental Technology Co., Ltd., RN2602) was used for total RNA extraction and an Agilent 2100 Bioanalyzer was used for RNA quality detection. RNA-seq was performed on an Illumina NovaSeq6000 sequencer (Illumina, San Diego, CA, USA). Salmon (Salmon 0.99.0) was used to quantitatively analyze mRNA expression using fastq data and transcripts, and edgeR was used for differential expression analysis.Citation20 With P value <0.05 and |log2 fold change (FC)| >1, the differentially expressed genes (DEGs) between the normal and relapse groups were obtained.
Functional Enrichment and Construction of Protein-Protein Interaction Network
To predict the function of DEGs, Gene Ontology (GO) function and Kyoto Encyclopedia of Genes and Genomes (KEGG) pathway enrichment were performed using cluster Profiler. The STRING database (https://string-db.org/) was used to perform protein-protein interaction (PPI) network analysis of DEGs. Genes related to the liver and hepatocytes were screened according to annotation information on the STRING website.
Immune-Correlation Analysis
CIBERSORT based on R was used to evaluate immune cell infiltration, and the proportion of 22 immune cells in the sample was calculated based on gene expression. Kruskal–Wallis test was used to analyze the differences in immune cells between the two groups of samples. Immune-related gene sets (https://www.immport.org/shared/genelists) were downloaded from the ImmPort database (https://www.immport.org/home), and all downloaded genes were intersected with DEGs. GO function and KEGG pathway enrichment analyses of intersecting genes were performed. Through the TIMER database (https://cistrome.shinyapps.io/timer/), the influence of copy number alterations of genes on immune cell infiltration was evaluated.
Immune Repertoire Analysis
TRUST4 was used to identify and reconstruct the receptor sequence from RNA-seq data and to mine information on immune repertoire profiling.Citation17 The number, length, and identical clones of complete amino acid sequences in the CDR3 region were identified by TRUST4 between the normal and relapse group. The Shannon–Weiner diversity index was used to assess the diversity of CDR3 amino acid sequences. Statistical analysis of the usage frequency of VJ genes was performed. R 4.1.0 was used for all statistical analyses, and the Wilcoxon test was used to determine statistical significance between groups.
Identification of Key Genes and the Transcription Factor Regulatory Networks
The key genes were obtained according to the intersection of DEGs, PPI network top 10 genes and immune intersection genes. Transcription factor subsets were obtained from the Cistrome (http://cistrome.org/) database, and the corresponding TF expression values were obtained from sequencing data. Through correlation analysis, transcription factors related to key genes were identified under the conditions of |Pearson correlation coefficient| > 0.5 and p-value < 0.05, and a regulatory network was constructed in Cytoscape to clearly display the regulatory relationship between key genes and transcription factors.
Real-Time qPCR (RT-qPCR)
Another 15 blood samples with HCC (7 patients with relapse and 8 normal) who had received LT in the Third Hospital of Hebei Medical University were included for RT-qPCR verification, and the inclusion and exclusion criteria were consistent with RNA-seq. Total RNA was extracted, and mRNA was reverse-transcribed using a FastKing cDNA First Strand Synthesis Kit (TIANGEN, KR116). SuperReal PreMix Plus (SYBR Green) was used to amplify the target genes in the Gene-9660 fluorescent quantitative PCR instrument, and relative quantitative analysis of the target genes was carried out using the 2−ΔΔct method. Primers used for RT-qPCR were listed in Supplementary Table 2.
Results
Identification of DEGs and Functional Enrichment
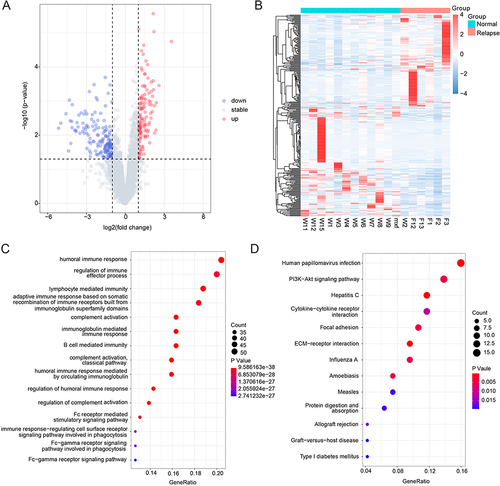
According to P value <0.05 and |log2FC| >1, 288 DEGs were screened, including 131 upregulated and 157 downregulated genes. The volcano plot and heat map of the DEGs are shown in and , and the top 20 DEGs are listed in . GO function and KEGG pathway analyses showed enrichment for 86 and 13 pathways, respectively. GO enrichment analysis indicated that the top 15 pathways were all related to immunity, among which the complement activation and classical pathways were the most significantly enriched GO terms (). KEGG pathway analysis showed that the DEGs were mainly enriched in ECM-receptor interactions, hepatitis C, human papillomavirus infection, allograft rejection, and type I diabetes mellitus ().
Table 1 Top 20 DEGs in HCC Relapse After LT
Figure 1 Identification of DEGs and functional enrichment. (A) The volcano plot of DEGs, blue dots indicate down-regulated genes, gray dots indicate stable genes, while red dots indicate up-regulated genes; (B) The heat map of DEGs, each row corresponds to the expression profile of an HCC sample, and each row column corresponds to a gene. The higher intensities of red mean higher expression level, while the lower intensities of blue mean lower expression level; (C) The top 15 enriched terms in GO enrichment of DEGs; (D) The KEGG pathway of DEGs, the size of the dot represents the number of genes contained in the pathway, and the larger the dot, the more genes. The color of the dots represents the difference in the pathway between the normal and recurrent groups, with a redder color indicating a smaller p-value.
Construction of PPI Network
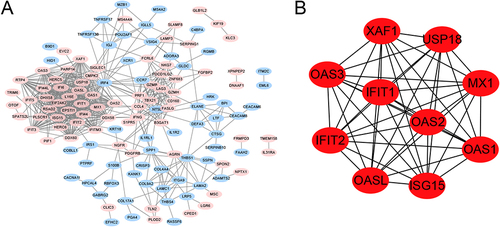
The PPI network of DEGs is shown in , marked in red, indicating upregulation of the gene, whereas blue indicates downregulation of the gene. Based on the gene function annotation information on STRING, 44 genes related to the liver and liver cells were screened. The top 10 genes with the highest degrees were MX1, USP18, ISG15, OAS1, OASL, IFITM3, PARP14, PRF1, SPP1, and THBS1 ().
Figure 2 The protein-protein interaction (PPI) network. (A) The PPI network of DEGs, marked in red indicates up-regulation of the gene, while blue indicates down-regulation of the gene, the connecting lines indicate the association of the two genes; (B) The top 10 genes with higher degree.
Immune-Correlation Analysis of DEGs
Given that GO analysis showed that HCC relapse after LT may be related to immunity, an immune correlation analysis for the DEGs was carried out. The abundance of immune cells was analyzed using CIBERSORT, and there were significant differences in the abundance of the 5 immune cells between the normal and relapse groups (). Neutrophils, regulatory T cells, and plasma cells had a higher degree of infiltration in the normal group, whereas resting NK cells and T cells CD4 memory activated had a higher degree of infiltration in the relapse group. The proportion of each immune cell in the normal group and the relapse group was shown in , among which the neutrophils was the immune cell with the highest proportion.
Figure 3 The immune-correlation analysis. (A) The immune cells abundance between the normal and relapse groups, *represents P-value <0.05, **represents P-value <0.01, ns represents non-significant; (B) The proportion of each immune cell in the normal group and the relapse group; (C) Venn for the intersection genes in immune-related functional genes and DEGs; (D) The gene set to which intersecting genes belong.
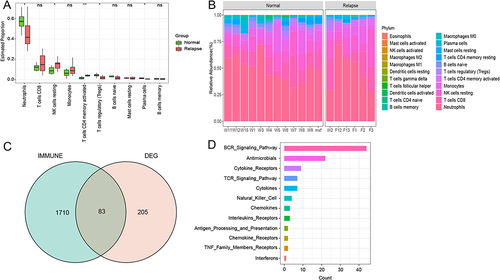
In the immPort database, 17 immune-related functional gene sets were obtained, and 83 genes were obtained by crossing all downloaded genes and DEGs (). According to the number of intersecting genes included in each immune function gene set, the signal pathways with more intersecting genes included the BCR signaling pathway, antimicrobials, cytokine receptors, and TCR signaling pathway ().
GO and KEGG Pathway Analysis of Intersection Genes
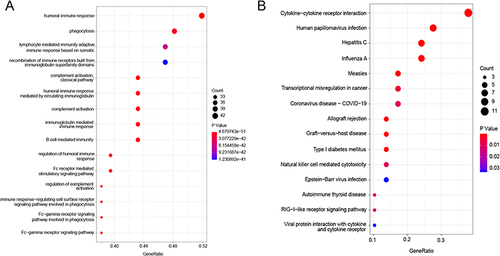
GO and KEGG pathway enrichment analyses were performed for intersecting genes (). Consistent with the GO functional analysis of DEGs and complement activation, the classical pathway was the most significantly enriched GO term. Among the KEGG enrichment pathways, the intersecting genes were significantly enriched in cytokine–cytokine receptor interactions.
Figure 4 The GO enrichment and KEGG pathways of intersection genes. (A) The top 15 GO terms of intersection genes; (B) The top 15 KEGG pathways of intersection genes.
Immune Repertoire Analysis
TRUST4 was used to identify immune cell receptor sequences from the RNA-seq data. The number of complete amino acid sequences of the CDR3 region recognized by TRUST4 was counted (Supplementary Figure 1A), and there was no significant difference between the normal and relapse groups (). According to statistics of the same clone recognized by TRUST4, there were similar degrees of reuse patterns in normal and relapse patients (). The distribution of amino acid (aa) lengths in the CDR3 region was consistent between the normal and relapse groups, with the most frequently used length being 11 aa in both groups ( and Supplementary Figure 1B). The diversity of the CDR3 amino acid sequence was calculated using the Shannon-Weiner diversity index. The diversity in the normal group was slightly higher than that in the relapse group, but the difference was not statistically significant ().
Figure 5 The immune repertoire analysis. (A) The comparison of the number of complete amino acid in CDR3 region between normal and the relapse groups; (B) The clone distribution of the normal group and the relapse group, unique (n =1), duplicated (n =2), and clonal (n ≥3) are labeled with different colors; (C) The comparison of the length of amino acids in CDR3 region between normal and relapse groups; (D) The comparison of amino acid sequence diversity in CDR3 region between normal and relapse group; The diversity of CDR3 amino acid sequence was calculated using Shannon-Weiner diversity index. P-value was calculated using the Mann–Whitney U-test; (E and F) The frequency and differential analysis of V and J gene segments of normal and relapse group.
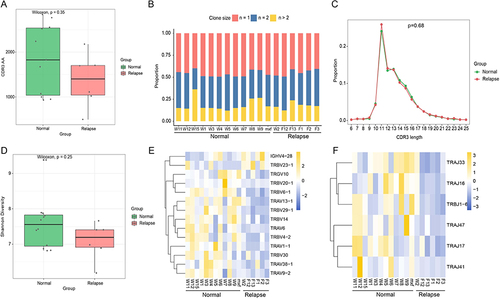
Different permutations, insertions, and deletions of VJ genes are crucial for the sequence diversity of immune receptors. According to the statistics of the use frequency of VJ genes, it was found that the different genes mostly appeared in TCR, and the frequency of VJ genes in the normal group was mostly higher than that in the relapse group (E and ).
Transcription Factor Regulatory Network of Key Genes
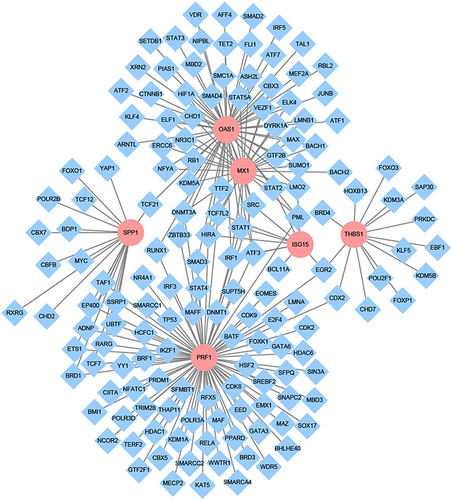
According to the intersection of DEGs, PPI network top 10 genes and immune intersection genes, 6 key genes, including MX1, ISG15, OAS1, PRF1, SPP1, and THBS1 were obtained. As shown in , 153 transcription factors associated with key genes were identified through correlation analysis (|Pearson correlation coefficient| > 0.5, p-value < 0.05), with the highest number of transcription factors associated with PRF1, and the strongest correlation between EOMES and PRF1 (Pearson correlation coefficient = 0.93).
Figure 6 The transcription factor regulatory network of key genes. Pink represents key genes and blue was the associated transcription factors, the connecting lines indicate the association of the two genes.
Effects of Deletion and Gain of Key Genes in HCC on Immune Cells
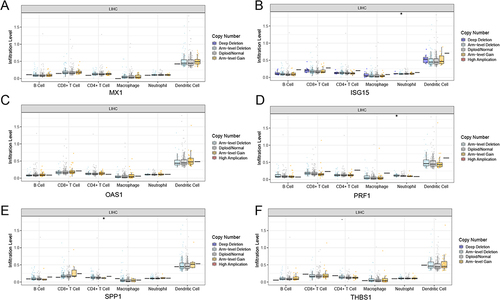
The TIMER was used to investigate the effect of different somatic copy number alterations on immune cell infiltration in HCC (). Compared with normal group, the occurrence of arm level deletion in ISG15 leads to a significant decrease in neutrophils, while the occurrence of arm level deletion in PRF1 leads to a significant increase in neutrophils, and the occurrence of arm level gain in SPP1 leads to a significant decrease in the number of CD4+T cells.
Figure 7 The effect of copy number alterations of key genes in HCC on immune cells. (A-F) the copy number alterations of MX1, ISG15, OAS1, PRF1,SPP1, and THBS1 in HCC on immmune cells, *Represents P-value <0.05.
RT-qPCR
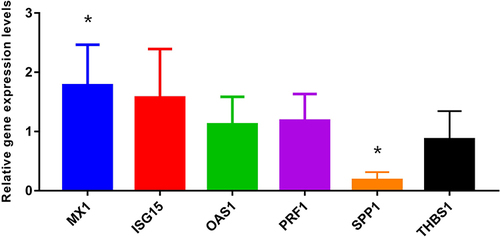
The expression of MX1, ISG15, OAS1, SPP1, PRF1, and THBS1 was verified by RT-qPCR in another 11 patients (). The results showed that MX1 was significantly upregulated in the relapse group, whereas SPP1 was significantly downregulated, consistent with the RNA-seq results. The expression levels of ISG15, OAS1, and PRF1 were upregulated and THBS1 was downregulated, which was consistent with the RNA-seq trend, but there was no significant difference between the two groups.
Figure 8 The RT-qPCR validation. *Represents P-value <0.05.
Discussion
HCC relapse is the main reason for the poor prognosis of HCC after LT. RETREAT is currently used to monitor HCC relapse after LT, including implant tumor load, microvascular invasion, and AFP levels; however, it cannot predict the occurrence of HCC relapse.Citation21 With the development of next-generation sequencing technology, RNA-seq has become a useful tool for exploring transcriptome changes, which are widely used in the identification of key genes and signalling pathways.Citation22 Although the overlap between tumor-infiltrating lymphocytes (TILs) and peripheral blood repertoires is limited, there is evidence of changes in the peripheral repertoire of cancer patients that may reflect certain aspects of the disease.Citation23,Citation24 In this study, RNA-seq was performed on blood samples from patients in the normal and relapse groups to identify key genes and signaling pathways that predict the occurrence of HCC relapse. TRUST4 was used to mine the immune repertoire profile to provide a potential target for immunotherapy against HCC relapse.
A total of 131 upregulated genes and 157 downregulated genes were identified by RNA-seq, and GO enrichment of DEGs was mainly concentrated in immune-related pathways, among which the most significant pathway was complement activation, the classical pathway, which plays a crucial role in innate defense against common pathogens.Citation25 Notably, the KEGG pathway of DEGs was enriched in allograft rejection, which is a part of the adaptive immune response.Citation26 Previous studies have also revealed a key role for immune cells in the initiation, metastasis, and recurrence of HCC.Citation27,Citation28 Therefore, it is necessary to reveal the potential mechanism of HCC relapse and identify potential predictive targets, with emphasis on immune repertoire profiling. Based on the RNA-seq data, a differential analysis of immune cells in the normal and relapse groups was conducted, and it was found that there were significant differences in the abundance of the five types of immune cells between the two groups. In addition, 83 intersecting genes were obtained by crossing DEGs with immune genes, among which the gene sets containing more genes included the BCR and TCR signaling pathways, which also provides a research direction for the prediction of HCC relapse after LT.
MX1 encodes myxovirus resistance protein A (MxA), an interferon-induced GTP enzyme that captures and prevents viral components from reaching cellular destinations in the early post-entry step of the viral lifecycle.Citation29 A cross-sectional study suggested that the MX1 polymorphism is associated with the severity of liver disease in patients with HIV/HCV coinfection, suggesting an important role in the progression of liver fibrosis.Citation30 High MX1 protein expression was associated with aggressive features, including large tumor size and high tumor grade, and was an independent predictor of poor outcomes in breast cancer patients.Citation31 Consistently, RNA-seq and RT-qPCR results indicated that the expression of MX1 was significantly higher in patients with HCC relapse than in normal patients, indicating that MX1 may also be involved in HCC relapse after LT.
Interferon-stimulated gene 15 (ISG15) plays a crucial role in HCC progression and triggers the occurrence and metastasis of HCC.Citation32 The expression of ISG15 in HCC tissues was significantly correlated with tumor size, TNM stage, and differentiation. ISG15 overexpression increases the proliferation of HCC cells, and ISG15 may be a carcinogenic gene in HCC.Citation33 Consistent with previous studies, the RNA-seq analysis in this study showed that the expression of ISG15 in the blood of patients with HCC relapse was significantly higher than that in normal patients, which may promote the proliferation of HCC cells and lead to HCC relapse. Therefore, ISG15 may also serve as a biomarker for predicting HCC relapse after LT.
PRF1 encodes perforin, a pore-forming protein expressed only in killer lymphocytes.Citation34 Research has suggested that perforin plays a dominant role in CD8+ T cell-mediated lysis of HCV-replicating human hepatoma cells.Citation35 Moreover, PRF1 is an independent factor affecting the prognosis of HCC, and has good predictive performance in terms of prognosis and recurrence.Citation36 Consistently, in our study, PRF1 was upregulated in relapse patients, and the occurrence of Arm level Deletion in PRF1 resulted in a significant increase in the number of Neutrophil cells, these results indicate that PRF1 can also be used for predicting HCC relapse after LT.
With breakthroughs in the field of tumor immunology, researchers have begun to apply immune sequence sequencing to assess the genetic responses of patients to current immunotherapy.Citation15 However, few studies have been conducted on the immune sequences in patients with HCC relapse. TCR/BCR-seq can be used to conduct detailed research on tumor immune banks; however, these techniques are expensive and sometimes not feasible for limited tissue biopsies.Citation37 Although the TRUST4 algorithm is not as sensitive as TCR/BCR-seq, TRUST can identify TCRs/BCRs that are highly expressed and potentially cloned in RNA-seq data, which are more likely to participate in antigen binding.Citation17 In this study, TRUST4 was used to mine the immune repertoire profile from blood RNA-seq data of patients in the normal and relapse group. Owing to the continuous proliferation of cancer cells, malignant clones typically occupy the majority of the immune system and the frequency of specific gene sequences exceeds that of other gene sequences.Citation37 Consistently, high-throughput sequencing found no significant difference in total VJ use between peripheral blood samples from patients with HCC and healthy adults. However, TRBV18, TRBV4-1, TRBV4-2, and TRBV6-9 may be potential classifiers for distinguishing between HCC and healthy adults.Citation38 Herein, we also identified some VJ genes with different usage frequencies, which may provide a research direction for immunotherapy in patients prone to HCC relapse after LT.
Our study had some limitations. First, this is a pilot study, and our sample size is limited. A larger sample size and etiological study will be needed to validate our results. Second, in our study, the sequencing results were validated only with RT-qPCR, and the RT-qPCR results need to be validated by protein expression analysis in the future. Finally, SPP1 was downregulated in the blood samples of patients with relapse in our study, and related studies have shown that the protein encoded by SPP1 is upregulated in HCC tumor tissue,Citation39 and we will further explore the expression of SPP1 in future studies. Despite these shortcomings, our study preliminarily revealed the molecular mechanism underlying HCC relapse after LT, providing a research direction for identifying HCC relapse after LT.
In summary, based on RNA-seq, the key pathways and genes for HCC relapse were identified, which helped identify transplant recipients who are more prone to tumor relapse. Immune repertoire analysis revealed a difference in the usage frequency of VJ genes between the normal and relapse groups, providing a research direction for immunotherapy in patients prone to HCC relapse after liver transplantation.
Abbreviations
RNA-seq, RNA sequencing; LT, liver transplantation; HCC, hepatocellular carcinoma; DEGs, differentially expressed genes; PPI, protein-protein interaction; UCSF, University of California, San Francisco; TCRs, T cell receptors; BCRs, B cell receptors; CDR3, complementarity-determining region 3; AFP, alpha fetoprotein; GO, Gene Ontology; KEGG, Kyoto Encyclopedia of Genes and Genomes; RT-qPCR, Real-time qPCR; aa, amino acids; TILs, tumor-infiltrating lymphocytes; ISG15, Interferon-stimulated gene 15.
Data Sharing Statement
All data generated or analyzed during this study are included in this published article.
Ethics Approval and Consent to Participate
The study was conducted in accordance with the Declaration of Helsinki and Istanbul and the samples obtained were approved by the ethics committee of the Third Hospital of Hebei Medical University (20210101). The written informed consent was obtained from each patient and their family for clinical data and publication.
Consent for Publication
The subjects provided written informed consent for publication of any associated data and accompanying images.
Disclosure
All authors declare that they have no conflicts of interest for this work.
Additional information
Funding
References
- Forner A, Reig M, Bruix J. Hepatocellular carcinoma. Lancet. 2018;391(10127):1301–1314. doi:10.1016/s0140-6736(18)30010-2
- Fitzmaurice C, Allen C, Barber RM, et al. Global, Regional, and National Cancer Incidence, Mortality, Years of Life Lost, Years Lived With Disability, and Disability-Adjusted Life-years for 32 Cancer Groups, 1990 to 2015: a Systematic Analysis for the Global Burden of Disease Study. JAMA Oncol. 2017;3(4):524–548. doi:10.1001/jamaoncol.2016.5688
- Sapisochin G, Bruix J. Liver transplantation for hepatocellular carcinoma: outcomes and novel surgical approaches. Nat Rev Gastroenterol Hepatol. 2017;14(4):203–217. doi:10.1038/nrgastro.2016.193
- Fernandez-Sevilla E, Allard MA, Selten J, et al. Recurrence of hepatocellular carcinoma after liver transplantation: is there a place for resection? Liver Transpl. 2017;23(4):440–447. doi:10.1002/lt.24742
- Kim M, Rhu J, Choi GS, et al. Risk factors for poor survival after recurrence of hepatocellular carcinoma after liver transplantation. Ann Surg Treat Res. 2021;101(1):28–36. doi:10.4174/astr.2021.101.1.28
- Mazzaferro V, Regalia E, Doci R, et al. Liver transplantation for the treatment of small hepatocellular carcinomas in patients with cirrhosis. N Engl J Med. 1996;334(11):693–699. doi:10.1056/nejm199603143341104
- Yao FY, Ferrell L, Bass NM, et al. Liver transplantation for hepatocellular carcinoma: expansion of the tumor size limits does not adversely impact survival. Hepatology. 2001;33(6):1394–1403. doi:10.1053/jhep.2001.24563
- Han ZB, Zhong L, Teng MJ, et al. Identification of recurrence-related microRNAs in hepatocellular carcinoma following liver transplantation. Mol Oncol. 2012;6(4):445–457. doi:10.1016/j.molonc.2012.04.001
- Pan HW, Ou YH, Peng SY, et al. Overexpression of osteopontin is associated with intrahepatic metastasis, early recurrence, and poorer prognosis of surgically resected hepatocellular carcinoma. Cancer. 2003;98(1):119–127. doi:10.1002/cncr.11487
- Sieghart W, Wang X, Schmid K, et al. Osteopontin expression predicts overall survival after liver transplantation for hepatocellular carcinoma in patients beyond the Milan criteria. J Hepatol. 2011;54(1):89–97. doi:10.1016/j.jhep.2010.06.030
- Iizuka N, Oka M, Yamada-Okabe H, et al. Oligonucleotide microarray for prediction of early intrahepatic recurrence of hepatocellular carcinoma after curative resection. Lancet. 2003;361(9361):923–929. doi:10.1016/s0140-6736(03)12775-4
- Kurokawa Y, Matoba R, Takemasa I, et al. Molecular-based prediction of early recurrence in hepatocellular carcinoma. J Hepatol. 2004;41(2):284–291. doi:10.1016/j.jhep.2004.04.031
- Xue F, Higgs BW, Huang J, et al. HERC5 is a prognostic biomarker for post-liver transplant recurrent human hepatocellular carcinoma. J Transl Med. 2015;13(379). doi:10.1186/s12967-015-0743-2
- Chan EY, Larson AM, Fix OK, et al. Identifying risk for recurrent hepatocellular carcinoma after liver transplantation: implications for surveillance studies and new adjuvant therapies. Liver Transpl. 2008;14(7):956–965. doi:10.1002/lt.21449
- Zhuang Y, Zhang C, Wu Q, et al. Application of immune repertoire sequencing in cancer immunotherapy. Int Immunopharmacol. 2019;74(105688):105688. doi:10.1016/j.intimp.2019.105688
- Six A, Mariotti-Ferrandiz ME, Chaara W, et al. The past, present, and future of immune repertoire biology - The rise of next-generation repertoire analysis. Front Immunol. 2013;4(413). doi:10.3389/fimmu.2013.00413
- Song L, Cohen D, Ouyang Z, et al. TRUST4: immune repertoire reconstruction from bulk and single-cell RNA-seq data. Nat Methods. 2021;18(6):627–630. doi:10.1038/s41592-021-01142-2
- Song L, Ouyang Z, Cohen D, et al. Comprehensive Characterizations of Immune Receptor Repertoire in Tumors and Cancer Immunotherapy Studies. Cancer Immunol Res. 2022;10(7):788–799. doi:10.1158/2326-6066.Cir-21-0965
- Chang YS, Hsu MH, Tu SJ, et al. Metatranscriptomic Analysis of Human Lung Metagenomes from Patients with Lung Cancer. Genes. 2021;12(9):1458. doi:10.3390/genes12091458
- Robinson MD, McCarthy DJ, Smyth GK. edgeR: a Bioconductor package for differential expression analysis of digital gene expression data. Bioinformatics. 2010;26(1):139–140. doi:10.1093/bioinformatics/btp616
- Mehta N, Heimbach J, Harnois DM, et al. Validation of a Risk Estimation of Tumor Recurrence After Transplant (RETREAT) Score for Hepatocellular Carcinoma Recurrence After Liver Transplant. JAMA Oncol. 2017;3(4):493–500. doi:10.1001/jamaoncol.2016.5116
- Liu Y, Al-Adra DP, Lan R, et al. RNA sequencing analysis of hepatocellular carcinoma identified oxidative phosphorylation as a major pathologic feature. Hepatol Commun. 2022;6(8):2170–2181. doi:10.1002/hep4.1945
- Cui JH, Lin KR, Yuan SH, et al. TCR Repertoire as a Novel Indicator for Immune Monitoring and Prognosis Assessment of Patients With Cervical Cancer. Front Immunol. 2018;9:2729. doi:10.3389/fimmu.2018.02729
- Liu YY, Yang QF, Yang JS, et al. Characteristics and prognostic significance of profiling the peripheral blood T-cell receptor repertoire in patients with advanced lung cancer. Int J Cancer. 2019;145(5):1423–1431. doi:10.1002/ijc.32145
- Dunkelberger JR, Song WC. Complement and its role in innate and adaptive immune responses. Cell Res. 2010;20(1):34–50. doi:10.1038/cr.2009.139
- Usuelli V, Loretelli C, Seelam AJ, et al. Novel Soluble Mediators of Innate Immune System Activation in Solid Allograft Rejection. Transplantation. 2022;106(3):500–509. doi:10.1097/tp.0000000000003834
- Eggert T, Wolter K, Ji J, et al. Distinct Functions of Senescence-Associated Immune Responses in Liver Tumor Surveillance and Tumor Progression. Cancer Cell. 2016;30(4):533–547. doi:10.1016/j.ccell.2016.09.003
- Luo D, Zhang X, Li XK, et al. Identification of Key Functional Modules and Immunomodulatory Regulators of Hepatocellular Carcinoma. J Immunol Res. 2021;2021:1801873. doi:10.1155/2021/1801873
- Schneider WM, Chevillotte MD, Rice CM. Interferon-stimulated genes: a complex web of host defenses. Annu Rev Immunol. 2014;32(1):513–545. doi:10.1146/annurev-immunol-032713-120231
- García-álvarez M, Berenguer J, Jiménez-Sousa MA, et al. Mx1, OAS1 and OAS2 polymorphisms are associated with the severity of liver disease in HIV/HCV-coinfected patients: a cross-sectional study. Sci Rep. 2017;7(1):41516. doi:10.1038/srep41516
- Aljohani AI, Joseph C, Kurozumi S, et al. Myxovirus resistance 1 (MX1) is an independent predictor of poor outcome in invasive breast cancer. Breast Cancer Res Treat. 2020;181(3):541–551. doi:10.1007/s10549-020-05646-x
- Li C, Wang J, Zhang H, et al. Interferon-stimulated gene 15 (ISG15) is a trigger for tumorigenesis and metastasis of hepatocellular carcinoma. Oncotarget. 2014;5(18):8429–8441. doi:10.18632/oncotarget.2316
- Chen B, Jin S, Bai B, et al. Knockdown of interferon-stimulated gene 15 affects the sensitivity of hepatocellular carcinoma cells to norcantharidin. Exp Ther Med. 2019;18(5):3751–3758. doi:10.3892/etm.2019.8028
- Liu X, Lieberman J. Knocking ‘em Dead: pore-Forming Proteins in Immune Defense. Annu Rev Immunol. 2020;38(1):455–485. doi:10.1146/annurev-immunol-111319-023800
- Jo J, Bengsch B, Seigel B, et al. Low perforin expression of early differentiated HCV-specific CD8+ T cells limits their hepatotoxic potential. J Hepatol. 2012;57(1):9–16. doi:10.1016/j.jhep.2012.02.030
- Duan S, Gao J, Lou W, et al. Prognostic signature for hepatocellular carcinoma based on 4 pyroptosis-related genes. BMC Med Genomics. 2022;15(1):166. doi:10.1186/s12920-022-01322-9
- Cowell LG. The Diagnostic, Prognostic, and Therapeutic Potential of Adaptive Immune Receptor Repertoire Profiling in Cancer. Cancer Res. 2020;80(4):643–654. doi:10.1158/0008-5472.Can-19-1457
- Han Y, Liu X, Wang Y, et al. Identification of characteristic TRB V usage in HBV-associated HCC by using differential expression profiling analysis. Oncoimmunology. 2015;4(8):e1021537. doi:10.1080/2162402x.2015.1021537
- Liu L, Zhang R, Deng J, et al. Construction of TME and Identification of crosstalk between malignant cells and macrophages by SPP1 in hepatocellular carcinoma. Cancer Immunol Immunother. 2022;71(1):121–136. doi:10.1007/s00262-021-02967-8