
Abstract
Background
RAD51 associated protein 1 (RAD51AP1) is shown to regulate cell proliferation and cancer progression. However, the immune-infiltrating correlation and the therapeutics guidance of RAD51AP1 in hepatocellular carcinoma (HCC) still need further investigation.
Methods
In this study, comprehensive bioinformatic analysis of RAD51AP1 on differential expression, clinicopathologic correlation, prognostic value, and function enrichment were performed in The Cancer Genome Atlas (TCGA), Gene Expression Omnibus (GEO; GSE14520 and GSE76427), and International Cancer Genome Consortium (ICGC) datasets. Besides, the Guangxi cohort containing 50 pairs HCC and adjacent non-cancerous samples from First Affiliated Hospital of Guangxi Medical University was served as validation cohort. Moreover, we explored the predictive value of RAD51AP1 to therapeutics response and its underlying correlation with HCC immunoinfiltration.
Results
RAD51AP1 was significantly overexpressed in HCC tissues and had a high diagnostic value of HCC. The shorter survival time and poorer clinical features were showed when RAD51AP1 upregulated, and then a nomogram featuring RAD51AP1 expression and other clinicopathologic factors was established to predict prognosis. In CIBERSORT analysis, higher T cells follicular helper but lower T cells CD4+ memory resting infiltration levels were exhibited when RAD51AP1 upregulated. The ssGSEA analysis demonstrated that high-RAD51AP1 expression subgroup had higher macrophages, Th2 and Treg cells infiltration levels, but lower type II IFN response function. Furthermore, high-RAD51AP1 expression subgroup exhibited the upregulated expression levels of immune-related checkpoint genes, but lower IPS and TIDE scores which suggested a possibly better immunotherapy response. The drug sensitivity analysis showed the high-expression subgroup may be more susceptible to Bexarotene, Doxorubicin, Gemcitabine and Tipifarnib.
Conclusion
Taken together, RAD51AP1 is a potential diagnostic and prognostic biomarker. It may be related to the immunosuppressive microenvironment and could be an underlying HCC treatment strategy. However, the conclusions still require further validation studies.
Introduction
Liver cancer is the sixth most widespread cancer and the fourth primary cause of cancer-related death.Citation1 Its incidence and mortality may keep rising by 2030.Citation2 Hepatocellular carcinoma (HCC) with a dismal prognosis is the most prominent type of primary liver cancer.Citation3 The important risk factors of HCC include chronic B or C viral hepatitis, heavy alcohol consumption, metabolic associated fatty liver disease, and aflatoxins.Citation4 Serum alpha fetoprotein (AFP) is a traditional index for the diagnosis and postoperative follow-up of HCC patients. But the diagnosis sensitivity of AFP is only 40–60%.Citation5 For HCC treatment, the development of systemic therapies of HCC has quickly accelerated.Citation6 Nevertheless, the treatment response for advanced HCC is still not optimistic due to tumor heterogeneity and drug resistance.
The DNA damage response plays an anti-cancer role in early human tumorigenesis, and the mutations in DNA repair pathways may increase genomic instability and tumor progression.Citation7 Deregulation of nucleotide pathway and alteration of cGAS/STING gene, which induced DNA damage, could be the crucial mechanisms in the development of non-alcoholic steatotic liver disease, an underlying risk factor of HCC.Citation8 It is demonstrated that full-length hepatitis B virus X protein could decrease the expression of RAD51 expression and impaired apoptosis.Citation9 Exploring and identifying new molecular biomarkers with a satisfactory diagnostic performance is critical to improving the clinical outcome of HCC patients. The human RAD51AP1 gene, located on chromosomes 12p13.1 to 13.2,Citation10 was identified in 1997Citation11 and mainly functions in DNA homologous recombination repair by stimulating RAD51 activity.Citation12 It may play a role in promoting cancer by meditating TGF-β/Smad signaling pathway.Citation13 In the treatment of ionizing radiation for glioblastoma, the elevated phosphorylation of PTEN on tyrosine 240 contributed to DNA repair by the recruitment of RAD51. Moreover, RAD51AP1 may regulate breast cancer stem cell self-renewal, which contributes to the progression of disease. Furthermore, high RAD51AP1 expression was also related to poor cancer prognosis of ovarian cancerCitation13 and lung cancer.Citation14 By contrast, down-regulation of RAD51AP1 was shown to suppress the metastasis and proliferation of lung carcinoma cellsCitation15 and retard the growth of intrahepatic cholangiocarcinoma cells.Citation16 Besides, RAD51AP1 gene has been also reported to be overexpressed in HCCCitation17 and Zhuang et al demonstrated that HCC patients with overexpressed RAD51AP1 had the poor clinical features and dismal prognosis.Citation18
However, the molecular mechanism and detailed clinical significance of RAD51AP1 in HCC have not been completely investigated, especially its immunoinfiltration correlation and therapeutics response guidance, including possible effect of different RAD51AP1 expression levels on immune cell infiltration levels in tumor microenvironment and predicted drug sensitivities of HCC treatment-related chemotherapeutic and immunotherapeutic agents. In this project, we aimed to authenticate the diagnostic, prognostic and therapeutic value of RAD51AP1.
Materials and Methods
Data Source and HCC Samples Collection
The mRNA expression arrays and corresponding clinicopathologic info of HCC patients were retrieved from The Cancer Genome Atlas (TCGA) database (https://portal.gdc.cancer.gov/repository). The GSE14520, GSE76427 and ICGC cohorts, including gene expression profiling and survival info of HCC patients, were retrieved from Gene Expression Omnibus (GEO) (https://www.ncbi.nlm.nih.gov/geo/) and International Cancer Genome Consortium (ICGC; http://dcc.icgc.org) databases. Besides, a total of 50 pairs HCC and corresponding adjacent non-cancerous tissue samples from the First Affiliated Hospital of Guangxi Medical University were served as the Guangxi cohort. Every pair (cancer and non-cancer) sample came from the same patient. Then, the corresponding clinical info, including age, gender, serum AFP, tumor size, histologic grade, portal vein tumor thrombus, China Liver Cancer Staging (CNLC), and Barcelona Clinic Liver Cancer (BCLC) staging were also collected (Supplementary Table 1).
Differential Expression and Prognostics Value Analysis
The differential RAD51AP1 expression analyses between HCC and non-cancerous liver tissues were carried out in the TCGA, GSE14520, GSE76427, ICGC and Guangxi cohorts, respectively. The diagnostic ability of RAD51AP1 for HCC was evaluated through plotting diagnostic receiver operating characteristic (ROC) curves. The median expression of RAD51AP1 was used to categorize the subgroups as high- and low-expression. The prognostic value of RAD51AP1 was explored preliminarily by Kaplan–Meier survival analysis in TCGA-HCC cohort and was validated in the GSE14520 and ICGC cohorts. Using the “ggpubr” R package,Citation19 the difference of RAD51AP1 expression level between different clinicopathological characteristics was investigated in the TCGA and Guangxi cohorts.
Nomogram Construction
Univariate and multivariate Cox regression analyses were performed in TCGA cohort to analyze the prognostic factors of HCC. In the Cox regression analysis, overall survival (OS), including survival time and survival state, was the dependent variable. OS is the period from the date of diagnosis until the date of death from any cause. Furthermore, nomogram is an effective approach to measure the specific risk by integrating multiple variables and establishing a multivariate Cox proportional risk regression model, in which the regression coefficient represents the contribution degree of each influencing factor to the outcome variable. Subsequently, the predicted probability of individual outcome event is determined by the accumulated score of multiple influencing variables. Utilizing the “survival” and “rms” R package,Citation20,Citation21 a nomogram combining RAD51AP1 expression and easily accessible and widely accepted clinicopathological parameters (gender, age, BMI, AFP, histologic grade, Tumor Node Metastasis (TNM) stage, and vascular invasion) was established based upon the TCGA-HCC data to determine the likelihood of 1-, 3-, and 5-year OS for HCC patients. The analysis removed the patients with incomplete clinical data and follow-up periods of fewer than 30 days. The bootstrap method was applied to calculate concordance index (C-index) with 1000 resamples and the discrimination performance of nomogram was examined based on the consistency degree of calibration curves.
Functional Enrichment Analysis
Gene Set Enrichment Analysis (GSEA) software program (v4.1.0) was employed to seek the putative regulatory mechanisms of high- and low-RAD51AP1 expression subgroups in virtue of the gene set data “c2.all.v7.0.symbols.gmt” and “c5.all.v7.0.symbols.gmt”.Citation22 The number of permutations was set at 1000. Functional terms that met the criteria of a nominal P < 0.05 and a false discovery rate (FDR) <0.05 were regarded as significant enrichment pathways.
Additionally, based on the entire mRNA expression profile of the TCGA-HCC dataset, the genome-wide correlation analysis of RAD51AP1 was performed. Genes with correlation coefficient >0.7 and P <0.05 were incorporated to implement the gene ontology terms (GO) and the Kyoto Encyclopedia of Genes and Genomes (KEGG) pathway analyses utilizing the “clusterProfiler” R package.Citation23
Immune Cell Infiltration Analysis
Based on a novel analytical methodology, namely cell-type identification by estimating relative subsets of RNA transcripts (CIBERSORT)Citation24 and TCGA-HCC expression profiling, the proportions of various immune cell in each sample were assessed. Then, the immune infiltration levels in different RAD51AP1 expression subgroups were uncovered. Additionally, the correlation analyses of RAD51AP1 expression and multiple immune cells were also conducted. Tumor Immune Estimation Resource 2 (TIMER2) (http://timer.cistrome.org/), a data repository for measuring immune cell infiltrations of distinct cancers. Spearman correlation analyses in TIMER2 were performed between RAD51AP1 and immune cell subsets to validate the results of CIBERSORT analysis.Citation25 To further illustrate the relationship between RAD51AP1 expression and cancer immunity of HCC, the immune-associated cell infiltration levels and the relative expression activities of various function pathways of the different RAD51AP1 expression subgroups were analyzed and compared in the TCGA and ICGC datasets using the “gsva” R package which was based on an algorithm called single-sample Gene Set Enrichment Analysis (ssGSEA).Citation26 Additionally, the stromal score, immune score and ESTIMATE (Estimation of Stromal and Immune cells in Malignant Tumor tissues using Expression data) score of each TCGA-HCC samples were calculated using the ‘estimate’ R package,Citation27 and the relationships between RAD51AP1 expression and these scores were also excavated.
Drug Sensitivity Prediction Analysis
In the TCGA-HCC cohort, the association between RAD51AP1 expression and tumor mutation burden (TMB), established immune checkpoint genes were explored using the Spearman correlation analysis. The R package “pRRophetic” was applied to determine the half-maximal inhibitory concentration (IC50) of HCC-treatment related chemotherapeutic and immunotherapeutic drugs by ridge regression method.Citation28 Additionally, a computation-based online program called Tumor Immune Dysfunction and Exclusion (TIDE, http://tide.dfci.harvard.edu/) stimulates the immune system of human body to further forecast the response to immune checkpoint inhibitor. The calculated score of TIDE, immune dysfunction, immune exclusion, and microsatellite instability (MSI) data of each TCGA-HCC sample were acquired from TIDE website. In addition, the immunophenotypic score (IPS) of tumor sample can be obtained from the Cancer Immunome Atlas (TCIA, https://tcia.at/), which contains the info of solid cancers from TCGA dataset. IPS contributes to estimate the therapeutic effect of immune-checkpoint inhibitors (ICIs), including anti-programmed cell death protein 1 (PD-1) and anti- cytotoxic T lymphocyte antigen-4 (CTLA-4) antibodies,Citation29 and higher IPS indicates potentially fine response. Subsequently, these immunotherapy-related indicators, including drug IC50, TIDE score and IPS, were compared between the different RAD51AP1 expression subgroups in the TCGA-HCC cohort. Besides that, IMvigor210 dataset, a sizable immunotherapy dataset containing the information of 298 urothelial carcinoma patients at advanced stage who were administered with anti-PD1 inhibitor, was used to grope the immunotherapy response predictability of RAD51AP1 in other cancer.
Reverse Transcription Quantitative PCR
The method of specimen preservation, RNA extraction, and reverse transcription quantitative PCR was conducted as previously described.Citation30 Clinical sample collecting and handling procedures strictly adhered to the standard protocol. The sequence of primers was as follows: GAPDH, forward: GTCAGCCGCATCTTCTTT, reverse: CGCCCAATACGACCAAAT. RAD51AP1, forward: AGTGAAGGTAAAATCCCCAGTAGA, reverse: TGGCAAGGACTGAGATTCTGAT. Using the 2 ∆∆CT approach, the relative mRNA expressions of RAD51AP1 were measured.Citation31
Statistical Analysis
R (v4.1.1) was applied to complete data analysis and result visualization. The Wilcoxon rank-sum test was conducted between the different subgroups with continuous data, while the chi-square test was used for categorical data. Paired t-test was utilized to explore the discrepancy of RAD51AP1 expression levels between HCC samples and adjacent normal tissues of the Guangxi cohort. The association of two variables was probed using the Spearman correlation analysis. Unless otherwise indicated, P < 0.05 was provided as the threshold cutoff value.
Results
The Upregulated Expression Level of RAD51AP1 in HCC
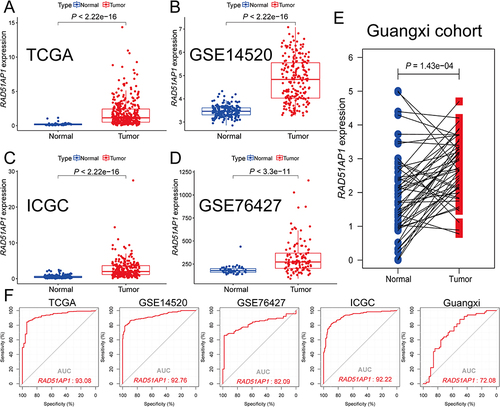
Compared with normal liver tissues, RAD51AP1 gene expression level was markedly over-expressed in HCC in various cohorts (). The ROC curve indicated that RAD51AP1 had a high predictive accuracy of HCC diagnosis with the area under curve (AUC) >0.90 in the TCGA, GSE14520 and ICGC cohorts () and the AUC values of GSE76427 and Guangxi cohorts were 0.82 and 0.72, respectively. These results showed that RAD51AP1 carried a decent diagnostic significance for HCC.
Figure 1 (A–E) Scatter plots illustrated the higher RAD51AP1 expression in HCC compared with normal liver tissues in the TCGA, GEO (GSE14520 and GSE76427), ICGC and Guangxi cohorts. (F) Diagnostic receiver operator curves with decent AUC values of RAD51AP1 for HCC diagnosis in various cohorts.
RAD51AP1 Correlated with Dismal Survival and Poor Clinical Features
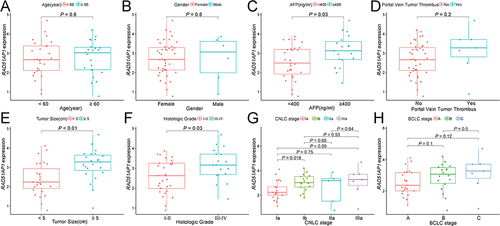
The survival analysis suggested that the high RAD51AP1-expression group showed a poorer OS and recurrence free survival (RFS) than that of the low expression group in the TCGA cohorts ( and ). Furthermore, the dismal prognosis of high RAD51AP1-expression subgroup was confirmed in the GSE14520 and ICGC cohorts ( and ). Moreover, a significantly higher RAD51AP1 gene expression was observed in HCC with serum AFP > 400 ng/mL in the TCGA cohorts. Along with the advance of clinicopathologic features (histologic grade, TNM stage, T staging and vascular invasion degree) which were believed to get poorer prognosis, the expression level of RAD51AP1 presented an upward trend (). In Guangxi cohort, we further confirmed that RAD51AP1 was significantly upregulated in HCC patients with AFP > 400 ng/mL, poor histologic grade, large tumor size and more advanced clinical stage (CNLC Ia vs Ib) ().
Figure 2 Kaplan–Meier curves for OS and RFS with Log rank test between high- and low-RAD51AP1 expression subgroups in the TCGA (A and B). Kaplan–Meier curves for OS with Log rank test between high- and low-RAD51AP1 expression subgroups in the GSE14520 (C) and ICGC (D) cohorts.
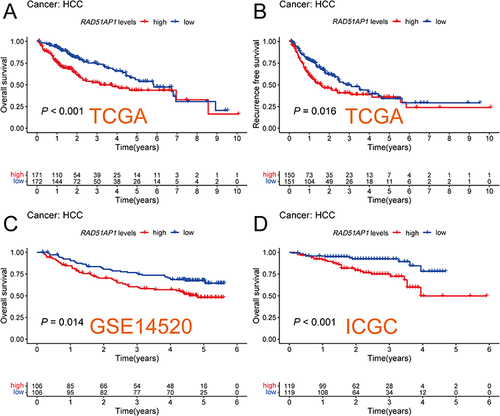
Figure 3 (A–H) The relationship between RAD51AP1 expression and the different clinicopathological characteristics in TCGA cohort, including age, gender, BMI, serum AFP level, histologic grade, TNM stage, T staging and vascular invasion degree.
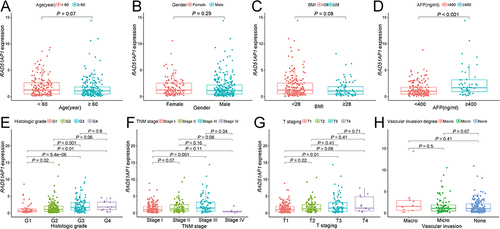
Figure 4 (A–H) The relationship between RAD51AP1 expression and the different clinicopathological characteristics in Guangxi cohort, including age, gender, serum AFP level, portal vein tumor thrombus, tumor size, histologic grade, CNLC and BCLC stage.
Construction of a Nomogram
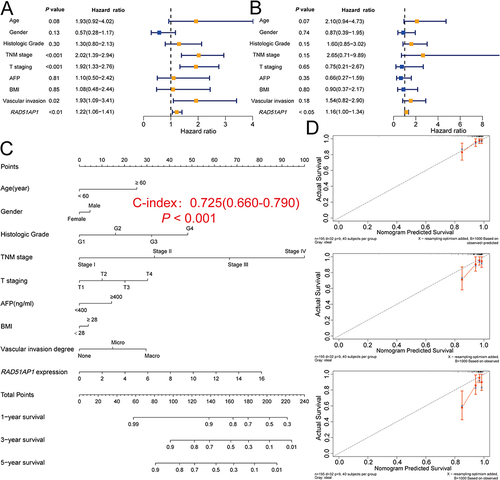
Univariate Cox analysis discovered that RAD51AP1 expression (HR = 1.218; 95% CI = 1.055–1.407), TNM stage, T staging, and vascular invasion were the high-risk factors for poor OS in TCGA-HCC patients (). Furthermore, RAD51AP1 expression (HR = 1.159; 95% CI = 1.002–1.341) remained statistically significant in multivariate Cox analysis. Therefore, we deduced that RAD51AP1 could be identified as an independent prognostic factor (). The established nomogram, featuring RAD51AP1 expression and easily accessible and widely accepted clinicopathological parameters (gender, age, BMI, AFP, histologic grade, Tumor Node Metastasis (TNM) stage, and vascular invasion), contributed to predicting the 1-, 3-, and 5-year OS of HCC patients. The C-index of nomogram is 0.725 (). The calibration curves of nomogram exhibited a satisfactory consistency between the estimated and the actual OS rates at 1, 2, and 3 years ().
Figure 5 (A and B) Univariate and multivariate Cox regression analyses of RAD51AP1 and clinicopathologic factors were used to analyze the prognostic factors of HCC in the TCGA datasets. (C and D) A nomogram featuring RAD51AP1 expression and easily accessible and widely accepted clinicopathological parameters (gender, age, BMI, AFP, histologic grade, TNM stage, and vascular invasion) and its corresponding calibration curves for the OS rates at 1, 2, and 3 years.
RAD51AP1 Was Involved in Cancer-Promoting and Cell Cycle Related Pathways
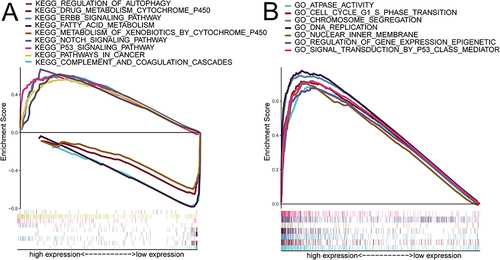
GO terms enrichment analysis discovered that RAD51AP1 up-regulation was significantly related to “ATPASE_ACTIVITY, CELL_CYCLE_G1_S_PHASE_TRANSITION, CHROMOSOME_SEGREGATION, DNA_REPLICATION, NUCLEAR_INNER_MEMBRANE, REGULATION_OF_GENE_EXPRESSION_EPIGENETIC, SIGNAL_TRANSDUCTION_BY_P53_CLASS_MEDIATOR” pathways (). Furthermore, KEGG pathway analysis highlighted that “REGULATION_OF_AUTOPHAGY, NOTCH_SIGNALING_PATHWAY, P53_SIGNALING_PATHWAY, PATHWAYS_IN_CANCER, ERBB_SIGNALING_PATHWAY” pathways were enriched in the up-regulated RAD51AP1 subgroup, while “COMPLEMENT_AND_COAGULATION_CASCADES, DRUG_METABOLISM_CYTOCHROME_P450, FATTY_ACID_METABOLISM, METABOLISM_OF_XENOBIOTICS_BY_CYTOCHROME_P450” pathways were enriched in the down-regulated RAD51AP1 subgroup ().
Figure 6 (A and B) The KEGG and GO function enrichment signaling pathways of the high- and low-RAD51AP1 expression subgroups in GSEA analysis based on the TCGA-HCC cohort.
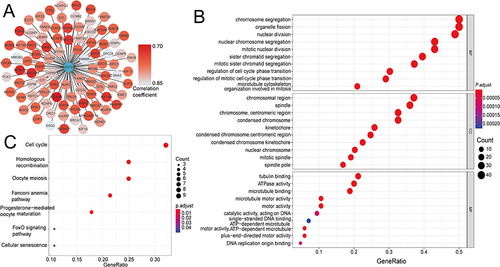
The results of genome-wide correlation analysis showed that 92 genes were significantly relevant to RAD51AP1 in the TCGA-HCC cohort. All these genes, the absolute correlation coefficient values of which were all greater than 0.7, were positively correlated with RAD51AP1 expression (). By the GSEA analysis on these correlated genes, the RAD51AP1-associated HCC hallmarks, including regulation of cell cycle, cell cycle-phase transition, nuclear chromosome, tubulin binding, cellular senescence, FoxO signaling pathways, were identified ( and ).
Figure 7 (A) Regulatory network of RAD51AP1 gene containing its co-expressed genes in the TCGA-HCC cohort. (B and C) The bubble diagrams displaying the significant GO and KEGG function enrichment signaling pathways of RAD51AP1 and its co-expressed genes.
Correlation Between RAD51AP1 and the Immune Infiltration of Tumor Microenvironment in HCC
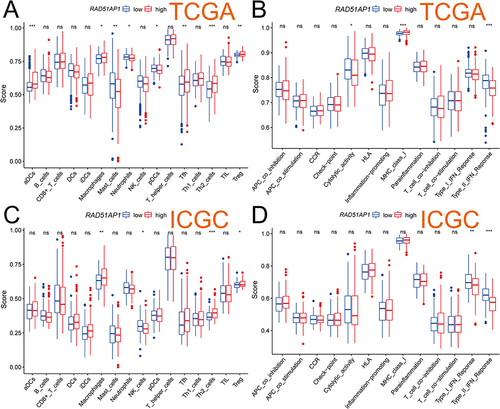
CIBERSORT analysis revealed higher T cells follicular helper but lower T cells CD4+ memory resting significantly infiltrated in the high-RAD51AP1 expression subgroup (P < 0.05; ). In line with the above results, a correlation heatmap displayed the positive and negative connections of RAD51AP1 expression and different immunizing cells ( and Supplementary Table 2). In TIMER2, RAD51AP1 expression negatively correlated to the infiltration levels of T cells CD4+ memory resting, but positively correlated to B cell memory, cell CD4+ T memory activated and Myeloid dendritic cell activated (Supplementary Figure 1). The ssGSEA analysis showed that the up-regulated RAD51AP1 expression exhibited the higher macrophages, Th2 and Treg cells infiltration levels but lower immune function of type II IFN response in both TCGA and ICGC cohort (P < 0.05; ).
Figure 8 (A) The percentages of 22 immune cell infiltration profiles based on CIBERSORT analysis were compared between the high- and low-RAD51AP1 expression subgroups. (B) The correlation heatmap displaying the correlation between RAD51AP1 expression and various immunocyte levels. *P < 0.05; **P < 0.01.
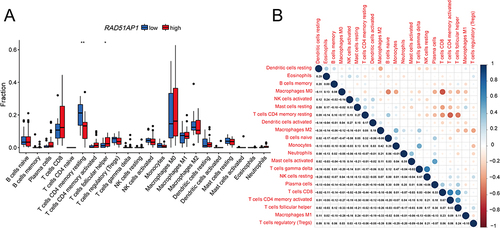
Figure 9 The results of ssGSEA analysis demonstrated the differences of the infiltration levels of immune cells and the relative expression activities of various function pathways between the high- and low-RAD51AP1 expression groups in the TCGA (A and B) and ICGC (C and D) cohorts. ns, No significance, *P < 0.05; **P < 0.01; and ***P < 0.001.
Predictive Value of Therapeutic Efficacy in HCC
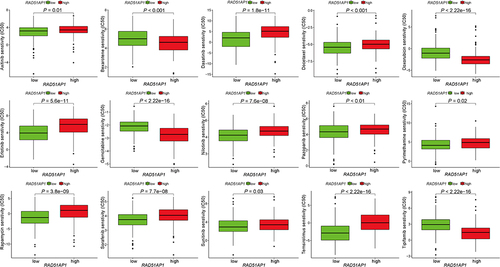
Based on gene expression profiling in TCGA-HCC dataset, the up-regulated expression levels of immune-related checkpoint genes, including CD44, HAVCR2, LGALS9, PDCD1, TNFRSF4, TNFRSF14, TNFRSF18, CD27, CD48, CD40, IDO1 and LAG3, were uncovered in the high-RAD51AP1 expression subgroup (). Moreover, RAD51AP1 expression was negatively related to stromal score (R = −0.20, P < 0.001, ), ESTIMATE score (R = −0.13, P < 0.05, ). However, the correlations of RAD51AP1 and immune score or TMB were statistically insignificant ( and ). The predictive findings based on operational simulation in drug sensitivity analysis showed that eight medications (Sorafenib, Nilotinib, Axitinib, Erlotinib, Dasatinib, Docetaxel, Pazopanib, Pyrimethamine, Rapamycin, Sunitinib and Temsirolimus) displayed higher IC50s in the high-RAD51AP1 expression subgroup, whereas Bexarotene, Doxorubicin, Gemcitabine and Tipifarnib had lower IC50s, which suggested that the HCC patients with high-RAD51AP1 expression may be more susceptible to the treatment Bexarotene, Doxorubicin, Gemcitabine and Tipifarnib (all P < 0.05, ).
Figure 10 (A) The heatmap illustrating the significantly differential expression immune-related checkpoint genes between the high- and low-RAD51AP1 expression groups based on the TCGA-HCC database. (B–E) Spearman analysis of RAD51AP1 expression level and TMB (B), stromal score (C), immune score (D) and ESTIMATE score (E).
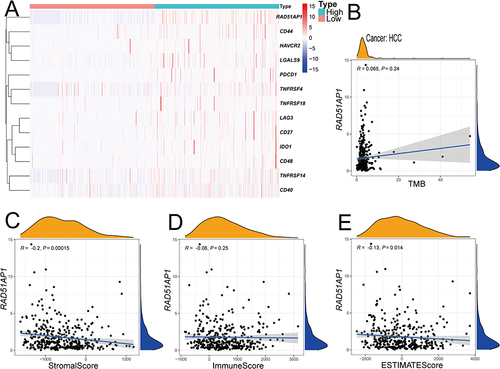
Figure 11 Based on R package “pRRophetic” and the gene expression profile of the TCGA-HCC dataset, the predicted IC50 values of anti-HCC therapies, including chemotherapeutic and molecular targeted drugs, in the high- and low-RAD51AP1 expression groups were determined and then compared.
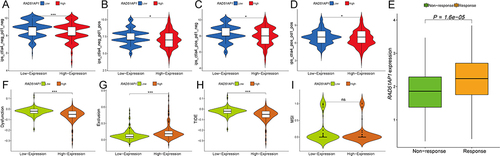
Violin plots showed the high-RAD51AP1 expression subgroup exhibited relatively lower IPSs, representing a possibly dismal reaction to immunotherapy of PD-1 and CTLA-4 inhibitors (P < 0.05; ). Moreover, the subgroup with higher TIDE score represents immunotherapy non-responders whose suppressive cells in the immune microenvironment inhibit the infiltration of T cells. We observed that the high-RAD51AP1 expression subgroup had markedly lower TIDE and immune dysfunction scores but higher immune exclusion scores than those of low expression subgroup (P < 0.001, 12F-I). Furthermore, the responders in the IMvigor210 dataset had significantly the higher RAD51AP1 expression levels, which demonstrated that RAD51AP1 could reliably predict the therapeutic response of immunotherapy not just for HCC but for other cancer types as well.
Figure 12 (A–D) Violin plots showed the different levels of IPSs between the different RAD51AP1 expression groups. (E) Differential RAD51AP1 expression level between non-response and response groups was demonstrated in IMvigor210 dataset. (F–I) Immune dysfunction, immune exclusion, TIDE, and MSI scores were compared between the high- and low-RAD51AP1 expression groups. *P < 0.05; ***P < 0.001.
Discussion
Genetic alteration is a hallmark characteristic of hominine solid tumorsCitation32 and can greatly affect the formation and progression of HCC.Citation33 DNA damage can activate DNA damage repair system, which increases the risk of DNA modifications and genome defection.Citation34 Homologous recombination DNA repair (HR), especially operating in double-strand DNA breaks,Citation35 is identified as an efficient repair mechanism.Citation36 RAD51 recombinase can catalyze HRCitation37 and form a nucleoprotein filament to promote HR DNA repair.Citation38 RAD51AP1 acts as a necessary protein to activate RAD51 recombinase.Citation39 Thus, RAD51AP1 functions to keep genomic integrity via RAD51 recombinase enhancement.Citation40 Furthermore, Gonzalez et al showed that RAD51AP1 functions to maintain telomere length and protect against the proliferation of alternative lengthening of telomeres in cancer cells.Citation41 It is worth mentioning that Wu et al demonstrated an up-regulated RAD51AP1 in non-small cell lung cancer (NSCLC). In addition, the metastasis, proliferation, invasion, and migration of NSCLC cell line were inhibited under circumstance of RAD51AP1 silencing.Citation15 Obama et al showed that downregulation of RAD51AP1 retarded growth of intrahepatic cholangiocarcinoma cells.Citation16 Likewise, RAD51AP1 knockout experiments showed that RAD51AP1 knockout in human breast cancer cells and syngeneic mouse models reduced tumor growth and metastasis by increasing breast cancer stem cell self-renewal.Citation42 A mouse model experiment using U87MG cells revealed that knocking-down RAD51AP1 inhibited glioma.Citation43
In our study, the upregulated RAD51AP1 expression was related to shorter OS and RFS, histologic grade, TNM stage, T staging and vascular invasion degree and higher serum AFP level and was involved in cancer-promoting pathways in HCC, indicating that RAD51AP1 represents increased malignancy and poor prognosis. Immune checkpoint inhibitors (ICIs) and molecularly targeted therapy have achieved a remarkable survival benefit to the HCC managements.Citation6,Citation44,Citation45 HCC has a high tumor heterogeneity and different molecule characteristics.Citation46,Citation47 Tumor associated macrophages (TAMs), contributing to tumor growth and progression, are the essential elements of tumor microenvironment.Citation48 RAD51AP1 was demonstrated to regulate colorectal cancer stem cell self-renewal and promote colorectal cancer growth and drug resistance.Citation49 We demonstrated that RAD51AP1 may be associated with an immunosuppressive microenvironment with higher TAMs infiltration in HCC. Interestingly, the high RAD51AP1 expression may suggest a better immunotherapy response and could be more susceptible to Bexarotene, Doxorubicin, Gemcitabine and Tipifarnib. Collectively, RAD51AP1 may be a potential molecular therapeutic target. The dominating analyses were bioinformatics research based on the public datasets. Therefore, immunohistochemistry is urgently needed to confirm the RAD51AP1 protein expression level in HCC tissue. To decipher the molecular mechanism, the impact on HCC immune infiltration, and therapeutic sensitivity of RAD51AP1 still requires further validated researches in vitro and in vivo.
Conclusions
Taken together, RAD51AP1 mediating the immunosuppressive microenvironment is a potential diagnostic and prognostic biomarker and could be an underlying therapeutic target for HCC. However, this conclusion still requires further validations form additional cohorts.
Data Sharing Statement
All raw online RNA sequencing dataset and clinical information of HCC patients, which were included in the current study, can be downloaded from the TCGA (https://portal.gdc.cancer.gov/), ICGC (http://dcc.icgc.org), and GEO database (https://www.ncbi.nlm.nih.gov/geo/). Further inquiries can be directed to the corresponding author.
Ethics Statement
This experiment was authorized by the Ethical Review Committee of the First Affiliated Hospital of Guangxi Medical University [Approval Number: 2021 (KY-E-032)]. Written informed consent was agreed and signed by all HCC patients. This trial was conducted in accordance with the ethical principles in the Declaration of Helsinki.
Author Contributions
All authors made a significant contribution to the work reported, whether that is in the conception, study design, execution, acquisition of data, analysis and interpretation, or in all these areas; took part in drafting, revising or critically reviewing the article; gave final approval of the version to be published; have agreed on the journal to which the article has been submitted; and agree to be accountable for all aspects of the work. Yongguang Wei and Chenlu Lan should be regarded as co-first authors.
Disclosure
The authors declare that they have no conflict of interest.
Acknowledgments
Firstly, the authors would like to thank TCGA, GEO and ICGC projects for data sharing. Second, I would like to express my gratitude to the authors of this article and thank them for their help and dedication from the end. Finally, the authors would like to thank all the staff in the editorial department, and thanks for all your valuable comments.
Additional information
Funding
References
- Bray F, Ferlay J, Soerjomataram I, Siegel RL, Torre LA, Jemal A. Global cancer statistics 2018: GLOBOCAN estimates of incidence and mortality worldwide for 36 cancers in 185 countries. CA Cancer J Clin. 2018;68(6):394–424. doi:10.3322/caac.21492
- Rahib L, Smith BD, Aizenberg R, Rosenzweig AB, Fleshman JM, Matrisian LM. Projecting cancer incidence and deaths to 2030: the unexpected burden of thyroid, liver, and pancreas cancers in the United States. Cancer Res. 2014;74(11):2913–2921. doi:10.1158/0008-5472.CAN-14-0155
- Forner A, Reig ME, de Lope CR, Bruix J. Current strategy for staging and treatment: the BCLC update and future prospects. Semin Liver Dis. 2010;30(1):61–74. doi:10.1055/s-0030-1247133
- European Association for the Study of the Liver. Electronic address eee, European Association for the study of the L. EASL clinical practice guidelines: management of hepatocellular carcinoma. J Hepatol. 2018;69(1):182–236. doi:10.1016/j.jhep.2018.03.019
- Sengupta S, Parikh ND. Biomarker development for hepatocellular carcinoma early detection: current and future perspectives. Hepat Oncol. 2017;4(4):111–122. doi:10.2217/hep-2017-0019
- Rimassa L, Santoro A. Sorafenib therapy in advanced hepatocellular carcinoma: the SHARP trial. Expert Rev Anticancer Ther. 2009;9(6):739–745. doi:10.1586/era.09.41
- Bartkova J, Horejsi Z, Koed K, et al. DNA damage response as a candidate anti-cancer barrier in early human tumorigenesis. Nature. 2005;434(7035):864–870. doi:10.1038/nature03482
- Donne R, Saroul-Ainama M, Cordier P, et al. Replication stress triggered by nucleotide pool imbalance drives DNA damage and cGAS-STING pathway activation in NAFLD. Developmental Cell. 2022;57(14):1728–1741.e1726. doi:10.1016/j.devcel.2022.06.003
- Ahodantin J, Bou-Nader M, Cordier C, et al. Hepatitis B virus X protein promotes DNA damage propagation through disruption of liver polyploidization and enhances hepatocellular carcinoma initiation. Oncogene. 2019;38(14):2645–2657. doi:10.1038/s41388-018-0607-3
- Kovalenko OV, Golub EI, Bray-Ward P, Ward DC, Radding CM. A novel nucleic acid-binding protein that interacts with human rad51 recombinase. Nucleic Acids Res. 1997;25(24):4946–4953. doi:10.1093/nar/25.24.4946
- Mizuta R, LaSalle JM, Cheng HL, et al. RAB22 and RAB163/mouse BRCA2: proteins that specifically interact with the RAD51 protein. Proc Natl Acad Sci USA. 1997;94(13):6927–6932. doi:10.1073/pnas.94.13.6927
- Modesti M, Budzowska M, Baldeyron C, Demmers JA, Ghirlando R, Kanaar R. RAD51AP1 is a structure-specific DNA binding protein that stimulates joint molecule formation during RAD51-mediated homologous recombination. Mol Cell. 2007;28(3):468–481. doi:10.1016/j.molcel.2007.08.025
- Zhao H, Gao Y, Chen Q, et al. RAD51AP1 promotes progression of ovarian cancer via TGF-β/Smad signalling pathway. J Cell Mol Med. 2021;25(4):1927–1938. doi:10.1111/jcmm.15877
- Zheng L, Li L, Xie J, Jin H, Zhu N. Six novel biomarkers for diagnosis and prognosis of esophageal squamous cell carcinoma: validated by scRNA-seq and qPCR. J Cancer. 2021;12(3):899–911. doi:10.7150/jca.50443
- Wu Y, Wang H, Qiao L, Jin X, Dong H, Wang Y. Silencing of RAD51AP1 suppresses epithelial-mesenchymal transition and metastasis in non-small cell lung cancer. Thorac Cancer. 2019;10(9):1748–1763. doi:10.1111/1759-7714.13124
- Obama K, Satoh S, Hamamoto R, Sakai Y, Nakamura Y, Furukawa Y. Enhanced expression of RAD51 associating protein-1 is involved in the growth of intrahepatic cholangiocarcinoma cells. Clin Cancer Res. 2008;14(5):1333–1339. doi:10.1158/1078-0432.CCR-07-1381
- Xie S, Jiang X, Zhang J, et al. Identification of significant gene and pathways involved in HBV-related hepatocellular carcinoma by bioinformatics analysis. PeerJ. 2019;7:e7408. doi:10.7717/peerj.7408
- Zhuang L, Zhang Y, Meng Z, Yang Z. Oncogenic roles of RAD51AP1 in tumor tissues related to overall survival and disease-free survival in hepatocellular carcinoma. Cancer Control. 2020;27(1):1073274820977149. doi:10.1177/1073274820977149
- Wickham HCW, Henry L, Pedersen T, et al. ggplot2: create elegant data visualisations using the grammar of graphics. R package version 3.4.3; 2023. Available from: https://CRAN.R-project.org/package=ggplot2. Accessed September 22, 2023.
- FEHJ. RMS: regression modeling strategies. R package version 6.7-0; 2023. Available from: https://CRAN.R-project.org/package=rms. Accessed September 22, 2023.
- TMT. Survival: survival analysis. R package version 3.5-7; 2023. Available from: https://CRAN.R-project.org/package=survival. Accessed September 22, 2023.
- Subramanian A, Kuehn H, Gould J, Tamayo P, Mesirov JP. GSEA-P: a desktop application for gene set enrichment analysis. Bioinformatics. 2007;23(23):3251–3253. doi:10.1093/bioinformatics/btm369
- Yu G, Wang L-G, Han Y, He Q-Y. clusterProfiler: an R package for comparing biological themes among gene clusters. OMICS J Integr Biol. 2012;16(5):284–287. doi:10.1089/omi.2011.0118
- Newman AM, Liu CL, Green MR, et al. Robust enumeration of cell subsets from tissue expression profiles. Nat Meth. 2015;12(5):453–457. doi:10.1038/nmeth.3337
- Li T, Fu J, Zeng Z, et al. TIMER2.0 for analysis of tumor-infiltrating immune cells. Nucl Acids Res. 2020;48(W1):W509–w514. doi:10.1093/nar/gkaa407
- Hänzelmann S, Castelo R, Guinney J. GSVA: gene set variation analysis for microarray and RNA-seq data. BMC Bioinform. 2013;14:7. doi:10.1186/1471-2105-14-7
- Yoshihara K, Shahmoradgoli M, Martínez E, et al. Inferring tumour purity and stromal and immune cell admixture from expression data. Nat Commun. 2013;4:2612. doi:10.1038/ncomms3612
- Geeleher P, Cox N, Huang RS. pRRophetic: an R package for prediction of clinical chemotherapeutic response from tumor gene expression levels. PLoS One. 2014;9(9):e107468. doi:10.1371/journal.pone.0107468
- Charoentong P, Finotello F, Angelova M, et al. Pan-cancer immunogenomic analyses reveal genotype-immunophenotype relationships and predictors of response to checkpoint blockade. Cell Rep. 2017;18(1):248–262. doi:10.1016/j.celrep.2016.12.019
- Wang X, Liao X, Yu T, et al. Analysis of clinical significance and prospective molecular mechanism of main elements of the JAK/STAT pathway in hepatocellular carcinoma. Int J Oncol. 2019;55(4):805–822. doi:10.3892/ijo.2019.4862
- Livak KJ, Schmittgen TD. Analysis of relative gene expression data using real-time quantitative PCR and the 2 (-Delta Delta C(T)) method. Methods. 2001;25(4):402–408. doi:10.1006/meth.2001.1262
- Beroukhim R, Mermel CH, Porter D, et al. The landscape of somatic copy-number alteration across human cancers. Nature. 2010;463(7283):899–905. doi:10.1038/nature08822
- Rao CV, Asch AS, Yamada HY. Frequently mutated genes/pathways and genomic instability as prevention targets in liver cancer. Carcinogenesis. 2017;38(1):2–11. doi:10.1093/carcin/bgw118
- Chatterjee N, Walker GC. Mechanisms of DNA damage, repair, and mutagenesis. Environ Mol Mutagen. 2017;58(5):235–263. doi:10.1002/em.22087
- Wright WD, Shah SS, Heyer WD. Homologous recombination and the repair of DNA double-strand breaks. J Biol Chem. 2018;293(27):10524–10535. doi:10.1074/jbc.TM118.000372
- Li X, Heyer WD. Homologous recombination in DNA repair and DNA damage tolerance. Cell Res. 2008;18(1):99–113. doi:10.1038/cr.2008.1
- Richardson C. RAD51, genomic stability, and tumorigenesis. Cancer Lett. 2005;218(2):127–139. doi:10.1016/j.canlet.2004.08.009
- Moynahan ME, Jasin M. Mitotic homologous recombination maintains genomic stability and suppresses tumorigenesis. Nat Rev Mol Cell Biol. 2010;11(3):196–207. doi:10.1038/nrm2851
- Pires E, Sung P, Wiese C. Role of RAD51AP1 in homologous recombination DNA repair and carcinogenesis. DNA Repair. 2017;59:76–81. doi:10.1016/j.dnarep.2017.09.008
- Wiese C, Dray E, Groesser T, et al. Promotion of homologous recombination and genomic stability by RAD51AP1 via RAD51 recombinase enhancement. Mol Cell. 2007;28(3):482–490. doi:10.1016/j.molcel.2007.08.027
- Barroso-Gonzalez J, Garcia-Exposito L, Hoang SM, et al. RAD51AP1 is an essential mediator of alternative lengthening of telomeres. Mol Cell. 2020;79(2):359. doi:10.1016/j.molcel.2020.06.026
- Bridges AE, Ramachandran S, Pathania R, et al. RAD51AP1 deficiency reduces tumor growth by targeting stem cell self-renewal. Cancer Res. 2020;80(18):3855–3866. doi:10.1158/0008-5472.CAN-19-3713
- Wang Q, Tan Y, Fang C, et al. Single-cell RNA-seq reveals RAD51AP1 as a potent mediator of EGFRvIII in human glioblastomas. Aging. 2019;11(18):7707–7722. doi:10.18632/aging.102282
- Xu J, Shen J, Gu S, et al. Camrelizumab in combination with apatinib in patients with advanced hepatocellular carcinoma (RESCUE): a nonrandomized, open-label, phase II trial. Clin Cancer Res. 2021;27(4):1003–1011. doi:10.1158/1078-0432.Ccr-20-2571
- Llovet JM, Castet F, Heikenwalder M, et al. Immunotherapies for hepatocellular carcinoma. Nat Rev Clin Oncol. 2022;19(3):151–172. doi:10.1038/s41571-021-00573-2
- Morad G, Helmink BA, Sharma P, Wargo JA. Hallmarks of response, resistance, and toxicity to immune checkpoint blockade. Cell. 2021;184(21):5309–5337. doi:10.1016/j.cell.2021.09.020
- Ding L, Zhang E, Yang Q, et al. Vertical sleeve gastrectomy confers metabolic improvements by reducing intestinal bile acids and lipid absorption in mice. Proceed Nat Acad Sci Unit State Am. 2021;118:6. doi:10.1073/pnas.2019388118
- Li C, Xu X, Wei S, Jiang P, Xue L, Wang J. Tumor-associated macrophages: potential therapeutic strategies and future prospects in cancer. J Immunother Cancer. 2021;9(1):e001341. doi:10.1136/jitc-2020-001341
- Bridges AE, Ramachandran S, Tamizhmani K, et al. RAD51AP1 loss attenuates colorectal cancer stem cell renewal and sensitizes to chemotherapy. Mol Cancer Res. 2021;19(9):1486–1497. doi:10.1158/1541-7786.Mcr-20-0780