
Abstract
Purpose
Hepatocellular carcinoma (HCC) ranks as the third leading cause of cancer-related deaths, posing a significant threat to people in diverse regions. T-cell exhaustion (Tex) can hinder the efficacy of immunotherapy in patients with HCC, and the transcription factors that regulate Tex in HCC have not yet been fully elucidated.
Patients and Methods
We used the single sample gene set enrichment analysis (ssGSEA) method to define the transcription factor pathway that regulates Tex and employed LASSO regression analysis to establish Tex related genes (TEXRS). To predict differences in immunotherapy efficacy between the two groups, we used the immunophenotype score and submap algorithm. RT-qPCR was used to detect the expression levels of the model genes in 21 pairs of HCC tissues. Finally, we assessed the cell communication strength and identified ligand receptors using the “CellChat” R package.
Results
Nine Tex transcription factors were identified as regulators of the HCC immune microenvironment, with Tex scores affecting patient survival. Patients with a high Tex Risk Score (TEXRS) had significantly worse overall survival compared to patients with low TEXRS. After adjusting for confounding factors, TEXRS remained an independent prognostic factor. Importantly, TEXRS performed well in multiple independent external validation cohorts. Various algorithms have shown that patients in the low-TEXRS group might benefit more from immunotherapy. Finally, RT-qPCR analysis of 21 HCC samples showed that C7, CD5L, and SDS were significantly downregulated in HCC tissues, consistent with the bioinformatics analysis results.
Conclusion
TEXRS proved to be a valuable predictor of immunotherapy and transcatheter arterial chemoembolization efficacy in patients with HCC. This holds promise for enhancing the prognosis and treatment outcomes of patients with HCC.
Introduction
Hepatocellular carcinoma (HCC), the most common form of liver cancer, ranks as the third leading cause of cancer-related death worldwide and is a major challenge to human health.Citation1,Citation2 Chronic liver diseases, such as chronic viral hepatitis, alcoholic steatohepatitis, and non-alcoholic steatohepatitis, are well-established predisposing factors for HCC.Citation3–6 Given the substantial individual heterogeneity and poor prognosis of HCC, the search for novel and dependable biomarkers remains an urgent imperative.
Early-stage HCC can be treated surgically. Unfortunately, most patients with diagnosed with HCC have advanced-stage disease, necessitating treatments like chemotherapy, radiotherapy, immunotherapy, transcatheter arterial chemoembolization (TACE), and radiofrequency ablation.Citation7 Thanks to the rapid development of immunotherapy, the treatment of advanced HCC has taken a significant leap forward, significant antitumor effects can be observed by receiving immune checkpoint-blocking drugs.Citation8–13 Studies have demonstrated that the use of immune checkpoint inhibitors can markedly increase the chances of complete remission in patients.Citation14,Citation15 However, owing to the intricacies of the immune microenvironment, not all patients experience a favorable response to on immune checkpoint-blockade (ICB) therapy.Citation16–18 The tumor immune microenvironment (TIME) plays a pivotal role in the occurrence and progression of HCC.Citation19 Simultaneously, the immunosuppressive status of TIME is intricately linked to the efficacy of immunotherapy in patients with HCC.Citation20,Citation21
T-cells are the primary defenders of the immune system, playing a crucial role in combating diseases such as pathogenic infections and tumors. In chronic diseases, continuous exposure to antigens can lead to their loss of effector function, resulting in the inability to clear pathogens or tumors, a state known as T-cell exhaustion (Tex).Citation22,Citation23 Tex is usually characterized by a progressive loss of effector function, persistent upregulation of inhibitory receptors, and changes in the expression and function of key transcription factors.Citation22,Citation24 Studies have shown that HCC tissues exhibit the highest proportion of exhausted CD8+T-cells, and may be transformed from other types of CD8+T-cells within the tumor.Citation25 Although some scholars have conducted related studies on Tex and HCC, there is still a lack of research on the regulation of Tex transcription factors and HCC.Citation26,Citation27 Transcription factors regulating Tex have been gradually discovered, such as IRF4, BATF, NFATc1, NR4A, TBX21, EOMES and TOX.Citation28–30
IRF4 is a T-cell receptor (TCR) signal-sensitive transcription factor that interacts with BATF and NFAT to promote PDCD1 transcription. It is involved in multiple aspects of Tex, including inhibitory receptor expression, impaired cytokine secretion, and anabolic inhibition.Citation31 When IRF4 expression decreased, the overall anabolic level increased and IFN-γ secretion partially recovered.Citation31 NFAT is an important transcription factor for TCR-activated T-cells and interacts with AP-1 transcription factors to form a synergistic NFAT: AP-1 complex, which is essential for inducing cytokine genes and other activation- related genes.Citation32 In addition to being involved in T-cell activation, NFAT is also a transcription factor necessary for immune checkpoint molecular expression, where NFAT does not bind AP-1.Citation32 BATF is involved in the regulation of effector T-cell differentiation, and studies have found that PD-1 can inhibit T-cell function by up-regulating BATF, and that BATF and IRF4 together protect CAR-T from exhaustion.Citation33 The NR4A family, which includes transcription factors NR4A1, NR4A2, and NR4A3, are involved in the development of Tex. Even in the absence of its partner AP-1, a member of the NR4A family acts as a target for calcium/calcineurin to regulate the transcription factor NFAT, inducing inhibitory receptor expression after activation and inhibiting effector molecule expression.Citation34 T-bet and EOMES function differently in exhausted T-cells than in memory T-cells.Citation35 Tex is a heterogeneous population, and the severity of exhaustion is associated with EOMES expression, suggesting that high EOMES expression may positively modulate exhaustion. In addition, although T-bet and EOMES play opposite roles in Tex, most exhausted T-cells co-express these two transcription factors.Citation35 Deletion of the transcription factor TOX specifically leads to the downregulation of PD1 expression and increased expression of cytotoxic effector molecules, suggesting that exhaustion programs are severely inhibited. TOX drives genetic programs during the initiation and maintenance of Tex. In tumor samples, TOX is required for the expression of inhibitory receptors. For example, in tumor-infiltrating lymphocytes of patients with melanoma, the expression of immune checkpoints was positively correlated with TOX expression.Citation36 TOX knockout mice showed a decrease in the expression of immune checkpoint molecules and an increase in the expression of effector molecules.Citation36 Owing to the lack of effective prognostic models for HCC, it may be of great significance to stratify patients with HCC and establish prognostic models from the perspective of regulating Tex transcription factors and HCC to further predict therapeutic effects in these patients.
With great progress in high-throughput sequencing, single-cell RNA sequencing (scRNA-seq) and Bulk RNA-seq have played important roles in revealing changes at the cellular molecular level of diseases and discovering new biomarkers related to diseases. In addition, bioinformatics analyses can be performed using scRNA-seq or Bulk RNA-seq. For example, Yuan et al identified Tex-related genes through bioinformatics technology, combined with machine learning algorithms, and constructed a feature that could accurately predict the prognosis of patients with ovarian cancer.Citation37 Chen et al discovered that LSM4 can serve as a promising diagnostic and prognostic biomarker for HCC by mining multiple databases and found that ABCC5 is associated with poor prognosis and immune infiltration in HCC.Citation38,Citation39 Through data mining, Zhang et al found that M7G-related genes can not only be used as diagnostic markers for chronic hepatitis B, but also participate in the regulation of immune microenvironment and play an important role in the progression of chronic hepatitis B.Citation40 Therefore, multi-omics combined analysis has great development potential and application value.
In this study, we combined scRNA-seq with Bulk RNA-seq analysis to identify differentially expressed genes (DEGs) in patients with different transcription factors regulating Tex. A prognostic model was established and validated using internal and independent external tests. In addition, multiple omics and algorithms were used to predict therapeutic effects in patients with HCC. Finally, based on the basic experiment, bioinformatics analysis was verified. Various analytical techniques were used to construct prognostic features based on the regulatory Tex transcription factor DEGs with the aim of elucidating the relationship between the regulatory process of Tex and the prognostic progression and therapeutic effects of HCC.
Materials and Methods
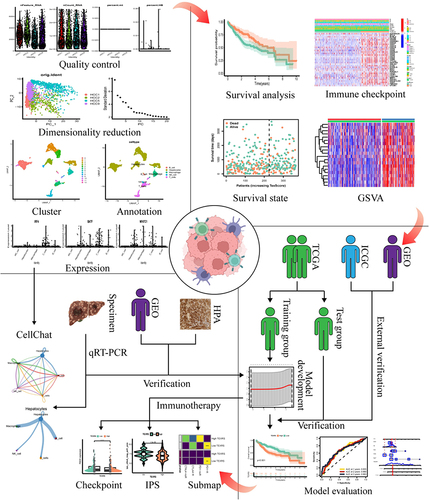
shows the study process.
Figure 1 Flow chart. Created with Biorender.com.
Participants
In this study, 21 pairs of HCC and paracancerous tissue specimens were collected from the Second Affiliated Hospital of Harbin Medical University between June 2021 and June 2023. All HCC specimens were confirmed by pathologists and the study was approved by the Medical Ethics Committee of the Second Affiliated Hospital of Harbin Medical University. Written informed consent was obtained from each patient before the start of the study. The patients’ clinical information is shown in .
Table 1 Clinical Information of HCC Patients
Public Data Source
scRNA-seq dataset (GSE146115), RNA-seq datasets (GSE77314, GSE124535, GSE135631, GSE202069, and GSE214846), and microarray datasets (GSE14520, GSE76427, GSE36376, GSE45436, GSE17856, GSE25097, GSE39791, GSE54236, GSE57957, GSE64041, GSE76427, GSE84005, GSE84402, GSE121248, GSE46444, GSE47197, GSE62232, and GSE104580) of HCC were downloaded from Gene Expression Omnibus (GEO, https://www.ncbi.nlm.nih.gov/geo/) database. Microarray data (E-TABM-36) were obtained from the European Bioinformatics Institute (EBI) ArrayExpress (https://www.ebi.ac.uk/biostudies/arrayexpress) database, while HCC RNA-seq and clinical information were downloaded from The Cancer Genome Atlas (TCGA, https://portal.gdc.cancer.gov) and International Cancer Genome Consortium (ICGC, https://daco.icgc.org/) databases. Patients with zero follow-up were excluded to ensure the accuracy of the study. Nine Tex transcription factors were obtained from the literature.Citation28–30
scRNA-Seq Data Analysis
First, through the “Seurat” R package, for gene filtering, genes expressed in less than three cells were removed; for cell filtering, cells with less than 300 features were detected and culled to create a SeuratObject. Next, the percentage of mitochondrial and red blood cell (RBC) genes were calculated, and the rules for screening cells were as follows: (1) the number of feature genes was between 200 and 7500, (2) the mitochondrial RNA content was less than 10%, (3) the RBC RNA content was less than 3%, and (4) the total number of cells was less than 300,000. After quality control, 2583 cells were retained for subsequent analyses. Figures S1A and B show the information before and after quality control, respectively.
The gene expression of each cell was normalized to 10,000 and logarithmically processed, and 3000 highly variable genes were selected for further analysis (Figure S1C). Seurat objects were scaled, principal component analysis (PCA) was performed, and the first 15 principal components (PCs) were applied to UMAP (Figure S1D and E). Using the clustering algorithm based on shared nearest neighbor (SNN), 0.5 was selected as the threshold to evaluate the number of cell clusters, and all cells were divided into 13 highly different subpopulations. Cell annotation is determined by the “singleR” R package. To solve the problem of sequencing depth, we used the Tumor Immune Single-Cell Hub 2 (TISCH2, http://tisch.comp-genomics.org/home/) database to analyze GSE140228 Smartseq2 and further analyze the transcriptome of immune cells.
Define Tex Transcription Factor Pathway Activity
Single sample gene set enrichment analysis (ssGSEA) can be achieved by defining an enrichment score that represents the absolute degree of enrichment of the gene set in each sample within a given dataset.Citation41 Using this approach, the activity of the Tex transcription factor pathway was defined by enrichment scores and named TexScore.
Gene Set Variation Analysis
Gene set variation analysis (GSVA) was converted from the gene expression data matrix to the corresponding gene set expression data matrix to analyze the pathway activity. Using |logFC| > 0.1 and an adjusted P value < 0.05 as filtering conditions, the gene set file was downloaded from the Molecular Signatures Database (MSigDB, https://www.gsea-msigdb.org/gsea/msigdb) to run GSVA.
Difference Analysis
In order to further analyze the reasons for the difference in TexScore between the two groups, we identified DEGs between the two groups with |logFC| > 1 and FDR < 0.05 as screening conditions.
Model Development
The DEGs shared among the four cohorts are shown using an upset plot. Next, the TCGA cohort was randomly divided into training and test groups in a ratio of 7:3. Basic information regarding the patients in the two groups is shown in . Cox regression analysis was performed in the training group to obtain prognostic DEGs, and the Tex Risk Score (TEXRS) was established using LASSO regression analysis. The formula used is as follows:
Table 2 Clinical Information for Training and Test Groups
Patients in the training and test groups were divided into high and low-TEXRS groups according to the median TEXRS score. Kaplan-Meier curves were used to evaluate the relationship between high and low-TEXRS scores and patient survival. The predictive power of the TEXRS was evaluated using receiver operating characteristic (ROC) curves. Next, correlations and independent prognostic analyses were performed between the TEXRS and clinical information. Finally, a nomogram was established based on the TEXRS data and clinical information, and the nomogram was evaluated using ROC and calibration curves.
External Verification
To demonstrate the applicability of TEXRS, we used the ICGC as an external validation group, performed the same procedures, and used the same R packages as the training and test groups, such as the Kaplan-Meier curve, ROC curve, correlation analysis with clinical information, independent prognostic analysis, and the establishment of a nomogram. In addition, Kaplan-Meier analysis was performed on the GSE14520, GSE76427, and E-TABM-36 datasets.
External Verification
First, the immune, stromal, ESTIMATE, and tumor purity scores were calculated using the ESTIMATE method. CIBERSORT software was used to calculate the infiltration levels of immune cells.
Immunotherapy and TACE Prediction
To analyze the predictive effect of TEXRS on immunotherapy, an estimated ICIs immunotherapy response score was obtained from The Cancer Immunome Atlas database (TCIA, https://tcia.at/home). To further predict the response to TACE, the GSE104580 dataset, which contains microarray data for both TACE responders and non-responders, was used.
Differential Expression and Validation of Model Genes
To ensure model stability, the differential expression of C7, CD5L, and SDS was verified at the gene and protein levels. Validation was performed at the gene level from TCGA cohort, Gene Expression Profiling, and Integrative Analysis (GEPIA, http://gepia.cancer-pku.cn/), and multiple GEO datasets, while immunohistochemical images were downloaded from the Human Protein Atlas (HPA; https://www.proteinatlas.org/) database to verify protein levels.
RT-qPCR
Total RNA was collected from tissues by RNAkey™ Reagent (SM129-02, Sevenbio, Beijing, China). cDNA was generated using a synthetic kit (1119ES60, Yeasen, China) and RT-qPCR was performed using a real-time SYBR Green Master Mix kit (11184ES03, Yeasen, China). The primers used for qRT-PCR are listed in .
Table 3 Primer Sequence
Model Gene Analysis
The distribution and expression of model genes were analyzed using GSE146115 and GSE140228 Smartseq2. Thereafter, the correlations between the model genes and TEXRS and Tex transcription factors were mapped. Finally, a correlation plot of the RT-qPCR results was constructed.
Cell Communication Analysis
To explore the intensity of communication between various cells in HCC tissues and to identify the expression of ligand receptors, the “CellChat” R package was used for cell communication analysis.
Statistical Analysis
R software (version 4.3.0) was used for all statistical analyses. A nonparametric test was used for unpaired data, a paired nonparametric test was used for paired samples, and the Spearman test was used for correlation analysis. Statistical significance was set at P < 0.05 significant.
Results
scRNA-Seq Analysis
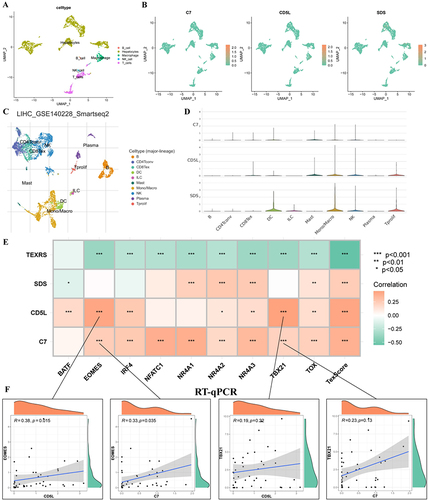
Thirteen distinct clusters were obtained through the SNN algorithm in the “Seurat” R package (). SingleR was employed for cell type annotation, the cells were divided into five cell types: hepatocytes, B cells, macrophages, NK cells, and T-cells (). The expression of nine transcription factors regulating Tex in each cell type is shown in and , with the majority of these factors predominantly expressed in T-cells.
Figure 2 scRNA-seq analysis. (A) GSE146115 data is clustered into 13 clusters; (B) GSE146115 data annotation for five cell types; (C) Regulation of the distribution of T cell exhaustion transcription factors in each cell type; (D) Regulate the expression of T cell exhaustion transcription factors in various cell types. scRNA-seq, single-cell RNA sequencing.
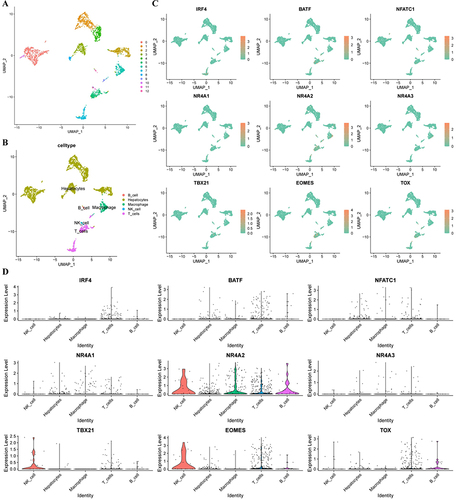
Owing to the low expression of transcription factors, we analyzed the GSE140228 Smartseq2 data using the TISCH2 tool. Nine transcription factors regulating Tex were expressed in the CD8Tex cells of HCC tissues (Figure S2). These results suggest that the nine Tex transcription factors may be involved in the regulation of the immune microenvironment in HCC.
Define Tex Transcription Factor Pathway Activity
First, to evaluate the overall role of Tex transcription factors, we calculated the Tex transcription factor enrichment scores using the ssGSEA method. Next, when the optimal cutoff value was 0.511, there was a significant difference in OS among patients in the high and low TexScore groups (). shows the relationship between TexScore and survival status in these patients; patients with a high TexScore had lower mortality. These results suggest that the Tex transcription factor pathway activity affects patient prognosis. A heatmap showed that immune checkpoint gene expression was upregulated in the high TexScore group ().
Figure 3 There are obvious differences between high and low TexScore. (A) Survival curve of high and low TexScore; (B) Distribution of TexScore and its relationship with survival state; (C) Expression of immune checkpoints of high and low TexScore; (D) GSVA of high and low TexScore. TexScore, T cell exhaustion score; GSVA, Gene set variation analysis.
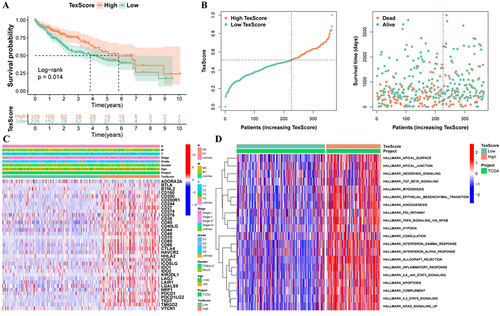
Difference Between High and Low TexScore Pathways
The GSVA algorithm was used to further analyze the biological differences between the two groups. There were significant differences in the inflammatory response, IL2 STAT5 signaling, and interferon-gamma response between the two groups, and the enrichment score of the low TexScore group was higher ().
Identification DEGs
Next, to find the reasons for the different biological differences between the two groups of patients, DEGs were identified using the “limma” R package with |logFC| > 1 and FDR < 0.05 as filter conditions.
Model Development
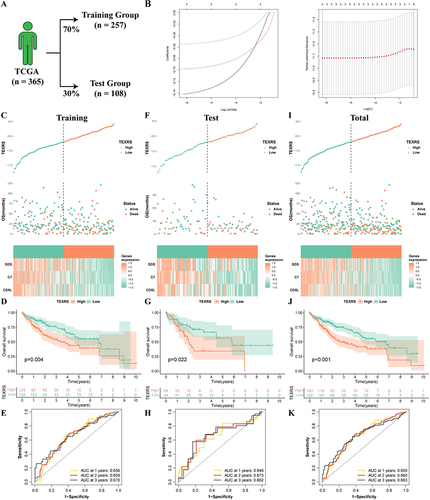
To ensure that the model could be validated using other validation cohorts, 29 genes were selected for subsequent analyses (Figure S3A). Subsequently, 70% of the patients in the TCGA cohort were randomized into the training group, and the remaining 30% were included in the internal validation group (). Univariate Cox regression analysis was performed on the training group to identify prognostic DEGs (Figure S3B). The TEXRS was established using LASSO regression analysis (). The formula of the model is: TEXRS = (−0.142×CD5L expression) + (−0.098×C7 expression) + (−0.055×SDS expression). The TCGA patients were divided into high and low-TEXRS groups according to the median TEXRS score of the training group. shows TEXRS distribution, survival status, and model gene expression in these patients. The OS of patients with high-TEXRS scores was significantly worse than that of patients with low-TEXRS scores (). ROC analysis showed that the forecasted OS AUC for years 1, 2, and 3 were 0.656, 0.659, and 0.670, respectively (). These results were consistent in both the test and control groups ().
Figure 4 Development of TEXRS. (A) The TCGA cohort was randomly divided into the training group and the test group at a ratio of 7:3; (B) Lasso regression analysis; (C–E) In the training group, TEXRS distribution, relationship with survival state, model gene expression, survival curve and ROC curve; (F–H) In the test group, TEXRS distribution, relationship with survival state, model gene expression, survival curve and ROC curve; (I–K) In the total group, TEXRS distribution, relationship with survival state, model gene expression, survival curve and ROC curve. TEXRS, T cell exhaustion risk score; ROC, receiver operating characteristic.
TEXRS and Clinical Characteristics Analysis
In the TCGA cohort, TEXRS was significantly higher in patients with death, G3-4, Stage III–IV, and T3-4 (). Furthermore, in the high-TEXRS group, a higher proportion of patients with death, G3-4, Stage III–IV, and T3-4 (). These results suggest that TEXRS could serve as a valuable prognostic indicator. Univariate Cox regression analysis showed that TEXRS was a significant risk factor (hazard ratio [HR] = 2.55, P <0.001) (). Furthermore, multivariate Cox regression analysis demonstrated that TEXRS remained an independent prognostic factor, even after accounting for confounding factors (hazard ratio [HR] = 1.919, P < 0.021) ().
Figure 5 Analysis of TEXRS and clinical characterizations. (A) Comparison of TEXRS among different clinical characterizations; (B) The proportion of different clinical characterizations of high and low TEXRS; (C) Univariate cox analysis of TEXRS and clinical features; (D) Multivariate cox analysis of TEXRS and clinical characterizations; (E) A nomogram of TEXRS and clinical characterizations; (F) ROC analysis of the nomogram; (G) Calibration curve of the nomogram. ***P < 0.001. ROC, receiver operating characteristic.
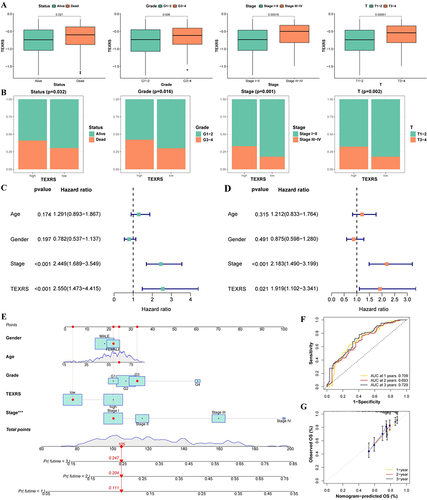
Therefore, we developed a nomogram by combining TEXRS scores with age, sex, G-grade, and Stage (). The ROC analysis results demonstrated that the model’s predictive ability was good (). Furthermore, the calibration curve illustrated that the model’s predictions closely matched the actual results ().
External Validation of TEXRS
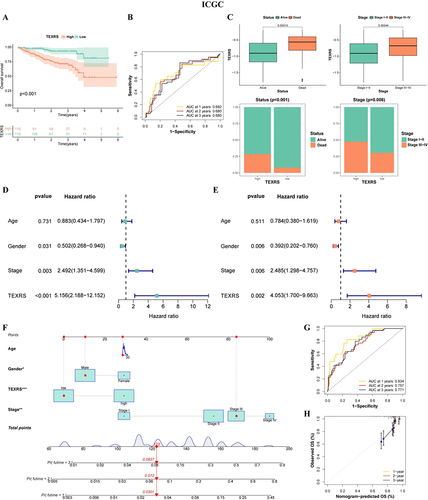
We performed the same procedure in the ICGC cohort as in the training group, and The OS of patients with high-TEXRS scores was significantly worse than that of patients with low-TEXRS scores (). ROC analysis showed that the AUC for predicted OS in years 1, 2, and 3 were 0.692, 0.680, and 0.680, respectively (). TEXRS was significantly higher in patients who died and in Stage III–IV; a higher proportion of patients died and in Stage III–IV in the high-TEXRS group (). TEXRS was also a risk factor (HR = 5.156, P < 0.001) (). After excluding confounding factors, the TEXRS remained an independent prognostic factor (HR = 4.053, P = 0.002) (). Similarly, a nomogram was constructed for the ICGC cohort with good predictive ability, and the predicted results were close to the actual results (). In addition, in the other two GEO cohorts, there was still a significant difference in OS among patients in the high- and low-TEXRS groups, whereas there was no statistical difference in the E-TABM-36 cohort, which may be because of the small number of patients (Figure S3C–E).
Figure 6 TEXRS testing in external validation (ICGC cohort). (A) Survival curve of high and low TEXRS; (B) ROC curve; (C) Analysis of TEXRS and clinical characterizations; (D) Univariate cox analysis of TEXRS and clinical characterizations; (E) Multifactorial cox analysis of TEXRS and clinical characterizations; (F) A nomogram of TEXRS and clinical characterizations; (G) ROC analysis of the nomogram; (H) Calibration curve of the nomogram. *P < 0.05, **P < 0.01, ***P < 0.001. TEXRS, T cell exhaustion risk score; ROC, receiver operating characteristic.
TIME Analysis
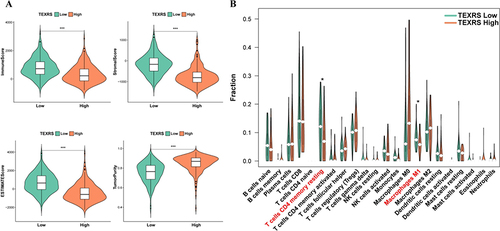
The ESTIMATE algorithm was used to understand the overall level of immune infiltration. Compared to patients with high-TEXRS scores, patients with low-TEXRS scores had higher immune, stromal, and ESTIMATE scores, while tumor purity scores were reversed (). The CIBERSORT method was used to evaluate the infiltration of various immune cells. The infiltration of resting memory CD4+T-cells and M1 macrophages was significantly reduced in the high-TEXRS group ().
Figure 7 Different immune microenvironments existed in high and low TEXRS groups. (A) ESTIMATE score of high and low TEXRS; (B) Immune cell infiltration of high and low TEXRS. *P < 0.05, ***P < 0.001. TEXRS, T cell exhaustion risk score.
Clinical Application of TEXRS
We observed significant differences in the expression of PDCD1 and CD274 between patients with high and low-TEXRS expression (). Further comparison of the proteomic data revealed higher expression of PD1L (encoding CD274) in the low-TEXRS group (), possibly indicating differences in immunotherapy outcomes between the two groups. Subsequently, the immunotherapeutic effect in the two patient groups was predicted using the immunophenoscore (IPS). The low-TEXRS group displayed a higher IPS, suggesting that the immunotherapeutic effect in the low-TEXRS group was better than that in the high-TEXRS group (). To ensure the prediction accuracy, we also confirmed, using the submap algorithm, that the PD1 treatment effect in the low-TEXRS group may be more favorable ().
Figure 8 TEXRS predicts immunotherapy and TACE performance. (A) Expression of CTLA4, PDCD1 and CD274 in high and low TEXRS; (B) PDL1 expression of high and low TEXRS in proteomic data; (C) IPS expression of high-low TEXRS (D) Submap algorithm predicted the therapeutic effect of high and low TEXRS; (E) There were significant differences in TEXRS in patients who did not respond to TCIA treatment; (F) ROC curve for TEXRS to predict TCIA effect. **P < 0.01, ***P < 0.001. TACE, transcatheter arterial chemoembolization; IPS, immunophenoscore; ROC, receiver operating characteristic.
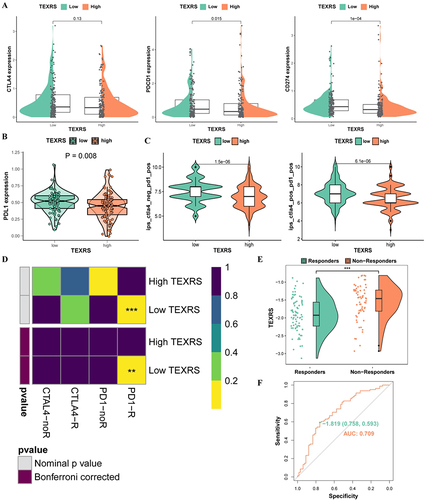
Under TACE treatment, the TEXRS of non-responders was significantly higher than that of responders (P < 0.001)(). Thus, we demonstrated the ability of TEXRS to predict TACE treatment response by ROC analysis (AUC=0.709), When the cutoff value is −1.819, the sensitivity is 0.593 and the specificity is 0.758 ().
Model Gene Expression Validation
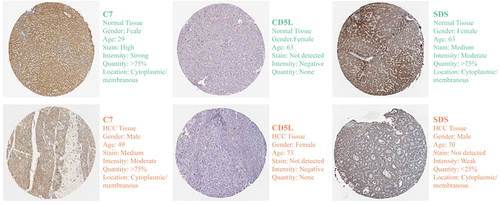
In TCGA cohort, three model genes (C7, CD5L, and SDS) were significantly downregulated in HCC tissues and maintained the original trend in paired tissues (). Three model genes in the GEPIA database were also downregulated in the HCC tissues (). The RT-qPCR results for the 21 pairs of HCC samples collected in this study were consistent with the results of the bioinformatics analysis (). The accuracy of the bioinformatics analysis and the stability of the model were further confirmed. In addition, they remained stable across 21 GEO datasets (, S4, and S5). At the protein level, immunohistochemistry confirmed that C7 and SDS were downregulated in HCC tissues ().
Figure 9 Stability of model gene expression at transcriptional level. Expression of C7 (A), CD5L (B) and SDS (C) in unpaired and paired pairs in the TCGA cohort; (D–F) Expression of C7, CD5L and SDS in the GEPIA database; (G–I) Expression of C7, CD5L and SDS in the GSE14520 dataset; (J–L) The expression of C7, CD5L and SDS was detected by RT-qPCR; Expression of C7, CD5L, and SDS in unmatched tissues in the GSE36376 (M) and GSE45436 (N) datasets. *P < 0.05, ***P < 0.001.
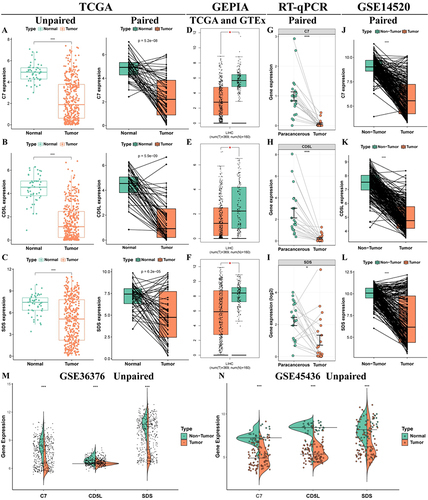
Figure 10 Stability of model gene expression at protein level.
Model Genes and Transcription Factors That Regulate Tex
First, we explored the distribution of model genes in the GSE146115 scRNA-seq dataset, with C7 and SDS mainly expressed in hepatocytes, and CD5L mainly expressed in macrophages ( and ). Next, the GSE140228 Smartseq2 data showed that C7 was weakly expressed in immune cells, while CD5L and SDS were mainly expressed in macrophages ( and ). In TCGA cohort, we found that model genes were mainly positively correlated with Tex transcription factors, while TEXRS was negatively correlated (). Since CD5L had the highest positive correlation with TBX21 and EOMES, we verified this using RT-qPCR and proved that CD5L was positively correlated with EOMES (R = 0.38, P = 0.015) in all tissues, whereas TBX21 showed no statistical significance (R = 0.19, P = 0.22). CD5L also positively correlated with C7 expression (R = 0.33, P = 0.035) (). Therefore, we hypothesized that macrophages are involved in the regulation of T-cell exhaustion.
Figure 11 Distribution of model genes in a scRNA-seq dataset and correlation analysis with regulatory Tex transcription factors. (A) GSE146115 data annotation for five cell types; (B) Distribution of C7, CD5L and SDS in each cell type; (C) Annotated as ten cell types in the GSE140228 Smartseq2 dataset; (D) Expression of C7, CD5L and SDS in various cell types; (E) Correlation analysis of C7, CD5L and SDS with regulatory Tex transcription factors; (F) Correlation analysis of CD5L with TBX21 and EOMES. *P < 0.05, **P < 0.01, ***P < 0.001. scRNA-seq, single-cell RNA sequencing; Tex, T cell exhaustion.
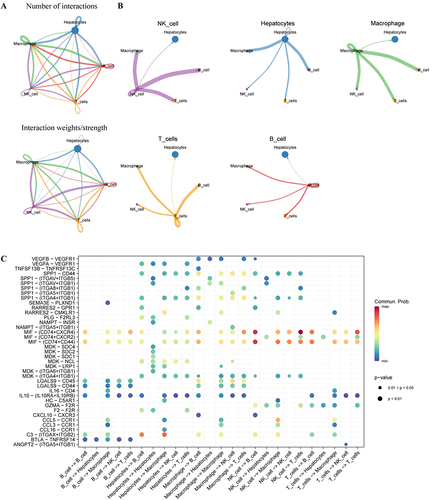
shows the amount of communication between the cells and the intensity of the interactions. HCC cells can send stronger signals to macrophages, which then send stronger signals to T-cells, and T-cells can then send stronger signals to macrophages (), suggesting that T-cell exhaustion may be related to macrophage interactions. shows that HCC cells may influence macrophages through C3- (ITGAX+ITGB2), and macrophages may interact with T-cells through receptor ligands, such as MIF-(CD74+CXCR4) and MIF- (CD74+CD44).
Figure 12 Cell communication analysis of scRNA-seq data. (A) GSE146115 data cell communication networks for five cell types; (B) How each cell interacts with other cells; (C) Bubble maps of receptor-mediated cell communication. scRNA-seq, single-cell RNA sequencing.
Discussion
Tex is defined as the low reactivity of CD8+T-cells due to persistent antigenic stimulation during chronic infections or various cancers.Citation42 In this process, T-cells proliferate, secrete cytokines, and lyse target cells with reduced ability to clear pathogens or destroy cancer cells.Citation43 Exhausted CD8+T-cells were found to significantly increase in HCC samples.Citation25 Nine transcription factors such as IRF4, BATF, and NFATc1 regulate exhausted CD8+T-cells.Citation28–30 Are nine transcription factors also involved in regulating Tex in HCC? Therefore, through analysis of the GSE146115 scRNA-seq dataset and GSE140228 Smartseq2 dataset, we found that transcription factors that regulate Tex are expressed in exhausted CD8+T-cells. This suggests that transcription factors regulating Tex are indeed involved in the suppressed TIME of patients with HCC.
Subsequently, Bulk RNA-Seq data (TCGA) were used to define regulatory Tex transcription factor pathway activity using the ssGSEA method. We found that patients with low TexScore had a worse prognosis, lower immune checkpoint expression, and lower pathway activity. Next, we identified the DEGs in the two groups, which may contain reasons for the different prognoses and TIME. A high standard clinical prediction model must have undergone strict internal and external validation processes. So we randomly divided the TCGA cohort into a training group and a test group in a 7:3 ratio. TEXRS was constructed in the training group by lasso regression analysis based on DEGs. Patients were divided into high- and low- TEXRS groups based on median TEXRS. Our analysis showed that the TEXRS was a robust predictor of prognosis in HCC, with significant differences in outcomes between the two groups. In long-term follow-up studies, in order to observe individual disease status and onset time information, time-dependent ROC curves are generally used. It can construct ROC curves at multiple time points and compare the predictive ability of markers, making it an effective tool for measuring the performance of candidate markers.Citation44 And we have demonstrated through time-dependent ROC curves that TEXRS has good predictive ability in training groups, internal validation, and external validation. TEXRS were significantly higher in patients with death, G3-4, Stage III–IV, and T3-4, which is consistent with poor prognosis in patients with advanced compared with early. In the same way, in the high-TEXRS group, a higher proportion of patients with death, G3-4, Stage III–IV, and T3-4. This suggests that TEXRS is consistent with the direction of clinical information in predicting prognosis. The Cox regression method simulates the relationship between specific exposure and the occurrence of a given outcome, taking into account multiple confounding and/or predictive factors simultaneously.Citation45 Univariate cox regression analysis of a single feature can test whether it is significantly correlated with sample survival, while multivariate Cox regression analysis can test whether a feature can be independent of other factors as an independent prognostic factor. Our results indicate that TEXRS is not only significantly associated with patient survival, but also an independent prognostic factor.
Dong et al established a prognosis score for patients with HBV-HCC based on necroptosis related genes, effectively stratified the patients’ prognosis, and found that LGALS3 could be used as a biomarker for the adverse progression of chronic HBV infection.Citation46 Therefore, it is reasonable and promising to build predictive models or discover biomarkers based on database big data and verify them. Recently, Zhong et al established a risk score model from the perspective of anoikis, which was externally verified by ICGC cohort but not internally verified in TCGA cohort.Citation47 The prognosis model we established was not only validated internally, but also externally by multiple datasets.
In terms of TIME, the low-TEXRS group had a higher infiltration of immune cells, especially resting memory CD4+T-cells and M1 macrophages. M1 macrophages are generally considered to be tumor-killing cells, and studies have shown that M1 macrophages can induce the expression of PD-L1 in HCC cells.Citation48,Citation49 This also suggests that there may be differences in immunotherapy outcomes between the two groups, so we compared the expression of immune checkpoints between the two groups in transcriptome and proteomics. Compared with the high-TEXRS group, the low TEXRS group showed higher expression of PDCD1 and CD276 (PD1L). Suggesting that the low TEXRS group may have a better immunotherapy effect, which was confirmed by IPS and submap algorithm. Our study may help predict the response status of patients with HCC to immunotherapy and provide a more individualized treatment regimen. Furthermore, TEXRS was significantly higher in non-responding patients compared to responding patients during TACE treatment, indicating its predictive capability for TACE treatment response.
TEXRS comprises C7, CD5L, and SDS, which showed consistent trends in TCGA, GEIPA, GEO, and RT-qPCR data, indicating stable gene expression within the model. Differential expression of C7 and SDS in HCC and normal tissues was verified using the HPA database. CD5L, a member of the SRCR superfamily, is primarily expressed in lymphocytes and macrophages and plays an important role in infection, atherosclerosis, and cancer.Citation50 Initially named “apoptosis inhibitor expressed by macrophages” (AIM) due to its anti-apoptotic effects in vivo and in vitro. Studies have shown that CD5L plays a key role in fibrosis in chronic liver disease, reducing hepatic stellate cell activation, liver damage, and inflammation during CCl4 injury.Citation51 In a study of lung adenocarcinoma, the immunosuppressive phenotype of macrophages was blocked in vitro by an anti-CD5L monoclonal antibody.Citation52 In our study, CD5L expression was significantly reduced in HCC tissues and correlated with the expression of TBX21 and EOMES, suggesting that CD5L may be involved in regulating Tex. Alongside complement proteins such as C5b, C6, C8, and C9, C7 forms part of the membrane attack complex (MAC).Citation53 The loss of C7 may affect MAC function and further increase susceptibility to infection.Citation54 Moreover, C7 also plays an important role in various cancer types, including gastric cancer, and ovarian cancer, and the expression in non-small cell lung cancer, affecting the prognosis of patients with prostate cancer.Citation55,Citation56 In addition, studies have shown that C7 affects the progression of liver cancer by maintaining the stem cell character of liver cancer cells.Citation57 SDS encodes one of the three enzymes involved in the metabolism of serine and glycine. L-serine dehydratase converts L-serine to pyruvate and ammonia, which requires pyridoxal phosphate as a cofactor. The encoded protein also metabolizes threonine to NH4+ and 2-ketobutyrate.Citation58
To the best of our knowledge, this is the first study to establish TEXRS through DEGs of regulating Tex transcription factors for predicting the prognosis and treatment outcomes of patients with HCC. While the model has been validated in multiple independent cohorts, it still has some limitations, including the lack of a real cohort to evaluate the accuracy of the model’s prognostic and treatment effectiveness predictions. Further in vivo or in vitro experiments are needed to explore the specific mechanisms by which model genes and macrophages participate in regulating Tex, which can be pursued in future research. In summary, transcription factors regulating Tex were involved in the TIME of HCC. TEXRS has demonstrated predictive power in multiple cohorts and can be used to predict treatment outcomes. We believe that the results of this study may provide new insights into the prognosis and treatment outcomes of patients with HCC.
Conclusion
In this study, we combined scRNA-seq with Bulk RNA-seq analysis to establish TEXRS, a set of DEGs regulating Tex transcription factors. TEXRS can be used to predict the prognosis of patients with HCC, its predictive power was validated in internal and multiple independent external cohorts. Additionally, TEXRS effectively predicts the outcomes of immunotherapy and TACE therapy. Finally, based on the basic experiment, bioinformatics analysis was performed. The results of this study provide new insights into the prognosis and therapeutic effects in patients with HCC.
Abbreviations
AUC, area under the curve; EBI, European Bioinformatics Institute; GEO, Gene Expression Omnibus; GEPIA, Gene Expression Profiling and Integrative Analysis; GSVA, Gene set variation analysis; HCC, Hepatocellular carcinoma; HPA, Human Protein Atlas; ICB, Immune checkpoint-blockade; ICGC, International Cancer Genome Consortium; IPS, immunophenoscore; MAC, Membrane attack complex; OS, Overall Survival; PCA, Principal component analysis; RBC, Red blood cell; ROC, Receiver operating characteristic; SYBRSNN, Shared nearest neighbor; TACE, transcatheter arterial chemoembolization; TCGA, The Cancer Genome Atlas; TCIA, The Cancer Immunome Atlas; TCR,; Tex, T- cell exhaustion; TEXRS, Tex-related genes; TEXRS, Tex Risk Score; TIME, tumor immune microenvironment.
Data Sharing Statement
We conducted this study using public databases, and all of the data from the above studies are available in the database: GEO database (http://www.ncbi.nlm.nih.gov/geo), ArrayExpress database (https://www.ebi.ac.uk/biostudies/arrayexpress), TCGA database (https://portal.gdc.cancer.gov), ICGC (https://daco.icgc.org/), TISCH2 database (http://tisch.comp-genomics.org/home/), MSigDB database (https://www.gsea-msigdb.org/gsea/msigdb), TISIDBdatabase (http://cis.hku.hk/TISIDB/), TCIA database (https://tcia.at/home), GEPIA database (http://gepia.cancer-pku.cn), and HPA database (https://www.proteinatlas.org/).
Ethics Statement
The study was conducted in accordance with the Declaration of Helsinki, and approved by the Ethics Committee of the Second Affiliated Hospital of Harbin Medical University.
Author Contributions
All authors made a significant contribution to the work reported, whether that is in the conception, study design, execution, acquisition of data, analysis and interpretation, or in all these areas; took part in drafting, revising or critically reviewing the article; gave final approval of the version to be published; have agreed on the journal to which the article has been submitted; and agree to be accountable for all aspects of the work.
Disclosure
The author reports no conflicts of interest in this work.
Acknowledgments
We are grateful to GEO, ArrayExpress, TCGA, ICGC, MSigDB, TCIA and HPA database for enabling contributors to upload their meaningful data to their platforms to significantly support our research.
Additional information
Funding
References
- Sung H, Ferlay J, Siegel RL, et al. Global cancer statistics 2020: GLOBOCAN estimates of incidence and mortality worldwide for 36 cancers in 185 countries. CA Cancer J Clin. 2021;71(3):209–249. doi:10.3322/caac.21660
- Grandhi MS, Kim AK, Ronnekleiv-Kelly SM, Kamel IR, Ghasebeh MA, Pawlik TM. Hepatocellular carcinoma: from diagnosis to treatment. Surg Oncol. 2016;25(2):74–85. doi:10.1016/j.suronc.2016.03.002
- Vogel A, Meyer T, Sapisochin G, Salem R, Saborowski A. Hepatocellular carcinoma. Lancet. 2022;400(10360):1345–1362. doi:10.1016/S0140-6736(22)01200-4
- Bruix J, Gores GJ, Mazzaferro V. Hepatocellular carcinoma: clinical frontiers and perspectives. Gut. 2014;63(5):844–855. doi:10.1136/gutjnl-2013-306627
- Hanahan D, Weinberg RA. Hallmarks of cancer: the next generation. Cell. 2011;144(5):646–674. doi:10.1016/j.cell.2011.02.013
- Keenan BP, Fong L, Kelley RK. Immunotherapy in hepatocellular carcinoma: the complex interface between inflammation, fibrosis, and the immune response. J Immunother Cancer. 2019;7(1):267. doi:10.1186/s40425-019-0749-z
- Llovet JM, Kelley RK, Villanueva A, et al. Hepatocellular carcinoma. Nat Rev Dis Primers. 2021;7(1):6. doi:10.1038/s41572-020-00240-3
- Sangro B, Gomez-Martin C, de la Mata M, et al. A clinical trial of CTLA-4 blockade with tremelimumab in patients with hepatocellular carcinoma and chronic hepatitis C. J Hepatol. 2013;59(1):81–88. doi:10.1016/j.jhep.2013.02.022
- Xu W, Liu K, Chen M, et al. Immunotherapy for hepatocellular carcinoma: recent advances and future perspectives. Ther Adv Med Oncol. 2019;11:1758835919862692. doi:10.1177/1758835919862692
- Rizzo A, Ricci AD, Brandi G. Systemic adjuvant treatment in hepatocellular carcinoma: tempted to do something rather than nothing. Future Oncol. 2020;16(32):2587–2589. doi:10.2217/fon-2020-0669
- Di Federico A, Rizzo A, Carloni R, et al. Atezolizumab-bevacizumab plus Y-90 TARE for the treatment of hepatocellular carcinoma: preclinical rationale and ongoing clinical trials. Expert Opin Investig Drugs. 2022;31(4):361–369. doi:10.1080/13543784.2022.2009455
- Xing R, Gao J, Cui Q, Wang Q. Strategies to improve the antitumor effect of immunotherapy for hepatocellular carcinoma. Front Immunol. 2021;12:783236. doi:10.3389/fimmu.2021.783236
- Lu C, Rong D, Zhang B, et al. Current perspectives on the immunosuppressive tumor microenvironment in hepatocellular carcinoma: challenges and opportunities. Mol Cancer. 2019;18(1):130. doi:10.1186/s12943-019-1047-6
- Santoni M, Rizzo A, Kucharz J, et al. Complete remissions following immunotherapy or immuno-oncology combinations in cancer patients: the MOUSEION-03 meta-analysis. Cancer Immunol Immunother. 2023;72(6):1365–1379. doi:10.1007/s00262-022-03349-4
- Santoni M, Rizzo A, Mollica V, et al. The impact of gender on The efficacy of immune checkpoint inhibitors in cancer patients: the MOUSEION-01 study. Crit Rev Oncol Hematol. 2022;170:103596. doi:10.1016/j.critrevonc.2022.103596
- Zhao M, Huang H, He F, Fu X. Current insights into the hepatic microenvironment and advances in immunotherapy for hepatocellular carcinoma. Front Immunol. 2023;14:1188277. doi:10.3389/fimmu.2023.1188277
- Fu Y, Liu S, Zeng S, Shen H. From bench to bed: the tumor immune microenvironment and current immunotherapeutic strategies for hepatocellular carcinoma. J Exp Clin Cancer Res. 2019;38(1):396. doi:10.1186/s13046-019-1396-4
- Mohr R, Jost-Brinkmann F, Özdirik B, et al. Lessons from immune checkpoint inhibitor trials in hepatocellular carcinoma. Front Immunol. 2021;12:652172. doi:10.3389/fimmu.2021.652172
- Kotsari M, Dimopoulou V, Koskinas J, Armakolas A. Immune system and Hepatocellular Carcinoma (HCC): new insights into HCC progression. Int J Mol Sci. 2023;24(14):11471. doi:10.3390/ijms241411471
- Sangro B, Sarobe P, Hervás-Stubbs S, Melero I. Advances in immunotherapy for hepatocellular carcinoma. Nat Rev Gastroenterol Hepatol. 2021;18(8):525–543. doi:10.1038/s41575-021-00438-0
- Hashimoto M, Kamphorst AO, Im SJ, et al. CD8 T cell exhaustion in chronic infection and cancer: opportunities for interventions. Annu Rev Med. 2018;69(1):301–318. doi:10.1146/annurev-med-012017-043208
- Wherry EJ, Kurachi M. Molecular and cellular insights into T cell exhaustion. Nat Rev Immunol. 2015;15(8):486–499. doi:10.1038/nri3862
- McLane LM, Abdel-Hakeem MS, Wherry EJ. CD8 T cell exhaustion during chronic viral infection and cancer. Annu Rev Immunol. 2019;37(1):457–495. doi:10.1146/annurev-immunol-041015-055318
- Wherry EJ, Ha SJ, Kaech SM, et al. Molecular signature of CD8+ T cell exhaustion during chronic viral infection. Immunity. 2007;27(4):670–684. doi:10.1016/j.immuni.2007.09.006
- Zheng C, Zheng L, Yoo JK, et al. Landscape of infiltrating T cells in liver cancer revealed by single-cell sequencing. Cell. 2017;169(7):1342–1356.e16. doi:10.1016/j.cell.2017.05.035
- Kuang T, Zhang L, Chai D, Chen C, Wang W. Construction of a T-cell exhaustion-related gene signature for predicting prognosis and immune response in hepatocellular carcinoma. Aging. 2023;15(12):5751–5774. doi:10.18632/aging.204830
- Shi J, Li G, Liu L, et al. Establishment and validation of exhausted CD8+ T cell feature as a prognostic model of HCC. Front Immunol. 2023;14:1166052. doi:10.3389/fimmu.2023.1166052
- Nayar R, Schutten E, Bautista B, et al. Graded levels of IRF4 regulate CD8+ T cell differentiation and expansion, but not attrition, in response to acute virus infection. J Immunol. 2014;192(12):5881–5893. doi:10.4049/jimmunol.1303187
- Porter CM, Clipstone NA. Sustained NFAT signaling promotes a Th1-like pattern of gene expression in primary murine CD4+ T cells. J Immunol. 2002;168(10):4936–4945. doi:10.4049/jimmunol.168.10.4936
- Scott AC, Dündar F, Zumbo P, et al. TOX is a critical regulator of tumour-specific T cell differentiation. Nature. 2019;571(7764):270–274. doi:10.1038/s41586-019-1324-y
- Man K, Gabriel SS, Liao Y, et al. Transcription factor IRF4 promotes CD8+ T cell exhaustion and limits the development of memory-like T cells during chronic infection. Immunity. 2017;47(6):1129–1141.e5. doi:10.1016/j.immuni.2017.11.021
- Martinez GJ, Pereira RM, Äijö T, et al. The transcription factor NFAT promotes exhaustion of activated CD8⁺ T cells. Immunity. 2015;42(2):265–278. doi:10.1016/j.immuni.2015.01.006
- Seo H, González-Avalos E, Zhang W, et al. BATF and IRF4 cooperate to counter exhaustion in tumor-infiltrating CAR T cells. Nat Immunol. 2021;22(8):983–995. doi:10.1038/s41590-021-00964-8
- Seo H, Chen J, González-Avalos E, et al. TOX and TOX2 transcription factors cooperate with NR4A transcription factors to impose CD8+ T cell exhaustion. Proc Natl Acad Sci U S A. 2019;116(25):12410–12415. doi:10.1073/pnas.1905675116
- McLane LM, Ngiow SF, Chen Z, et al. Role of nuclear localization in the regulation and function of T-bet and Eomes in exhausted CD8 T cells. Cell Rep. 2021;35(6):109120. doi:10.1016/j.celrep.2021.109120
- Alfei F, Kanev K, Hofmann M, et al. TOX reinforces the phenotype and longevity of exhausted T cells in chronic viral infection. Nature. 2019;571(7764):265–269. doi:10.1038/s41586-019-1326-9
- Yuan K, Zhao S, Ye B, et al. A novel T-cell exhaustion-related feature can accurately predict the prognosis of OC patients. Front Pharmacol. 2023;14:1192777. doi:10.3389/fphar.2023.1192777
- Chen L, Lin YH, Liu GQ, et al. Clinical significance and potential role of LSM4 overexpression in hepatocellular carcinoma: an integrated analysis based on multiple databases. Front Genet. 2022;12:804916. doi:10.3389/fgene.2021.804916
- Chen L, Yang Z, Cao Y, et al. Pan-cancer analysis and single-cell analysis revealed the role of ABCC5 transporter in hepatocellular carcinoma. Channels. 2021;15(1):541–554. doi:10.1080/19336950.2021.1968592
- Zhang R, Xia Y, Dong J, et al. Comprehensive analysis of m7G-related genes and chronic hepatitis B: diagnostic markers, immune microenvironment regulation, disease progression. J Immunol Res. 2023;2023:9471520. doi:10.1155/2023/9471520
- Barbie DA, Tamayo P, Boehm JS, et al. Systematic RNA interference reveals that oncogenic KRAS-driven cancers require TBK1. Nature. 2009;462(7269):108–112. doi:10.1038/nature08460
- Franco F, Jaccard A, Romero P, Yu YR, Ho PC. Metabolic and epigenetic regulation of T-cell exhaustion. Nat Metab. 2020;2(10):1001–1012. doi:10.1038/s42255-020-00280-9
- Nguyen LT, Ohashi PS. Clinical blockade of PD1 and LAG3--potential mechanisms of action. Nat Rev Immunol. 2015;15(1):45–56. doi:10.1038/nri3790
- Kamarudin AN, Cox T, Kolamunnage-Dona R. Time-dependent ROC curve analysis in medical research: current methods and applications. BMC Med Res Methodol. 2017;17(1):53. doi:10.1186/s12874-017-0332-6
- Abd ElHafeez S, Torino C, D’Arrigo G, et al. An overview on standard statistical methods for assessing exposure-outcome link in survival analysis (Part II): the Kaplan-Meier analysis and the Cox regression method. Aging Clin Exp Res. 2012;24(3):203–206. doi:10.1007/BF03325249
- Dong J, Zhang R, Xia Y, et al. The necroptosis related gene LGALS3 can be used as a biomarker for the adverse progression from chronic HBV infection to HCC. Front Immunol. 2023;14:1142319. doi:10.3389/fimmu.2023.1142319
- Zhong Z, Xie F, Yin J, et al. Development of a prognostic model for anoikis and identifies hub genes in hepatocellular carcinoma. Sci Rep. 2023;13(1):14723. doi:10.1038/s41598-023-41139-9
- Wanderley CW, Colón DF, Luiz JPM, et al. Paclitaxel reduces tumor growth by reprogramming tumor-associated macrophages to an M1 profile in a TLR4-dependent manner. Cancer Res. 2018;78(20):5891–5900. doi:10.1158/0008-5472.CAN-17-3480
- Zong Z, Zou J, Mao R, et al. M1 macrophages induce PD-L1 expression in hepatocellular carcinoma cells through IL-1β signaling. Front Immunol. 2019;10:1643. doi:10.3389/fimmu.2019.01643
- Sanjurjo L, Aran G, Roher N, Valledor AF, Sarrias MR. AIM/CD5L: a key protein in the control of immune homeostasis and inflammatory disease. J Leukoc Biol. 2015;98(2):173–184. doi:10.1189/jlb.3RU0215-074R
- Bárcena C, Aran G, Perea L, et al. CD5L is a pleiotropic player in liver fibrosis controlling damage, fibrosis and immune cell content. EBioMedicine. 2019;43:513–524. doi:10.1016/j.ebiom.2019.04.052
- Sanchez-Moral L, Paul T, Martori C, et al. Macrophage CD5L is a target for cancer immunotherapy. EBioMedicine. 2023;91:104555. doi:10.1016/j.ebiom.2023.104555
- Barnum SR, Bubeck D, Schein TN. Soluble membrane attack complex: biochemistry and immunobiology. Front Immunol. 2020;11:585108. doi:10.3389/fimmu.2020.585108
- Barroso S, López-Trascasa M, Merino D, Alvarez AJ, Núñez-Roldán A, Sánchez B. C7 deficiency and meningococcal infection susceptibility in two spanish families. Scand J Immunol. 2010;72(1):38–43. doi:10.1111/j.1365-3083.2010.02403.x
- Chen Z, Yan X, Du GW, et al. Complement C7 (C7), a potential tumor suppressor, is an immune-related prognostic biomarker in Prostate Cancer (PC). Front Oncol. 2020;10:1532. doi:10.3389/fonc.2020.01532
- Ying L, Zhang F, Pan X, et al. Complement component 7 (C7), a potential tumor suppressor, is correlated with tumor progression and prognosis. Oncotarget. 2016;7(52):86536–86546. doi:10.18632/oncotarget.13294
- Seol HS, Lee SE, Song JS, et al. Complement proteins C7 and CFH control the stemness of liver cancer cells via LSF-1. Cancer Lett. 2016;372(1):24–35. doi:10.1016/j.canlet.2015.12.005
- Szaflik JP, Majsterek I, Kowalski M, et al. Association between sorbitol dehydrogenase gene polymorphisms and type 2 diabetic retinopathy. Exp Eye Res. 2008;86(4):647–655. doi:10.1016/j.exer.2008.01.009