
Abstract
Purpose
Non-small cell lung cancer (NSCLC) accounts for the majority of lung cancer cases. Immediate early response 5 like (IER5L) plays crucial roles in progression and prognosis for several tumors, but its role in NSCLC remains unclear.
Patients and Methods
Gene expression and mutation profiles, DNA methylation data, and clinical information for cancers were downloaded from multiple databases. Relative expression, prognostic value, and correlation with disease progression of IER5L were analyzed in multiple cancers, including NSCLC. Upstream mechanisms were explored using a transcriptional network. Functional enrichment analysis, protein–protein interaction network, and gene set enrichment analysis were applied to study downstream mechanisms. Correlations of IER5L with immune infiltration, immune molecules, methylation status, and tumor mutation burden (TMB) were analyzed using R language. Finally, quantitative polymerase chain reaction (qPCR) and single-cell RNA sequencing (scRNA seq) analysis were performed to validate IER5L expression in NSCLC.
Results
Pan-cancer analysis displayed that IER5L expression was upregulated in multiple cancers and was associated with disease prognosis and progression, including NSCLC, which was validated using qPCR. scRNA seq analysis showed that multiple cells had increased IER5L expression. An EGR1-hsa-miR-8075-IER5L network was constructed for NSCLC. A total of 191 DEGs were identified between the two IER5L groups, which were significantly enriched in biological process of action potential, sodium ion transport, and regulation of membrane potential. Increased IER5L expression was primarily enriched in cell cycle, NOTCH signaling pathway, and oxidative phosphorylation pathway, and was correlated with increased regulatory T cells and neutrophils, elevated levels of immune molecules, and higher TMB.
Conclusion
Our findings show that increased IER5L expression was correlated with progression and prognosis in multiple cancers as well as with immune infiltration and immune molecules in NSCLC. Thus, IER5L is a prognostic biomarker in multiple cancers and may correlate with immunotherapeutic response in NSCLC.
Introduction
Lung cancer is the leading cause of cancer-related deaths worldwide.Citation1 Based on pathological point of view, lung cancer is divided into two types: non-small cell lung cancer (NSCLC) and small cell lung cancer (SCLC),Citation2 and NSCLC accounts for more than 80% of all cases.Citation3 Unfortunately, many NSCLCs are determined at advanced stages;Citation4 thus, many of them have lost surgical opportunity. Moreover, although many therapies have been developed for lung cancer, including chemotherapy, targeted therapy, and immunotherapy, its average 5-year overall survival (OS) probability remains less than 20%.Citation5–7 Thus, identification of effective biomarkers to predict prognosis and even guide therapy is important for NSCLC.
Various biomarkers for diagnosis and prognosis have been identified for NSCLC using the Gene Expression Omnibus (GEO) and The Cancer Genome Atlas (TCGA) databases, such as ADAM-like decysin-1 (ADAMDEC1),Citation8 long non-coding RNASEH1-AS1,Citation9 sialic acid binding Ig-like lectin 15 (Siglec15),Citation10 lysine acetyltransferase 2B (KAT2B),Citation11 and Erb-b2 receptor tyrosine kinase 4 (ERBB4).Citation12 Moreover, many gene signatures have been constructed to predict prognosis and therapeutic response for NSCLC, such as RNA-binding proteins related signature,Citation13 telomere length-related gene signature,Citation14 ferroptosis-related long non-coding RNAs signature,Citation15 immune microenvironment signature,Citation16 neutrophil extracellular traps-related lncRNA signature,Citation17 and glycolysis-related gene signature.Citation18 However, owing to complex molecular mechanisms and disease heterogenicity in NSCLC, more biomarkers having different targets and prognostic value need to be explored.
Immediate-early response family has three different members, which is activated under different conditions.Citation19 IER2 is activated through activating P38 and JNK, whereas IER5 expression is increased via proteotoxic stress.Citation19 In recent years, researchers have reported that activated immediate early response 5 like (IER5L) is correlated with tumorigenesis and its progression. In glioblastoma, there is increased IER5L expression in cancer tissues compared with control tissues.Citation20 Moreover, a growth on IER5L expression has been reported in metastatic colorectal cancer compared with primary cancer, and is negatively correlated with survival.Citation21 However, there are few pan-cancer analyses of IER5L and reports on the role of IER5L in NSCLC, so this study aimed to perform a pan-cancer analysis of IER5L and evaluate its value as a prognostic biomarker and a potential immunotherapeutic target for NSCLC.
In the present study, data were downloaded from several public databases. Pan-cancer analysis of IER5L were first performed in terms of gene expression, prognosis, and disease progression. In NSCLC, relative expression, prognostic value, and correlation with clinical parameters were analyzed using R language. Quantitative polymerase chain reaction (qPCR) and single-cell RNA sequencing (scRNA seq) analysis were used to validate dysregulated IER5L expression in NSCLC. Upstream and downstream mechanisms were explored using transcriptional network that was constructed using microRNA (miRNA) and transcription factors (TFs) and functional enrichment analysis, a protein–protein interaction (PPI) network, and gene set enrichment analysis (GSEA), respectively. Methylation levels of IER5L and tumor mutation burden (TMB) between the two groups were analyzed using R language. Finally, correlations of IER5L with immune infiltration and immune molecules (inhibitors and stimulators) were analyzed using R language to evaluate its value in immunotherapy.
Methods and Materials
Data Collection and Processing
The mRNA expression data and clinical information for multiple cancers were obtained from the Gene Expression Profiling Interactive Analysis 2 (GEPIA2) database (http://gepia2.cancer-pku.cn/#index). Moreover, mRNA expression profiles (1037 cancer and 108 controls), methylation data (807 cancer and 71 controls), gene mutation data (1059 cancer), and clinical information (1027 cancer) were downloaded from the TCGA-GDC database (https://portal.gdc.cancer.gov/repository). GSE31210 (226 cancer and 20 controls) and GSE30219 (293 cancer and 14 controls) datasets were downloaded from the GEO database (https://www.ncbi.nlm.nih.gov/gds/). GSE31210 and GSE30219 were generated from the GPL570 [HG-U133_Plus_2] Affymetrix Human Genome U133 Plus 2.0 Array. Inclusion criteria were patients with 1) NSCLC; 2) IER5L mRNA expression; and 3) complete follow-up data. Therefore, 987 patients from TCGA, 226 patients from GSE31210, and 268 patients from GSE30219 were included in the current study. The clinical characteristics of patients are summarized in .
Table 1 Clinical Characteristics of Patients with NSCLC from Public Databases
Levels of IER5L mRNA Expression and Its Prognostic Value in a Pan-Cancer Analysis
Levels of IER5L mRNA expression were estimated between cancer tissues and control tissues in 23 types of cancer and among different International Cancer Control (UICC) stages in the GEPIA2 database. Moreover, patients with each kind of cancer were divided into high or low IER5L expression groups based on the median IER5L mRNA expression, and survival analysis was performed between two IER5L expression groups.
Levels of IER5L mRNA Expression in NSCLC and Controls
Levels of IER5L mRNA expression in NSCLC were compared with controls in TCGA, GSE31210, and GSE30219 datasets. The diagnostic value of IER5L was evaluated using a receiver operating characteristic (ROC) curve.
RNA Extraction and qPCR Validation
Thirty-two lung tissues (16 NSCLC and 16 controls) were obtained from patients with NSCLC in Zigong First People’s Hospital. The baseline characteristics of patients are listed in . Total RNA was first extracted from lung tissues using the E.Z.N.A. HP Total RNA Kit (Omega, GA, USA) and was then applied to synthesize cDNA using The PrimeScriptTM RT reagent kit (Takara, Japan) based on the manufacturer’s protocol. Finally, qPCR was performed using cDNA via iQ™ SYBR Green Supermix (Bio-Rad, USA) according to the manufacturer’s instructions. Levels of IER5L mRNA expression were normalized using β-actin Ct value in a 2−ΔΔCt quantification method. The qPCR primers were as follows.
Table 2 The Clinical Characteristics of Patients with NSCLC from Our Cohort
IER5L-forward: 5′-AGACAAAGACTCGGCAAAGGG-3′.
IER5L-reverse: 5′-TGGTAGGCTCCTCGCTAAACA-3′.
β-actin′-forward: 5′-CCACGAAACTACCTTCAACTCC′-3′.
β-actin′-reverse: 5′-GTGATCTCCTTCTGCATCCTGT′-3′.
Single-Cell RNA Sequencing Analysis
Six single-cell RNA sequencing datasets for NSCLC were downloaded from the Tumor Immune Single-cell Hub database (TISCH, http://tisch1.comp-genomics.org/home/) including NSCLC_EMTAB6149, NSCLC_GSE117570, NSCLC_GSE127465, NSCLC_GSE127471, NSCLC_GSE139555, and NSCLC_GSE99254. A single-cell atlas was plotted, and IER5L mRNA expression was compared among different cells.
The Prognostic Value of IER5L and Its Correlation with Clinical Characteristics
The high or low IER5L expression groups were constructed using NSCLC patients based on the median IER5L mRNA expression. The OS probability was estimated between the two groups in TCGA, GSE31210, and GSE30219, and the DFS probability was calculated in GSE30219. Moreover, the levels of IER5L mRNA expression were compared between the different UICC stages in TCGA, GSE31210, and GSE30219, and were also compared between patients with relapse and patients without relapse in GSE30219. Independent prognostic factors for the NSCLC were screened using univariate and multivariate Cox regression analyses with the “survival” package in TCGA, GSE31210, and GSE30219.
Nomogram and Calibration Plots of Nomogram
A nomogram was constructed for NSCLC using independent prognostic factors screened by multivariate Cox regression analysis with the “rms” package in R language (version 4.0.2). Calibration plots of the nomogram were used to assess conformity of the nomogram-predicted with actual OS probability.
IER5L Methylation Levels and Gene Mutation Analysis
Methylation data of IER5L in NSCLC were obtained using Strawberry Perl (version 5.34.1). Correlation of IER5L methylation levels with IER5L mRNA expression levels was evaluated using Spearman rank correlation analysis. The “maftools” package in R language was applied to analyze gene mutation frequencies between the two groups in both LUAD and LUSC. Moreover, TMB was calculated using Strawberry Perl in both LUAD and LUSC, and correlation of IER5L expression levels with TMB was evaluated using Spearman rank correlation analysis.
Construction of the Upstream Regulatory Network of IER5L
TFs were obtained from the Harmonizome (https://maayanlab.cloud/Harmonizome/) and GRNdb (http://www.grndb.com/) databases. miRNAs of IER5L were acquired from the miRWalk (http://mirwalk.umm.uni-heidelberg.de/), TargetScan (https://www.targetscan.org/vert_80/), and mirDIP (http://ophid.utoronto.ca/mirDIP/) databases.
Identification of Differentially Expressed Genes (DEGs) and Construction of a PPI Network
DEGs were identified between the two IER5L expression groups in NSCLC using the “limma” package in R language, and the criteria were |log2 fold change (FC)|≥1 and adjusted P< 0.05. A heatmap was generated between the two IER5L expression groups using the “pheatmap” package in R language. The STRING online database (https://string-db.org, version 11.0) was used to construct a PPI network.Citation22 The top 200 DEGs were uploaded into the STRING online database to construct a PPI network, tailoring to “human”, “minimum required interaction score: 0.04”, and “network display options: hide disconnected nodes in the network”, and a “string_interactions_short.tsv” file was acquired. This file was then imported into Cytoscape (version 3.7.1) to identify hub genes using the MCC algorithm of cytoHubba app.
Functional Enrichment Analysis and GSEA
Functional enrichment analysis was performed using “clusterProfiler”, “org.Hs.eg.db”, “enrichplot” and “ggplot2” packages in R language, including biological process (BP), molecular function (MF), and cellular component (CC). Terms with adjusted P< 0.05 were considered of statistical significance. GSEA can determine whether a defined set of genes shows statistically significant and concordant differences between the two biological states.Citation23 GSEA software (version 4.0.3) and “c2.cp.kegg.v7.5.1.symbols.gmt” were obtained from the GSEA database (http://www.gsea-msigdb.org/gsea/index.jsp) and was used to perform pathway analysis between the two expression groups. Statistical significance was defined as false discovery rate (FDR)<0.25 and adjusted P<0.05.
Correlation of IER5L mRNA Expression with Immune Infiltration
Tumor micro-environment score was acquired using the “limma” and “e1071” packages in R language. The “vioplot” package in R language was used to calculate immune infiltration profiles between the two expression groups. In addition, correlations of IER5L expression with immune infiltration were assessed using Spearman rank correlation analysis in R language, and statistical significance was set at a P-value of <0.05 and |r|>0.1.
Correlation of IER5L mRNA Expression with Immune Molecules
Correlations of IER5L mRNA expression with multiple immune molecules (inhibitors and stimulators) in different cancers were obtained from the TISIDB database (http://cis.hku.hk/TISIDB/index.php). Correlations were assessed using Spearman rank correlation analysis.
Statistical Analysis
R language (version 4.0.2) and GraphPad Prism (version 7.00) were applied to perform statistical analysis and to draw all figures. Shapiro–Wilk normality test was used to evaluate data distribution type. Levels of IER5L relative expression were displayed as median (interquartile range). Comparisons between the two groups were performed using the Mann–Whitney test for nonparametric data. Kruskal–Wallis test was performed for multiple comparisons for nonparametric data. Correlation analysis was performed using Spearman rank correlation analysis. Survival curve was compared using Log rank test. Statistical significance was set at a P-value of <0.05.
Results
IER5L Was Associated with Prognosis and Progression in a Pan-Cancer Analysis
We firstly performed a pan-cancer analysis of IER5L in GEPIA2 database. Levels of IER5L mRNA expression were increased in bladder urothelial carcinoma, breast invasive carcinoma (BRCA), cholangiocarcinoma, colon adenocarcinoma, esophageal carcinoma (ESCA), head and neck squamous cell carcinoma, LUAD, LUSC, rectum adenocarcinoma (READ), stomach adenocarcinoma, thyroid carcinoma (THCA), and uterine corpus endometrial carcinoma when compared with controls (P<0.05, ), while levels of IER5L mRNA expression were lower in kidney chromophobe (KICH) than corresponding controls (P< 0.05, ). Kaplan–Meier survival curves showed that the high IER5L expression was correlated with a lower OS probability than the low IER5L expression in cervical and endocervical cancer (CESC) (Log-rank P= 0.072), kidney papillary cell carcinoma (KIRP) (Log-rank P= 0.064), brain lower grade glioma (Log-rank P< 0.001), liver hepatocellular carcinoma (LIHC) (Log-rank P= 0.017), NSCLC (Log-rank P< 0.001), ovarian serous cystadenocarcinoma (Log-rank P= 0.068), READ (Log-rank P= 0.025), and uveal melanoma (UVM) (Log-rank P= 0.008) (). Moreover, patients with the high IER5L expression displayed a worse DFS in comparison with patients with the low IER5L expression in BRCA (Log-rank P= 0.037), KIRP (Log-rank P= 0.02), NSCLC (Log-rank P= 0.007), pancreatic adenocarcinoma (Log-rank P= 0.063), prostate adenocarcinoma (Log-rank P< 0.001), READ (Log-rank P= 0.047), and UVM (Log-rank P= 0.026) (). Besides, levels of IER5L mRNA expression were associated with tumor progression in adrenocortical carcinoma (P= 0.070), CESC (P= 0.021), diffuse large B-cell lymphoma (P= 0.018), ESCA (P= 0.042), KICH (P= 0.025), LIHC (P= 0.021), testicular germ cell tumor (P= 0.051), THCA (P= 0.002), uterine carcinosarcoma (P= 0.019) (). Therefore, these findings show that IER5L expression is upregulated in multiple cancers and is associated with disease progression and prognosis.
Figure 1 Levels of IER5L expression in 23 kinds of cancers and corresponding controls from GEPIA2 database. (A) BLCA, BRCA, CESC, CHOL, COAD, ESCA, NHSC. (B) KICH, KIRC, KIRP, LIHC, LUAD, LUSC, PAAD, PCPG. (C) PRAD, READ, SARC, SKCM, STAD, THCA, THYM, UCEC. *P < 0.05.
Figure 2 Kaplan-Meier survival analysis of IER5L in different tumors. (A-H) Overall survival between the two IER5L groups in CESC, KIRP, LGG, LIHC, NSCLC, OV, READ, and UVM. (I-O) Disease free survival between the two IER5L groups in BRCA, KIRP, NSCLC, PAAD, PRAD, READ, and UVM.
Figure 3 Correlation of IER5L expression with tumor stages. (A) ACC. (B) CESC. (C) DLBC. (D) ESCA. (E) KICH. (F) LIHC. (G) TGCT. (H) THCA. (I) UCS. IER5L, immediate early response 5 like.
IER5L as a Diagnostic Biomarker in NSCLC
Because of its increasing prevalence and mortality, NSCLC was selected as the focus of this study. Levels of IER5L mRNA expression were significantly higher in NSCLC tissues than in control tissues in the TCGA (P< 0.001, ). The area under the curve (AUC) value was 0.882 (0.857–0.906), and cutoff value was 2.595 with a sensitivity of 74.25% and a specificity of 91.67% (). In addition, there were increased levels of IER5L expression in NSCLC in comparison with controls in both GSE31210 (P= 0.005; ) and GSE30219 (P< 0.001; ) datasets. qPCR was performed to validate the findings of bioinformatic analysis, and the results showed that levels of IER5L mRNA expression in NSCLC tissues were higher than those in control tissues (P= 0.015, ).
Figure 4 Levels of IER5L expression and its diagnostic value in NSCLC. (A) Levels of IER5L expression in NSCLC and corresponding controls from the TCGA. (B) Receiver operating characteristic curve of IER5L in NSCLC. (C-E) Levels of IER5L expression in NSCLC and corresponding controls from the GSE31210, GSE30219, and qPCR validation. IER5L, immediate early response 5 like; NSCLC, non-small cell lung cancer; TCGA, The Cancer Genome Atlas. *P < 0.05, **P < 0.01, ***P < 0.001.
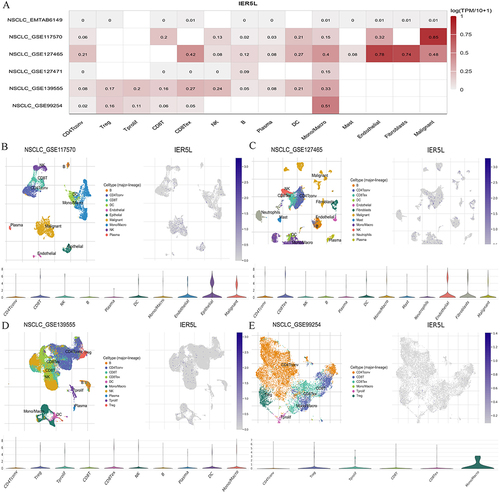
Single-Cell RNA Sequencing Analysis
Single-cell RNA sequencing analysis was performed to explore source of overexpressed IER5L in NSCLC. A heatmap of six datasets is displayed in . IER5L was mainly expressed in malignant cells in NSCLC_GSE117570 ( and ), in endothelial cells and fibroblasts in NSCLC_GSE127465 ( and ), and in monocytes and macrophages in both NSCLC_GSE139555 ( and ) and NSCLC_GSE99254 ( and ).
Figure 5 Single cell-RNA sequencing analysis in NSCLC. (A) A heatmap of six datasets. (B-E) Single-cell atlas and violin plot of IER5L in NSCLC_GSE117570, NSCLC_GSE127465, NSCLC_GSE139555, and NSCLC_GSE99254.
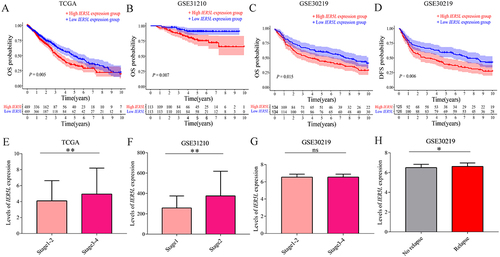
IER5L Was a Prognostic Biomarker and Was Correlated with Clinical Characteristics in NSCLC
Kaplan–Meier survival curves showed that patients with the high IER5L mRNA expression had a lower OS probability than patients with the low IER5L mRNA expression in the TCGA (P< 0.001, ), GSE31210 (P< 0.001, ), and GSE30219 (P< 0.001, ). In addition, the DFS probability was significantly lower in the high IER5L expression group than in the low IER5L expression group in GSE30219 (P< 0.001, ). Levels of IER5L mRNA expression were higher in patients with stage III–IV cancer than in patients with stage I–II cancer in TCGA (P= 0.001, ) and were increased in patients with stage II cancer than in patients with stage I cancer in GSE31210 (P< 0.001, ). However, levels of IER5L mRNA expression were not a significant difference between stage I–II and stage III–IV in GSE30219 (P> 0.05, ). The patients with relapse had higher levels of IER5L mRNA expression compared with the patients without relapse in GSE30219 (P= 0.039, ).
Figure 6 The clinical value of IER5L in NSCLC. (A-C) OS probability in the TCGA, GSE31210, and GSE30219. (D) DFS probability in the GSE30219. (E-G) Levels of IER5L expression in different UICC stages in TCGA, GSE31210, and GSE30219. (H) Levels of IER5L expression in different relapse groups in GSE30219. *P < 0.05, **P < 0.01.
IER5L as an Independent Prognostic Factor in NSCLC
Univariate Cox regression analysis reported that age (HR: 1.014; P=0.025), UICC stage (HR: 1.475; P<0.001), and IER5L expression (HR: 1.034; P<0.001) were correlated with NSCLC prognosis (), which was confirmed using multivariate Cox regression analysis (for age, HR:1.020, P=0.002; for UICC stage, HR: 1.499; P<0.001; for IER5L expression, HR: 1.037; P<0.001, ) in TCGA. In GSE30219, age (HR: 1.034; P<0.001), T stage (HR: 1.568; P<0.001), N stage (HR: 1.820; P<0.001), and IER5L expression (HR:1.536; P=0.003) were correlated with prognosis using univariate Cox regression analysis (), and age (HR: 1.036; P<0.001), N stage (HR: 1.646; P<0.001), and IER5L expression (HR:1.540; P=0.003) were correlated with prognosis using multivariate Cox regression analysis (). In GSE31210, UICC stage (HR: 4.232; P<0.001) and IER5L expression (HR: 1.001; P=0.035) were correlated with NSCLC prognosis (), however, only UICC stage was correlated with prognosis using multivariate Cox regression analysis (HR: 3.928; P< 0.001, ).
Figure 7 Univariate and multivariate Cox regression analysis, and a nomogram and its calibration plots. Univariate and multivariate Cox regression analyses in NSCLC in (A and B) TCGA, (C and D) GSE30219, and (E and F) GSE31210. (G) Nomogram. (H) Calibration plots of the nomogram. **P < 0.01, ***P < 0.001.
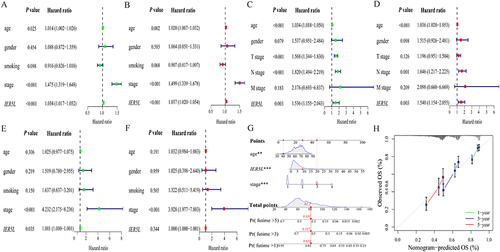
Nomogram and Calibration Plots of Nomogram
A nomogram was generated to predict OS probability, including age, UICC stage, and IER5L expression, in patients with NSCLC. The nomogram-predicted OS probability at 1, 3, and 5 years was calculated by plotting a vertical line between the total point axis and each prognostic axis (). Calibration plots of nomogram showed the high conformity of the nomogram-predicted and actual OS probability at 1, 3, and 5 years ().
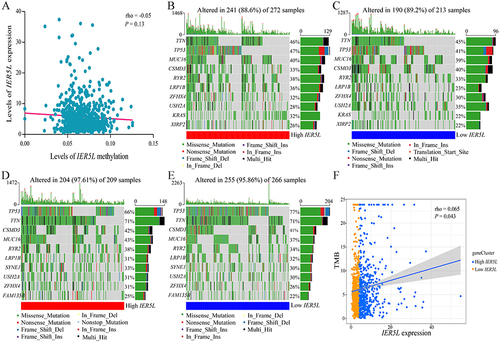
IER5L Expression Was Correlated with TMB in NSCLC
Levels of IER5L methylation were negatively correlated with levels of IER5L mRNA expression without a statistical difference (rho=−0.05, P=0.13, ). Genes with the highest mutation frequencies were tumor protein p53 (TP53) and titin (TTN) in both IER5L expression groups of LUAD and LUSC (). In addition, levels of IER5L mRNA expression were positively correlated with TMB in NSCLC (rho=0.065, P=0.043, ).
Figure 8 Methylation and mutation analysis. (A) Correlation of IER5L expression with IER5L methylation. (B, C) Gene mutation frequencies in the high and low IER5L expression groups in lung adenocarcinoma. (D and E) Gene mutation frequencies in the high and low IER5L expression groups in lung squamous cell carcinoma. (F) Correlation of IER5L expression with TMB.
An Upstream Regulatory Network of IER5L in NSCLC
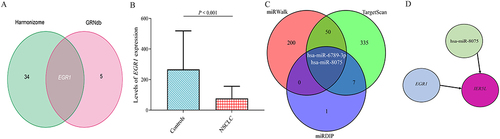
There were 35 and 6 TFs from the Harmonizome and GRNdb databases, respectively, and early growth response 1 (EGR1) was the only overlapping TF between the two databases (). Levels of EGR1 mRNA expression were decreased in NSCLC compared with controls (P< 0.001, ). There were 252 miRNAs, 394 miRNAs, and 10 miRNAs from miRWalk, TargetScan, and mirDIP databases, respectively, and hsa-miR-6789-3p and hsa-miR-8075 were overlapping miRNAs between the three databases (). hsa-miR-8075 has been associated with tumor cell proliferation and invasion.Citation24,Citation25 Therefore, an EGR1-hsa-miR-8075-IER5L network was constructed in NSCLC ().
Figure 9 A miRNA-transcription factor-mRNA network. (A) Overlapping transcription factors between Harmonizome and GRNdb databases. (B) Levels of EGR1 relative expression in NSCLC. (C) Overlapping microRNAs among miRWalk, TargetScan, and mirDIP databases. (D) An EGR1-hsa-miR-8075-IER5L network.
Identification of DEGs, Construction of a PPI Network, Functional Enrichment Analysis, and GSEA
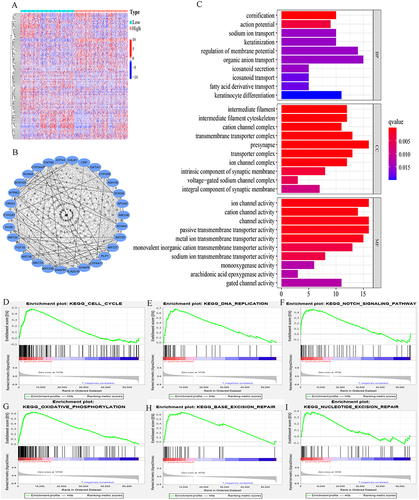
A total of 191 DEGs (38 upregulated and 153 downregulated genes) were identified when comparing the high IER5L expression group with the low IER5L expression group (|log2 fold FC|≥1 and adjusted P< 0.05). A heatmap is illustrated in . A PPI network was generated in the STRING online database and the top 30 hub genes were screened using the MCC method in Cytoscape, among which the top five hub genes were neurotrophic receptor tyrosine kinase 2 (NTRK2), contactin 2 (CNTN2), synaptoporin (SYNPR), glutamate ionotropic receptor AMPA type subunit 1 (GRIA1), and keratin 20 (KRT20) (). These DEGs were significantly enriched in BP such as action potential, sodium ion transport, and regulation of membrane potential; CC such as intermediate filament, intermediate filament cytoskeleton, and cation channel complex; and MF such as channel activity, passive transmembrane transporter activity, and monooxygenase activity (adjusted P< 0.05, ). GSEA showed that pathways correlated with the high IER5L expression were primarily enriched in cell cycle, DNA replication, Notch signaling pathway, oxidative phosphorylation, base excision repair, and nucleotide excision repair (FDR<0.25 and nominal P<0.05; ).
Figure 10 A PPI network, functional enrichment analysis, and gene set enrichment analysis. (A) A heatmap of two IER5L expression groups. (B) A PPI network. (C) Functional enrichment analysis, including BP, CC, and MF. (D) Cell cycle. (E) DNA replication. (F) Notch signaling pathway, (G) Oxidative phosphorylation. (H) Base excision repair. (I) Nucleotide excision repair.
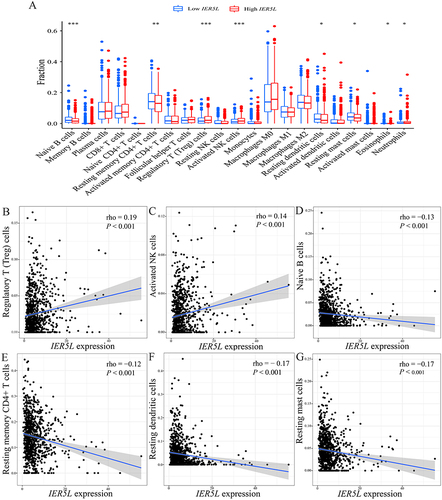
IER5L Expression Was Correlated with Immune Infiltration
There was an increased number of regulatory T (Treg) cells (P<0.001), neutrophils (P<0.05), and activated natural killer (NK) cells (P<0.001) in the high IER5L expression group in comparison with the low IER5L expression group (); whereas a reduced number of naive B cells (P<0.001), resting memory CD4+ T cells (P<0.01), resting dendritic cells (P<0.001), resting mast cells (P<0.001), and eosinophils (P<0.01) in the high IER5L expression group compared with the low IER5L expression group (). Levels of IER5L expression were positively correlated with the number of Treg cells (rho=0.19, P<0.001) and activated NK cells (rho=0.14, P<0.001) ( and ), and were negatively correlated with the number of naive B cells (rho=−0.13, P<0.001), resting memory CD4+ T cells (rho=−0.12, P<0.001), resting dendritic cells (rho=−0.17, P<0.001), and resting mast cells (rho=−0.17, P<0.001) ().
Figure 11 Correlations of IER5L expression with immune infiltration. (A) Immune infiltration profiles between the two IER5L expression groups. Correlations of IER5L expression with (B) Treg cells, (C) activated NK cells, (D) naive B cells, (E) resting memory CD4+ T cells, (F) resting dendritic cells, (G) resting mast cells. *P < 0.05, **P < 0.01, ***P < 0.001.
IER5L Expression Was Correlated with Immune Molecules
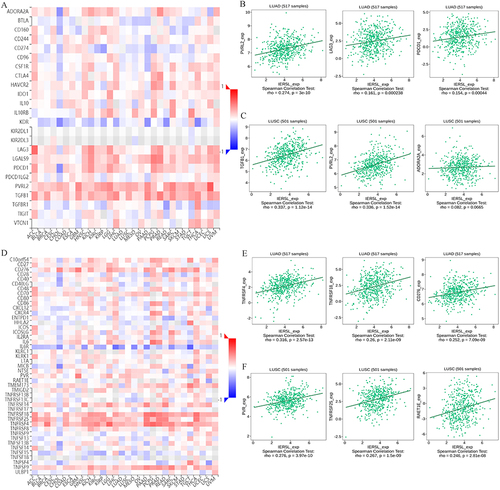
We next explored the correlation of IER5L with immune molecules including inhibitors and stimulators in the TISIDB database. IER5L mRNA expression was positively correlated with many immune inhibitors in NSCLC (). The top three immune inhibitors were nectin cell adhesion molecule 2 (PVRL2) (rho=0.274, P<0.001), lymphocyte activating 3 (LAG3) (rho=0.161, P<0.001), and programmed cell death 1 (PDCD1) (rho=0.154, P<0.001) in LUAD (), and the top three immune inhibitors were transforming growth factor beta 1 (TGFB1) (rho=0.337, P<0.001), PVRL2 (rho=0.336, P<0.001), and adenosine A2a receptor (ADORA2A) (rho=0.082, P=0.066) in LUSC (). Besides, IER5L expression was positively correlated with many immune stimulators in NSCLC (). The top three immune stimulators were TNF receptor superfamily member 4 (TNFRSF4) (rho=0.316, P<0.001), TNF receptor superfamily member 18 (TNFRSF18) (rho=0.26, P<0.001), and CD276 molecule (CD276) (rho=0.252, P<0.001) in LUAD (), and the top three immune stimulators were PVR cell adhesion molecule (PVR) (rho=0.276, P<0.001), TNF receptor superfamily member 25 (TNFRSF25) (rho=0.267, P<0.001), and retinoic acid early transcript 1E (RAET1E) (rho = 0.246, P< 0.001) in LUSC ().
Figure 12 Correlations of IER5L expression with immune molecules. (A) Correlations of IER5L expression with immune inhibitors in multiple cancers. (B and C) The top 3 immune inhibitors in lung adenocarcinoma and lung squamous cell carcinoma. (D) Correlations of IER5L expression with immune stimulators in multiple cancers. (E and F) The top 3 immune stimulators in lung adenocarcinoma and lung squamous cell carcinoma.
Discussions
In the current study, our findings showed that IER5L expression was dysregulated in multiple cancers and was also correlated with progression and prognosis in multiple cancers. In NSCLC. IER5L was a diagnostic biomarker and was an independent prognostic factor. An EGR1-hsa-miR-8075-IER5L network was constructed for NSCLC. DEGs are significantly enriched in the biological process of action potential, sodium ion transport, and regulation of membrane potential. Increased IER5L expression was primarily enriched in pathways of cell cycle, NOTCH signaling, and oxidative phosphorylation and was correlated with increased regulatory T cells and neutrophils, elevated levels of immune molecules, and high TMB.
Previous studies have shown that levels of IER5L expression were increased in both primary tumor tissues and metastatic tumor tissues and were negatively correlated with survival.Citation20,Citation21 Our study showed that IER5L expression was upregulated in many kinds of tumors in various systems and was associated with UICC stages and prognosis. Thus, in combination with the previous findings, we could conclude that IER5L may be a diagnostic and prognostic biomarker in cancer. Similar results have also been confirmed in NSCLC using several datasets, and increased IER5L expression has been validated using qPCR. In addition, univariate and multivariate Cox regression analyses reported that IER5L expression was correlated with NSCLC prognosis after adjustment for age and UICC stage. Thus, IER5L is an independent prognostic factor for NSCLC. A nomogram was generated using independent prognostic factors, and calibration plots of the nomogram showed highly predictive accuracy.
We then explore the underlying downstream mechanisms between the two IER5L expression groups using GSEA. The oxidative phosphorylation, Notch signaling pathway, cell cycle, and DNA replication were the primary pathways in our study. Increasing evidences reveal that oxidative phosphorylation is more active in cancer cells than in normal cells,Citation26 Attenuating cell oxidative phosphorylation could suppress cancer cell migration and invasion.Citation27,Citation28 The Notch signaling pathway has been implicated in the pathogenesis of many cancers,Citation29–31 and it influences tumor microenvironment,Citation32 and predicts prognosis, recurrence, and response to therapy.Citation33–36 Deregulation in cell cycle progression result in the unconstrained tumor cell proliferation.Citation37 DNA replication must be precisely controlled to maintain genome stability,Citation38 and genome instability increases the risk of cancer.Citation39 Thus, IER5L may be involved in the tumorigenesis, progression, and prognosis of NSCLC through the above-mentioned pathways. However, these pathways may not function as an isolated state; instead, they may interact to influence roles of tumor cells. Thus, more researches were needed to explore potential mechanisms between these pathways and role of IER5L in these pathways. TMB has been associated with prognosis of disease and immunotherapeutic response in multiple cancers.Citation40 Our study has reported that increased IER5L expression was correlated with higher TMB. Thus, the worse prognosis in the high IER5L expression may be correlated with increased TMB. These results show that interfering IER5L may prevent progression and improve prognosis in NSCLC, and it deserves further investigation.
The tumor microenvironment is mainly composed of malignant cells, fibroblasts, immune cells, and endothelial cells,Citation41 and they play critical roles in initiation, progression, and prognosis in cancer.Citation42 Treg cells are abundant in NSCLC and have an increased risk of recurrence in early-stage cancer,Citation43 and could predict the efficacy of PD-1/PD-L1 inhibitors.Citation44 Additionally, increased tumor-infiltrating Treg cells are associated with lower OS and DFS probability in lung cancer.Citation45–47 Lung cancer tissues have more neutrophil infiltration and neutrophil extracellular traps (NETs) formation.Citation48 Neutrophils are higher in advanced NSCLCCitation49 and are independently associated with survival.Citation50 Moreover, NETs can enable A549 cells to invade and migrate in a macrophage-maintained inflammatory microenvironment.Citation48 Brain metastasis of lung cancer is correlated with nicotine-induced N2-neutrophils.Citation51 Resting mast cells and eosinophils are significantly lower in lung cancer tissues.Citation52 The increased Treg cells and neutrophils as well as reduced resting mast cells and eosinophils were reported in the high IER5L expression group in the current study. Thus, IER5L was correlated with a dysregulated immune microenvironment, and may be correlated with response on immunotherapy. Our results also showed that IER5L expression was positively correlated with many immune molecules. Increased PD1 levels were significantly associated with better response to immunotherapy and worse OS probability,Citation53,Citation54 and PD1/PDL1 complex had a higher predictive value compared with single PD1.Citation55 QL1706, a mixture of anti-PD1 and anti-CTLA4, showed promising anti-tumor activities for immunotherapy-naive patients.Citation56 Thus, IER5L may function as an immunotherapeutic biomarker for NSCLC.
There are some highlights in our study. First, we have reported increased IER5L mRNA expression in multiple cancers, including NSCLC using multiple databases. Second, we performed comprehensive and in-depth bioinformatic analyses to explore the prognostic and therapeutic values of IER5L in NSCLC. Finally, qPCR validated the increased levels of IER5L mRNA expression in NSCLC. However, some limitations cannot be ignored in the current study. The current study is mainly based on bioinformatics analysis, and more experiments need to be performed to validate the function of IER5L in NSCLC. Moreover, the specific role of IER5L in cancer cell proliferation, migration, and invasion was not investigated in this study.
Conclusions
Pan-cancer analysis displayed that levels of IER5L expression were upregulated in multiple cancers and were associated with disease prognosis and progression, including NSCLC. An EGR1-hsa-miR-8075-IER5L network was constructed for NSCLC. DEGs are significantly enriched in the biological process of action potential, sodium ion transport, and regulation of membrane potential. Increased IER5L expression was primarily enriched in pathways of cell cycle, NOTCH signaling, and oxidative phosphorylation and was correlated with increased regulatory T cells and neutrophils, elevated levels of immune molecules, and high TMB. Thus, IER5L is a prognostic biomarker in multiple cancers and may correlate with immunotherapeutic response in NSCLC.
Abbreviations
ADAMDEC1, ADAM-like decysin-1; AUC, area under the curve; BP, biological process; CC, cellular component; CTLA4, cytotoxic T-lymphocyte associated protein 4; DEGs, differentially expressed genes; DFS, disease-free survival; ERBB4, Erb-b2 receptor tyrosine kinase 4; FDR, False discovery rate; FC, fold change, GEO, Gene Expression Omnibus; GEPIA2, Gene Expression Profiling Interactive Analysis 2; GSEA, gene set enrichment analysis; IER5L, immediate early response 5 like; NK, natural killer; KAT2B, lysine acetyltransferase 2B; MF, molecular function; NSCLC, non-small cell lung cancer; OS, overall survival; PD1, programmed cell death 1; PDL1, programmed cell death 1 ligand 1; PP1, protein–protein interaction, qPCR, quantitative polymerase chain reaction; ROC, receiver operating characteristic; Siglec15, sialic acid binding Ig-like lectin 15; scRNA seq, single-cell RNA sequencing; TCGA, The Cancer Genome Atlas; TMB, tumor mutation burden; UICC, Union for International Cancer Control; BRCA, breast invasive carcinoma, ESCA, esophageal carcinoma; READ, rectum adenocarcinoma; THCA, thyroid carcinoma; KICH, kidney chromophobe; CESC, cervical and endocervical cancer; KIRP, kidney papillary cell carcinoma; LIHC, liver hepatocellular carcinoma; UVM, uveal melanoma.
Data Sharing Statement
The datasets used and/or analyzed during the current study are available from the corresponding author on reasonable request.
Ethics Approval and Informed Consent
This study was approved by the Clinical Trial and Biomedical Ethics Committee of Zigong First People’s Hospital (No.2021-24) and was conducted in accordance with the principles of Declaration of Helsinki. All patients volunteered to attend the study and signed an informed consent.
Author Contributions
All authors made a significant contribution to the work reported, whether that is in the conception, study design, execution, acquisition of data, analysis and interpretation, or in all these areas; took part in drafting, revising, or critically reviewing the article; gave final approval of the version to be published; have agreed on the journal to which the article has been submitted; and agree to be accountable for all aspects of the work.
Disclosure
The authors declare that they have no competing interests in this work.
Additional information
Funding
References
- Sung H, Ferlay J, Siegel RL, et al. Global Cancer Statistics 2020: GLOBOCAN Estimates of Incidence and Mortality Worldwide for 36 Cancers in 185 Countries. CA Cancer J Clin. 2021;71(3):209–249. doi:10.3322/caac.21660
- Travis WD, Brambilla E, Burke AP, et al. Introduction to The 2015 World Health Organization Classification of Tumors of the Lung, Pleura, Thymus, and Heart. J Thorac Oncol. 2015;10(9):1240–1242. doi:10.1097/jto.0000000000000663
- Molina JR, Yang P, Cassivi SD, et al. Non-small cell lung cancer: epidemiology, risk factors, treatment, and survivorship. Mayo Clin Proc. 2008;83(5):584–594. doi:10.4065/83.5.584
- Bray F, Ferlay J, Soerjomataram I, et al. Global cancer statistics 2018: GLOBOCAN estimates of incidence and mortality worldwide for 36 cancers in 185 countries. CA Cancer J Clin. 2018;68(6):394–424. doi:10.3322/caac.21492
- Allemani C, Matsuda T, Di Carlo V, et al. Global surveillance of trends in cancer survival 2000-14 (Concord-3): analysis of individual records for 37 513 025 patients diagnosed with one of 18 cancers from 322 population-based registries in 71 countries. Lancet. 2018;391(10125):1023–1075. doi:10.1016/s0140-6736(17)33326-3
- Stella GM, Luisetti M, Pozzi E, et al. Oncogenes in non-small-cell lung cancer: emerging connections and novel therapeutic dynamics. Lancet Respir Med. 2013;1:251–261. doi:10.1016/s2213-2600(13)70009-2
- Herbst RS, Morgensztern D, Boshoff C. The biology and management of non-small cell lung cancer. Nature. 2018;553(7689):446–454. doi:10.1038/nature25183
- Zhu W, Shi L, Gong Y, et al. Upregulation of ADAMDEC1 correlates with tumor progression and predicts poor prognosis in non-small cell lung cancer (NSCLC) via the PI3K/AKT pathway. Thorac Cancer. 2022;13:1027–1039. doi:10.1111/1759-7714.14354
- Zhang C, Huang J, Lou K, et al. Long noncoding RNASEH1-AS1 exacerbates the progression of non-small cell lung cancer by acting as a ceRNA to regulate microRNA-516a-5p/FOXK1 and thereby activating the Wnt/β-catenin signaling pathway. Cancer Med. 2022;11:1589–1604. doi:10.1002/cam4.4509
- Liang H, Chen Q, Hu Z, et al. Siglec15 facilitates the progression of non-small cell lung cancer and is correlated with spinal metastasis. Ann Transl Med. 2022;10(6):281. doi:10.21037/atm-22-764
- Zhou X, Wang N, Zhang Y, et al. KAT2B is an immune infiltration-associated biomarker predicting prognosis and response to immunotherapy in non-small cell lung cancer. Invest New Drugs. 2022;40(1):43–57. doi:10.1007/s10637-021-01159-6
- Hu X, Xu H, Xue Q, et al. The role of ERBB4 mutations in the prognosis of advanced non-small cell lung cancer treated with immune checkpoint inhibitors. Mol Med. 2021;27(1):126. doi:10.1186/s10020-021-00387-z
- Miao TW, Chen FY, Du LY, et al. Signature based on RNA-binding protein-related genes for predicting prognosis and guiding therapy in non-small cell lung cancer. Front Genet. 2022;13:930826. doi:10.3389/fgene.2022.930826
- Liu XG, Li M, Mai SJ, et al. Telomere length-related signature as a novel biomarker of prognosis and immune response in non-small cell lung cancer. Eur Rev Med Pharmacol Sci. 2022;26(4):1304–1319. doi:10.26355/eurrev_202202_28124
- Li M, Zhang Y, Fan M, et al. Identification of the ferroptosis-related long non-coding RNAs signature to improve the prognosis prediction and immunotherapy response in patients with NSCLC. BMC Med Genomics. 2021;14(1):286. doi:10.1186/s12920-021-01133-4
- Wang Q, Zhou D, Wu F, et al. Immune Microenvironment Signatures as Biomarkers to Predict Early Recurrence of Stage Ia-b Lung Cancer. Front Oncol. 2021;11:680287. doi:10.3389/fonc.2021.680287
- Fang C, Liu F, Wang Y, et al. A innovative prognostic symbol based on neutrophil extracellular traps (NETs)-related lncRNA signature in non-small-cell lung cancer. Aging. 2021;13(13):17864–17879. doi:10.18632/aging.203289
- Yao J, Li R, Liu X, et al. Prognostic implication of glycolysis related gene signature in non-small cell lung cancer. J Cancer. 2021;12(3):885–898. doi:10.7150/jca.50274
- Ueda T, Kohama Y, Sakurai H. IER family proteins are regulators of protein phosphatase PP2A and modulate the phosphorylation status of CDC25A. Cell Signal. 2019;55:81–89. doi:10.1016/j.cellsig.2018.12.012
- Vastrad C, Vastrad B. Bioinformatics analysis of gene expression profiles to diagnose crucial and novel genes in glioblastoma multiform. Pathol Res Pract. 2018;214(9):1395–1461. doi:10.1016/j.prp.2018.07.015
- Zou J, Zhang H, Huang Y, et al. Multi-Omics Analysis of the Tumor Microenvironment in Liver Metastasis of Colorectal Cancer Identified FJX1 as a Novel Biomarker. Front Genet. 2022;13:960954. doi:10.3389/fgene.2022.960954
- Szklarczyk D, Gable AL, Lyon D, et al. STRING v11: protein-protein association networks with increased coverage, supporting functional discovery in genome-wide experimental datasets. Nucleic Acids Res. 2019:47:D607–d613. doi:10.1093/nar/gky1131
- Subramanian A, Tamayo P, Mootha VK, et al. Gene set enrichment analysis: a knowledge-based approach for interpreting genome-wide expression profiles. Proc Natl Acad Sci U S A. 2005;102(43):15545–15550. doi:10.1073/pnas.0506580102
- Song T, Xu A, Zhang Z, et al. CircRNA hsa_circRNA_101996 increases cervical cancer proliferation and invasion through activating TPX2 expression by restraining miR-8075. J Cell Physiol. 2019;234(8):14296–14305. doi:10.1002/jcp.28128
- Yan S, Han B, Gao S, et al. Exosome-encapsulated microRNAs as circulating biomarkers for colorectal cancer. Oncotarget. 2017;8(36):60149–60158. doi:10.18632/oncotarget.18557
- Zacksenhaus E, Shrestha M, Liu JC, et al. Mitochondrial OXPHOS Induced by RB1 Deficiency in Breast Cancer: implications for Anabolic Metabolism, Stemness, and Metastasis. Trends Cancer. 2017;3(11):768–779. doi:10.1016/j.trecan.2017.09.002
- Nie W, Hu MJ, Zhang Q, et al. DUBR suppresses migration and invasion of human lung adenocarcinoma cells via ZBTB11-mediated inhibition of oxidative phosphorylation. Acta Pharmacol Sin. 2022;43:157–166. doi:10.1038/s41401-021-00624-5
- Zhang J, Yan L, Wei P, et al. PEG-GO@XN nanocomposite suppresses breast cancer metastasis via inhibition of mitochondrial oxidative phosphorylation and blockade of epithelial-to-mesenchymal transition. Eur J Pharmacol. 2021;895:173866. doi:10.1016/j.ejphar.2021.173866
- Allen TD, Rodriguez EM, Jones KD, et al. Activated Notch1 induces lung adenomas in mice and cooperates with Myc in the generation of lung adenocarcinoma. Cancer Res. 2011;71(18):6010–6018. doi:10.1158/0008-5472.can-11-0595
- Aster JC, Pear WS, Blacklow SC. The Varied Roles of Notch in Cancer. Annu Rev Pathol. 2017;12(1):245–275. doi:10.1146/annurev-pathol-052016-100127
- Sharif A, Shaji A, Chammaa M, et al. Notch Transduction in Non-Small Cell Lung Cancer. Int J Mol Sci. 2020;22(1):21. doi:10.3390/ijms21165691
- Li X, Wang Y, Li X, et al. The Impact of NOTCH Pathway Alteration on Tumor Microenvironment and Clinical Survival of Immune Checkpoint Inhibitors in NSCLC. Front Immunol. 2021;12:638763. doi:10.3389/fimmu.2021.638763
- Chen CY, Chen YY, Hsieh MS, et al. Expression of Notch Gene and Its Impact on Survival of Patients with Resectable Non-small Cell Lung Cancer. J Cancer. 2017;8(7):1292–1300. doi:10.7150/jca.17741
- Donnem T, Andersen S, Al-Shibli K, et al. Prognostic impact of Notch ligands and receptors in nonsmall cell lung cancer: coexpression of Notch-1 and vascular endothelial growth factor-A predicts poor survival. Cancer. 2010;116(24):5676–5685. doi:10.1002/cncr.25551
- Yuan X, Wu H, Xu H, et al. Meta-analysis reveals the correlation of Notch signaling with non-small cell lung cancer progression and prognosis. Sci Rep. 2015;5(1):10338. doi:10.1038/srep10338
- Yuan X, Wu H, Xu H, et al. Notch signaling: an emerging therapeutic target for cancer treatment. Cancer Lett. 2015;369(1):20–27. doi:10.1016/j.canlet.2015.07.048
- Mohammadi M, Bagheri L, Badreldin A, et al. Biological Effects of Gyrophoric Acid and Other Lichen Derived Metabolites, on Cell Proliferation, Apoptosis and Cell Signaling pathways. Chem Biol Interact. 2022;351:109768. doi:10.1016/j.cbi.2021.109768
- Fagundes R, Teixeira LK. Cyclin E/CDK2: DNA Replication, Replication Stress and Genomic Instability. Front Cell Dev Biol. 2021;9:774845. doi:10.3389/fcell.2021.774845
- Yoshioka KI, Kusumoto-Matsuo R, Matsuno Y, et al. Genomic Instability and Cancer Risk Associated with Erroneous DNA Repair. Int J Mol Sci. 2021;23(1):22. doi:10.3390/ijms222212254
- Klempner SJ, Fabrizio D, Bane S, et al. Tumor Mutational Burden as a Predictive Biomarker for Response to Immune Checkpoint Inhibitors: a Review of Current Evidence. Oncologist. 2020;25:e147–e159. doi:10.1634/theoncologist.2019-0244
- Bian X, Xiao YT, Wu T, et al. Microvesicles and chemokines in tumor microenvironment: mediators of intercellular communications in tumor progression. Mol Cancer. 2019;18(1):50. doi:10.1186/s12943-019-0973-7
- Suzuki J, Aokage K, Neri S, et al. Relationship between podoplanin-expressing cancer-associated fibroblasts and the immune microenvironment of early lung squamous cell carcinoma. Lung Cancer. 2021;153:1–10. doi:10.1016/j.lungcan.2020.12.020
- Petersen RP, Campa MJ, Sperlazza J, et al. Tumor infiltrating Foxp3 + regulatory T-cells are associated with recurrence in pathologic stage I NSCLC patients. Cancer. 2006;107(12):2866–2872. doi:10.1002/cncr.22282
- Kang DH, Chung C, Sun P, et al. Circulating regulatory T cells predict efficacy and atypical responses in lung cancer patients treated with PD-1/PD-L1 inhibitors. Cancer Immunol Immunother. 2022;71(3):579–588. doi:10.1007/s00262-021-03018-y
- Wang W, Hodkinson P, McLaren F, et al. Small cell lung cancer tumour cells induce regulatory T lymphocytes, and patient survival correlates negatively with FOXP3+ cells in tumour infiltrate. Int J Cancer. 2012:131:E928–937. doi:10.1002/ijc.27613
- Shang B, Liu Y, Jiang SJ, et al. Prognostic value of tumor-infiltrating FoxP3+ regulatory T cells in cancers: a systematic review and meta-analysis. Sci Rep. 2015;5(1):15179. doi:10.1038/srep15179
- Wang X, Xiao Z, Gong J, et al. A prognostic nomogram for lung adenocarcinoma based on immune-infiltrating Treg-related genes: from bench to bedside. Transl Lung Cancer Res. 2021;10(1):167–182. doi:10.21037/tlcr-20-822
- Zhang L, Yi H, Chen J, et al. Neutrophil Extracellular Traps Facilitate A549 Cell Invasion and Migration in a Macrophage-Maintained Inflammatory Microenvironment. Biomed Res Int. 2022;2022:8316525. doi:10.1155/2022/8316525
- Varim C, Celik FD, Sunu C, et al. The role of neutrophil albumin ratio in predicting the stage of non-small cell lung cancer. Eur Rev Med Pharmacol Sci. 2022;26:2900–2905. doi:10.26355/eurrev_202204_28621
- Stares M, Ding TE, Stratton C, et al. Biomarkers of systemic inflammation predict survival with first-line immune checkpoint inhibitors in non-small-cell lung cancer. ESMO Open. 2022;7(2):100445. doi:10.1016/j.esmoop.2022.100445
- Tyagi A, Wu SY, Sharma S, et al. Exosomal miR-4466 from nicotine-activated neutrophils promotes tumor cell stemness and metabolism in lung cancer metastasis. Oncogene. 2022;41(22):3079–3092. doi:10.1038/s41388-022-02322-w
- Zhong R, Chen D, Cao S, et al. Immune cell infiltration features and related marker genes in lung cancer based on single-cell RNA-seq. Clin Transl Oncol. 2021;23:405–417. doi:10.1007/s12094-020-02435-2
- Széles Á, Fazekas T, Váncsa S, et al. Pre-treatment soluble PD-L1 as a predictor of overall survival for immune checkpoint inhibitor therapy: a systematic review and meta-analysis. Cancer Immunol Immunother. 2023;72(5):1061–1073. doi:10.1007/s00262-022-03328-9
- Moran JA, Adams DL, Edelman MJ, et al. Monitoring PD-L1 Expression on Circulating Tumor-Associated Cells in Recurrent Metastatic Non-Small-Cell Lung Carcinoma Predicts Response to Immunotherapy With Radiation Therapy. JCO Precis Oncol. 2022:6:e2200457. doi:10.1200/po.22.00457
- Sánchez-Magraner L, Gumuzio J, Miles J, et al. Functional Engagement of the PD-1/PD-L1 Complex But Not PD-L1 Expression Is Highly Predictive of Patient Response to Immunotherapy in Non-Small-Cell Lung Cancer. J Clin Oncol. 2023;41(14):2561–2570. doi:10.1200/jco.22.01748
- Zhao Y, Ma Y, Zang A, et al. First-in-human Phase I/Ib study of QL1706 (PSB205), a bifunctional PD1/CTLA4 dual blocker, in patients with advanced solid tumors. J Hematol Oncol. 2023;16(1):50. doi:10.1186/s13045-023-01445-1