Abstract
Chitosan, a well known natural cationic polysaccharide, has been successfully implemented in vitro and in vivo as a nonviral delivery system for both plasmid DNA and siRNA. While using chitosan/siRNA polyplexes to knock down specific targets, we have underestimated the effect of nucleic acids binding to chitosan when extracting RNA for subsequent quantitative PCR evaluation of silencing. In vitro transfection using chitosan/siRNA-based polyplexes reveals a very poor recovery of total RNA especially when using low cell numbers in 96 well plates. Here, we describe a method that dramatically enhances RNA extraction from chitosan/siRNA-treated cells by using an enzymatic treatment with a type III chitosanase. We show that chitosanase treatment prior to RNA extraction greatly enhances the yield and the integrity of extracted RNA. This method will therefore eliminate the bias associated with lower RNA yield and integrity when quantifying gene silencing of chitosan-based systems using quantitative real time PCR.
Chitosan is a natural polymer of β (1–4)-glucosamine and N-acetyl-D-glucosamine derived by partial deacetylation of chitin from crustacean shells.Citation1 Chitosan has a pKa of approximately 6.5, therefore, at lower pH values, the majority of the glucosamine residues on chitosan is cationic due to the protonation of amine groups, which enables the interaction with anionic components such as nucleic acids and cell surface macromolecules. Industrially, the process of partial deacetylation of chitin is controlled to yield specific chitosan types (or entities) characterized by their molecular weight (MW) as well as their degree of deacetylation (DDA). These two parameters have a major influence on chitosan biological and physicochemical properties.Citation2,Citation3 For example, increasing chitosan’s DDA results in reduced biodegradability and biological activity given that acetyl groups promote its degradation by enzymes.
Researchers have recently demonstrated the ability of chitosan to efficiently deliver a wide variety of biologics including proteins,Citation4–Citation6 plasmid DNA,Citation7–Citation11 and siRNA,Citation12–Citation14 both in vitro and in vivo. The effectiveness of delivery is generally assessed by evaluating the transfection efficiency for plasmid DNA or gene silencing for siRNA. Quantitative assessment of gene silencing can be performed by quantitative real time PCR analysis of targeted genes. The sensitivity and accuracy of the latter method is influenced by many variables including: 1) the quality of tissues/cells, 2) the RNA extraction method, 3) RNA integrity, and 4) the reverse transcription and polymerase chain reaction used in RT-PCR.Citation15–Citation18 Despite the development of relative quantification techniques like the Pfaffl methodCitation19 and the ΔΔCT method,Citation20 RNA integrity remains an important issue for generating proper data. While using siRNA-chitosan polyplexes to knock down specific targets, we have underestimated the effect of nucleic acids binding to chitosan when extracting RNA for subsequent quantitative PCR evaluation of silencing. In fact, polysaccharide matrices (ie, agarose and alginate) used for tissue engineering have been shown to interfere with techniques required for protein analysis and with all the procedures currently used for nucleic acid purification.Citation9,Citation21,Citation22 Moreover, our results described herein show that chitosan interferes with RNA extraction from low cell numbers. Therefore, we specifically examined this issue by delivering chitosan-siRNA nanoparticules against dipeptidyl peptidase IV (DPP-IV) mRNA in three different cell lines and found that siRNA-chitosan-treated cells reveal a very poor recovery of total RNA. The DPP-IV gene encodes a serine protease that cleaves the His:Ala:Glu sequence at the N-terminal region of the incretin hormone glucagon-like peptide 1 (GLP-1). GLP-1 regulates glucose homeostasis postprandialy thus decreasing its bioavailability and consequently causing a decrease in glucose level. The inhibition of DPP-IV increases GLP-1 bioavailability, hence it represents a potential therapeutic for type II diabetes.
Here, we propose a method for overcoming low RNA yield from chitosan/siRNA-transfected cells by enzymatically treating the cell lysate with Streptomyces griseus type III chitosanase in order to release mRNA that was bound to chitosan. In addition, we show that our technique is suitable for the removal of membrane bound chitosan for subsequent analysis by FACS of transfected cells.
Material and methods
Preparation of chitosan/siRNA polyplexes
siRNA sequences targeting the DPP-IV gene sequence were synthesized by Dharmacon (Thermo scientific, Dharmacon RNAi Technologies, USA) and are available in the On Target Plus® catalogue. The siRNA sequence has a dual strand modification pattern to reduce off target effects caused by both strands.
A 10 kDa MW chitosan with a degree of deacetylation (DDA) of 92% was prepared and characterized as described previouslyCitation11 and dissolved overnight on a rotary mixer at 0.5% (w/v) in hydrochloric acid using a glucosamine: HCl ratio of 1:1. Chitosan solutions were then diluted with deionized water to reach the desired amine (deacetylated groups) to phosphate (of the nucleic acid) ratio (N/P ratio). Chitosan/siRNA polyplexes were formed at three different N/P ratios of 5, 10, and 20. Prior to mixing with siRNA, the diluted chitosan solutions were sterile filtered with a 0.2 μm syringe filter. Chitosan/siRNA nanoparticles were then prepared by adding 100 μL of the sterile diluted chitosan solution to 100 μL of siRNA (100 nM) and mixed by rapid pipetting. The polyplexes were allowed to form during 30 minutes incubation at room temperature before transfection.
Polyplexes were measured independently using dynamic light scattering (DLS) and environmental scanning electronic microscopy (ESEM) and it was found that they had a mean diameter of approximately 50 nm.
Cell culture
HT-29, HepG2, and Caco-2 cell lines from American Type Cell Culture (ATCC, Manassas, VA) were cultured in McCoys media (HT-29) and Dulbecco minimum essential media (HepG2 and CaCo-2) with 1.85 g/L of sodium bicarbonate and supplemented with 10% FBS (Cedarlane Laboratories, Burlington, ON) at 37°C and 5% CO2. These cell types were chosen since they express the DPP-IV enzyme and represent models for diabetes research. For transfection, HT-29, HepG2, and CaCo-2 cells were plated in 96-well culture plates (Corning, NY, USA) at 25,000 cells/well using 100 μL/well of complete medium. The cells were transfected the following day at ∼50% confluency.
Transfection with chitosan/siRNA nanoparticle complexes
Complete transfection media (Dulbecco’s modified Eagle’s medium high glucose, 4-morpholineethanesulfonic acid (MES), pH 6.5) was equilibrated overnight in a 5% CO2, 37°C incubator. Prior to transfection, pH adjustment to 6.5 was performed with 1 N sterile HCl (Sigma-Aldrich, St.Louis, MO). For transfection, medium over cells was aspirated and replenished with 100 μL transfection medium (DMEM HG, MES, pH 6.5) containing chitosan/siRNA complexes at a concentration of 10 pmol or 50 pmoll siRNA/well corresponding to concentrations of 100 nM or 500nM siRNA. Cells were incubated with chitosan/siRNA complexes for 24 hours until analysis. All experiments were done in triplicates, with a minimum of three separate experiments to demonstrate reproducibility.
Transfection with Dharmafect1#™
Dharmafect1™/siRNA complexes were prepared with a 1:2 ratio (w/v) of siRNA: Dharmafect1™ according to the manufacturer specifications and were used as a positive control. Cells were incubated for four hours in presence of Dharmafect 1/siRNA complexes in serum-free medium then replenished with complete media (DMEM HG, 10% FBS, pH 7.4) and incubated for an additional 20 hours before analysis.
Chitosanase treatment of transfected cells and polyplexes degradation
Cells incubated with chitosan/siRNA polyplexes for 24 hours were treated with chitosanase (Sigma-Aldrich, cat # C9830) prior to RNA extraction in order to release anionic mRNA from potential binding sites on chitosan. A final concentration of 6.12 mU of chitosanase per μg of chitosan in DMEM at pH 6.5 (100 μL) or in RA1 lysis buffer (100 μL) + 2 μL of TCEP (Macherey-Nagel™) were used. The RA1 lysis buffer containing chitosanase was used to assess the enzyme activity in presence of guanidium thiocyanate. Chitosanase resuspended in DMEM or in the lysis buffer was directly applied onto cell monolayer. Cells were then incubated at 37°C for 60 minutes prior to RNA extraction and quantification for gene expression as described below.
A second set of experiments using chitosan/DPP-IVODN nanoparticules – with or without chitosanase treatment – were analyzed electrophoretically for the presence of chitosan and for OligoDeoxyNucleotides (ODN) release. Polyplexes were migrated for 120 minutes at 100V on a 13% polyacrylamide gel (BioRad Laboratories) in 1X MES buffer (20 mM MES, 8 mM sodium acetate, pH 6.5) and stained using coomassie Brillant Blue R250 (BioRad Laboratories) for chitosan visualization or ethidium bromide (0.5 μg/mL) for ODN visualization. Gel documentation and analysis were carried out using the bio-vision 3000 system and the Vision-Capt software (Vilbert Lourmat, Marne-la-Vallée, France).
FACS analysis
The cellular uptake of 5′6FAM labeled DPP-IVODN was analyzed using a BD Canto flow cytometer (Becton Dickinson, San Jose, CA) 24 hours post transfection. To determine the level of DNA cellular uptake, cells were transfected with polyplexes formed with 5′6FAM labeled DPP-IVODN as described above. Following 24 hours of incubation with polyplexes, cells were incubated with chitosanase for 60 minutes to dissociate and remove cell surface-associated complexes. For flow cytometry analysis, cells were washed twice in PBS, trypsinized, and resuspended in ice-cold PBS. For each sample, 20,000 events were counted and a dot plot of the forward light scatter against the side scatter was used to establish a collection gate to exclude cell debris, dead cells, and aggregates of cells. The 5′6FAM-positive cells were excited using a 488-nm laser line and detected using a 530/30-nm band pass filter. To distinguish between autofluorescence and fluorescently labeled cells, we ran nontransfected cells as negative controls. The cellular uptake of the polyplexes was calculated as the percentage of 5′6FAM-DPP-IVODN labeled cells, and the relative amount of the internalized 5′6FAM-DPP-IVODN was estimated from the median fluorescence intensity of the 5′6FAM-positive population.
Confocal imaging
Polyplexes internalization was studied by confocal imaging. Chitosans were labeled with fluorescent rhodamine B isothiocyanate (RITC) (Sigma-Aldrich, St-Louis, MO) and DPP-IVODN (21 nucleic acid) were labeled with 6-FAM on their 5′extremities (Integrated DNA Technologies, Inc). Cells were seeded 24 hours prior to transfection in 35 mm glass bottom culture dishes (MatTek, Ashland, MA) using 500 μl of complete medium at 40,000 cells/dish. Chitosan/ODN polyplexes were incubated with cells at a concentration of 2.5 μg ODN/wells in media containing 10% serum at pH 6.5 for 24 hours. Colocalisation was assessed qualitatively by the occurrence of yellow pixels resulting from the spatial overlap of red (Chitosan pseudocolor) and green pixels (ODN pseudocolor) from 2 separate channels. Prior to imaging, cell membranes were stained for 5 minutes at 37°C with 5 μg/ml of Cell Mask™ Deep red (Invitrogen, Carlsbad, CA) in complete media followed by two washes with cold PBS solution and resuspension in complete media. Imaging of live cells was done using a Zeiss LSM 510 META confocal Axioplan 200 microscope (Carl Zeiss AG, Feldbach, Switzerland).
RNA extraction and assessment methods (yield, purity, and integrity)
RNA extraction was performed using the RNA XS® extraction kit from Macherey-Nagel (Biolynx, Montréal, QC) according to the manufacturer protocol. For comparison purposes, RNA was also extracted with RNAqueous® from Ambion (Applied Biosystems, Streetsville, ON) according to the manufacturer protocol. Total RNA was quantified and RNA integrity measured using the Agilent BioAnalyzer 2100 (Agilent Technologies, Mississauga, ON) following the manufacturer’s protocol. RNA integrity was evaluated by the ratio of 28S/18S ribosomal RNA (rRNA)Citation23 and the RNA integrity number (RIN). Agilent 2100 BioAnalyzer uses automated microfluidics, capillary electrophoresis, and fluorescence to evaluate RNA integrity. The RIN is a related measure of RNA quality that is based on a larger portion of the electrophoretic trace. The BioAnalyzer 2100 automatically computes this parameter, and an ideal nondegraded RNA sample has a RIN of 10.
TaqMan® Gene Expression Assays: endogenous controls
Gene expression level for endogenous controls was determined using prevalidated Taqman Gene Expression Assays (Applied Biosystems, Streetsville, ON). PCR reactions for 384 well plate formats were performed using 2 μL of cDNA samples (25–50 ng), 5 μL of the Fast Universal qPCR MasterMix (Applied Biosystems, Streetsville, ON), 0.5 μL of the TaqMan Gene Expression Assay (20X), and 2.5 μL of water to create a total volume of 10 μL. The following genes were used as endogenous control: TBP (TATA binding protein) and HPRT (hypoxanthine guanine phosphoribosyl transferase).
Universal Probe Library (UPL) assays
Gene expression levels were determined using assays designed with the Universal Probe Library from Roche (http:\\www.universalprobelibrary.com). This technology utilizes short hydrolysis probes of 8 or 9 bases. The high melting temperature characteristic of longer probes is retained by using locked nucleic acid (LNA) nucleotide chemistry in these shorter probes. Since probes are only 8 or 9 bases long, each probe can hybridize to over 7,000 transcripts; thus, a set of only 100 probes can enable the quantification of virtually any transcript in a transcriptome. RNA samples were reverse transcribed into cDNA using the first strand cDNA transcriptor kit following the manufacturer protocol (Roche, Laval, QC). PCR reactions for 384 well plate formats were performed using 2 μL of cDNA samples (25 ng), 5 μl of the Fast Universal qPCR MasterMix (Applied Biosystems, Streetsville, ON), 2 μM of each primer, and 1 μM of a UPL probe # 71 (Roche, Laval, QC) to create a total volume of 10 μL.
Detection and analysis
The ABI PRISM® 7900HT Sequence Detection System (Applied Biosystems) was used to detect cDNA amplification level and was programmed with an initial step of 3 minutes at 95°C, followed by 45 cycles of: 5 seconds at 95°C and 30 seconds at 60°C. All reactions were run in triplicate and the average values of Ct (cycle threshold) were used for quantification. TBP and HPRT (hypoxanthine guanine phosphoribosyl transferase) were used as endogenous controls.
The relative quantification of target genes was determined using the ΔΔCT method. Briefly, the Ct values of target genes were referenced to an endogenous control gene (ΔCT = Ct target − Ct endoC) and compared with a calibrator: ΔΔCT = ΔCt Sample − ΔCt Calibrator. Relative expression (RQ) was calculated using the Sequence Detection System (SDS) 2.2.2 software (Applied Biosystems) using the formula RQ = 2−ΔΔCT.
Statistical analysis
The measurement data were collected and expressed as means values ± standard deviation (SD) and were analyzed with Statistica 9.0 software (STATSOFT; Statistica, Tulsa, OK). The statistical significance was determined by one-way ANOVA followed by Newman–Keuls post hoc test. Differences were considered significant at P < 0.05 and highly significant at P < 0.01.
Results
Cellular uptake
Transfection efficiency of Chitosan 92–10–5/DPP-IVODN, Chitosan 92–10–10/DPP-IVODN, and Chitosan 92–10–20/DPP-IVODN complexes in HepG2 cells was evaluated using flow cytometry. We found that the sedimentation of polyplexes on the cell surface adds a bias to cytometry data when calculating the percentage of positive cells or determining fluorescence intensity levels to assess the amount of internalized oligonucleotides.
Our results show that almost 90% ± 2 of HepG2 cells internalized the polyplexes and no significant difference between the three N/P ratios was observed (). Following chitosanase treatment, approximately a 10% reduction in the positive cell population was observed indicating that trypsinization and thorough washing alone did not fully dissociate surface bound polyplexes (). Furthermore, confocal imaging shows membrane associated polyplexes following thorough washing which supports our FACS data. Although the percentage of 6FAM-DPP-IVODN positive cells was similar for the three N/P ratios, the amount of the internalized DPP-IVODN, as determined from the fluorescence intensity levels, varied (). Moreover, cells incubated with formulations that had higher N/P ratios showed lower amounts of internalized DNA. The excessive cellular uptake of polyplexes was further confirmed by confocal imaging, as shown in . Large internalized assemblies of complexes were observed two hours post incubation and an optimal dissociation was observed 24 hours post transfection (). The transfection efficiency of each group was evaluated in three independent experiments using flow cytometry.
Figure 1 FACS analysis of chitosan/DPP-IVODN polyplexes uptake in HepG2 cell line. Uptake of 5′-6FAM labeled DPP-IVODN in chitosanase treated and untreated cells 24 hours post transfection. (A) Transfection efficiency was calculated as the percentage of 5′FAM-DPP-IVODN labelled cells. (B) The relative amount of internalized DPP-IVODN was determined using flow cytometry and is expressed as the median of fluorescence intensity (FI) of the 6FAM-DPP-IVODN positive cells. Data points represent the mean values ± SD, n = 3.*P < 0.05; **P < 0.01.
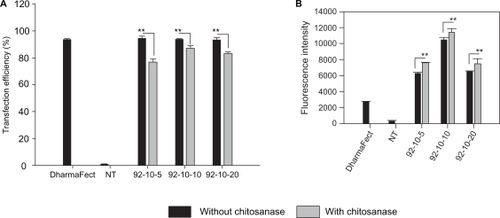
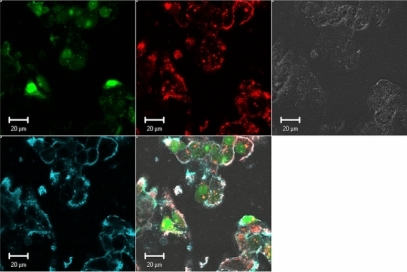
Figure 2 Confocal imaging of polyplexes uptake. Confocal microscopy images of HepG2 live cells 24 hours post transfection with chitosan/DPP-IVODN polyplexes (N/P = 5). Chitosan 92–10 (DDA, MW) was labeled with Rhodamine (red), the DPP-IVODN with 6FAM at the 5′extremity (green), and the cell membranes were stained prior to imaging with cell mask (blue). Membrane staining was performed to differentiate between internalized and membrane bound polyplexes.
Effect of low molecular weight chitosan on RNA recovery
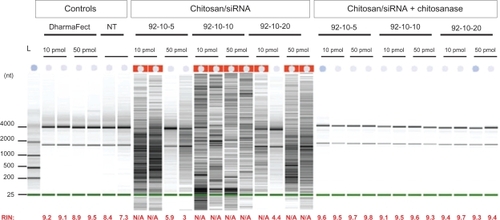
The effect of low molecular weight chitosan (DDA = 92, MW = 10 kDa) at different N/P ratios on RNA extraction was assessed using the Bioanalyzer 2100 system (). These results show very poor recovery of total RNA from low number cells transfected with chitosan/siRNA polyplexes compared to both lipofectamine-treated and nontransfected cells (). We found that the majority of the samples had a recovery level below the detection threshold (10 ng/μl, RNA Integrity Number (RIN) >7). Additionally, our results indicated that lower N/P ratios or lower amounts of added polyplexes (corresponding to 50 pmol to 10 pmol siRNA per well) did not improve total RNA yield. The extraction efficiency with or without chitosanase treatment was evaluated in three independent experiments with triplicates in each experiment.
Figure 3 Effect of Streptomyces griseus chitosanase on yield and integrity of total RNA extraction. Total RNA extraction was performed on HepG2 cells transfected with 10 pmol and 50 pmol of nanoparticles siRNA/chitosan at three different N/P ratios indicated by the formulation code 92-10-5, 92-10-10, or 92-10-20 (DDA, MW, N/P). Chitosanase was resuspended in DMEM pH 6.5 and directly applied to cells at a final concentration of 6.12 mU/μg of chitosan. Total RNA was extracted from chitosan transfected cell treated with or without chitosanase. The different extractions were compared to control Dharmafect™ 1 transfected cells and nontransfected (NT) cells. (nt) = nucleotide, L = standard ladder, the green band is a lower marker, which allows sample alignment and permits comparison for RIN calculation. RIN = RNA integrity number, is an algorithm-based numbering system that calculates-RNA integrity with 10 being the most intact and 1 being fully degraded.
Effect of lysis buffer on chitosanase activity
We assessed both the effect of guanidium thiocyanate, a chaotropic agent, contained in commercial RA1 lysis buffer, and high DDA (92% and 98% respectively) on S.griseus chitosanase activity. First, chitosan polyplexes were digested with S.griseus chitosanase and were compared to nondigested samples (). Our results show that chitosan digestion was not affected at high DDA (98%). Moreover, DPP-IVODN liberated from chitosanase-treated polyplexes showed a quasi-total recovery indicating that smaller monomers did not bind nucleic acid. Second, chitosanase activity was assessed in lysis buffer. Our results show that S.griseus chitosanase activity is not altered or reduced in lysis buffer (). These results suggest that the chitosanase digestion can be performed directly in the lysis buffer decreasing the processing time of the sample ().
Figure 4 Polyacrylamide gel electrophoresis of chitosan/DPP-IVODN polyplexes bearing different DDAs and N/P ratios, treated with or without Streptomyces griseus chitosanase. a) chitosan migration. b) ODN migration. Lanes 1 to 4 correspond to chitosan/DPP-IVODN directly incubated with chitosanase for 60 minutes at 37°C. Chitosan digestion allows the ODN release. Lanes 5 to 8 correspond to chitosan/DPP-IVODN incubated at the similar conditions without chitosanase. Faster chitosan migration was observed when comparing lanes 5 and 6 due to different MW of theses formulations. Increased band intensity (lanes 6–8) results from greater amounts of chitosan at higher N/P ratios.
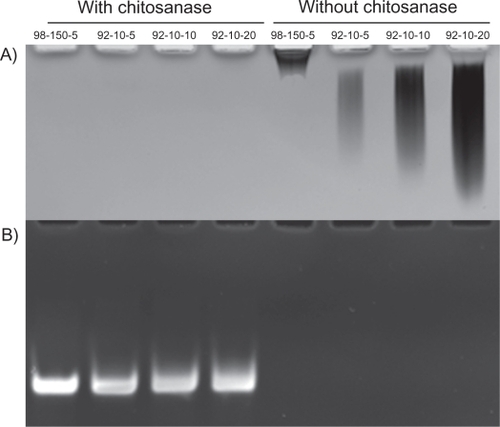
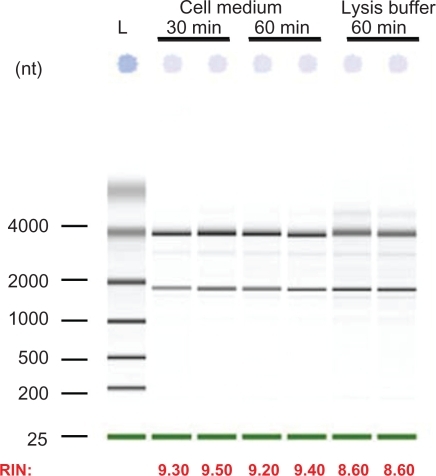
Figure 5 Total RNA extraction from HepG2 transfected cells with 10 pmol siRNA. Following transfection, cells were treated with chitosanase for: 30 min and 60 min in cell medium and for 60 min in lysis buffer.
Gene silencing
The ability of chitosan 92–10–5 formulation to deliver DPP-IV siRNA in three different cell lines was assessed using qPCR. Our results revealed an 80% and 78% silencing of the DPP-IV gene in HepG2 and Caco-2 cell lines respectively when compared to nontransfected cells. These results are similar to the liposome-based positive control, Dharmafect 1™ (). Moreover, total RNA recovery from low cell number without chitosanase treatment was very low with RIN values below the set threshold accounting for the inability to assess gene inhibition using qPCR (). HT-29 cell line was difficult to transfect using this specific chitosan/siRNA formulation due to the absence of cellular uptake as shown by our FACS and confocal microscopy results (data not shown). Although the HT-29 cell line was difficult to transfect, recovery of total RNA was poor, most probably due to extracellular excess of chitosan and to membrane bound polyplexes. Cellular viability in HepG2, Caco-2, and HT-29 cell lines was maintained after addition of the different chitosan formulations used for transfection, dismissing the likelihood of toxicity effects. Gene silencing was evaluated in two independent experiments in triplicates for each experiment.
Table 1 Effect of chitosanase treatment on RNA extraction, Relative Integrity Number (RIN), and real-time PCR (qPCR) analysis in three different DPP-IV expressing cell lines. Inhibition percentages of DPP-IV gene expression in siRNA/polyplexes transfected cells were determined in comparison with nontransfected cells
Discussion
Current methods and commercial kits for RNA isolation are based on the use of acid guanidium thiocyanate buffers for cell lysis and protein denaturation. Depending on the methods used, either a phase separation followed by RNA precipitation is performed (TRIzol®) or silica-based matrices (RNeasy®; RNA XS®) are used to electrostatically bind and recover RNA through washing and elution steps. These methods present major drawbacks when large polysaccharide fragments are present after sample digestion. These polysaccharide fragments can entrap nucleic acids physically, thus reducing RNA after centrifugation.Citation24 Chitosan is a polymeric cation that has been shown to prevent the efficient purification of nucleic acids from cell entrapped matrices using available procedures and commercial kits.Citation10,Citation21 The low efficiency of purification is mainly due to the amine groups, which are protonated in acidic environmentsCitation25 such as the guanidinium thiocyanate buffer used in both Trizol®-and silica-based kitsCitation26 hence promoting nucleic acid entrapment and/or binding. Another explanation for the poor recovery of total RNA when using silica-based column is that polysaccharide contaminants have been shown to decrease significantly the efficiency of spin columns.Citation26 To resolve these issues associated with chitosan protonation, successful attempts have been made to adjust the pH of guanidinium thiocyanate extraction buffers.Citation27 However, the RNA purity ratio could not be measured adequately due to possible polysaccharide contamination. In our study, we showed that chitosan/siRNA transfection of low cell numbers resulted in a poor recovery of total RNA for subsequent transcriptomic analysis. The poor recovery might be due to the high binding affinity of chitosan to nucleic acids as recently quantified. Notably, the majority of the chitosan in these preparations is soluble and not complexed to the polynucleotide according to our recent data using Asymetric Field Flow Fractionation.Citation28 The main effect of chitosanase treatment may then be to eliminate the free fraction that could clearly bind to polyanionic mRNA and inhibit its extraction from chitosan-treated cells. This binding effect would be further accentuated in the cell lysis buffer containing guanidium thiocyanate which has an acidic pH of ∼5 and increases ionization of chitosan therefore augments its binding affinity to polynucleotides.
According to the hydrolysis specificity of the β-glycosidic linkages in partially N-acetylated chitosan molecules, chitosanase can be classified into three classes. Streptomyces griseus chitosanase is a type III enzyme that catalyzes both the endohydrolysis of β-(1–4)-linkage between N-acetylglucosamine and D-glucosamine (GlcNAc-GlcN) and between D-glucosamine (GlcN-GlcN) residues in chitosane.Citation29 Sato et al found that the relative activity of the enzyme was 80% when degrading chitosan with 90% DDA compared to a 100% activity in the presence of chitosan with 70% DDA.Citation29,Citation30 However, despite a lower activity when degrading high DDAs chitosan (>90%), Streptomyces griseus chitosanase is a powerful tool for nucleic acid recovery from chitosan nanoparticules bearing different DDAs, as shown in this study. Our results show a dramatic enhancement in RNA yield and integrity when treating cells with S. griseus chitosanase for 60 minutes prior to extraction. In addition, RNA yields from transfected cells are similar to those of nontransfected cells, suggesting a total recovery of RNA from chitosan transfected cells. Furthermore, our results show that a 30 minute treatment can be sufficient to improve total RNA yield, thus reducing sample processing time.
Although guanidium thiocyanate is a potent chaotropic agent that alters dimensional structures of proteins including endonucleases,Citation31 its concentration in RA1 lysis buffer does not seem to alter the function of this specific chitosanase. This observation is supported by the fact that some chitosanases are resistant to the high concentration of denaturants such as urea or guanidium thiocyanate.Citation32–Citation34 The chitosanase treatment of DPP-IVODN/chitosan polyplexes permitted the recovery of ∼90% of the complexes ODN showing that the digestion of the low MW chitosan (92–10–5) into smaller monomers did not interact with ODN release nor with silica-based matrices for RNA purification.
This new method has permitted us to obtain enough RNA with high integrity numbers to perform subsequent real-time RT-PCR and analysis. Our results revealed an 80% silencing of the DPP-IV gene with chitosan/siRNA when compared to nontransfected cells. Furthermore, silencing using this specific formulation achieved comparable efficiencies to the positive control Dharmafect™1 liposome, suggesting the potential use of these chitosan formulations to deliver siRNA both in vitro and in vivo. The HT-29 cell line was found to be more difficult to transfect with the specific chitosan/siRNA formulation, in particular at the cell uptake level as determined by FACS and confocal microscopy (data not shown). This observation is supported by the fact that chitosan has shown cell type dependency when transfecting DNA plasmid.Citation35
The silencing effect was also observed at the protein level where we observed a decrease in DPP-IV levels of approximately 55%, 48 hours post transfection (data not shown) demonstrating the ability of the specific chitosan formulation to efficiently deliver siRNA against DPP-IV mRNA. The FACS analysis of DPP-IVODN positive cells showed approximately 80% transfection efficiency following chitosanase treatment. The latter permitted a reduction of ∼10% in transfection efficiency when compared to the chitosanase untreated cells. The 10% signal bias is possibly due to the membrane-bound chitosan as supported by confocal imaging. Therefore, this reduction may account for biased data, hence increasing accuracy of transfection efficiency quantification.
Conclusion
In this study, we have demonstrated the following: i) mRNA is difficult to extract from chitosan/siRNA-transfected cells for subsequent quantification of gene expression; ii) a relatively simple and inexpensive technique based on enzymatic digestion of chitosan permits the extraction and recovery of total RNA for subsequent quantification of messenger levels by qPCR; and iii) the method described is suitable for the removal of membrane bound chitosan for FACS analysis of transfection efficiency when using labeled siRNA or ODNs, as a result reducing false positive data. Thus, this new method permits the quantification of gene silencing in chitosan delivery systems and eliminates any bias associated with chitosan binding to polynucleotides.
Acknowledgements
This work was supported by the Canadian Institutes of Health Research (CIHR) and the National Science and Engineering Research Council (NSERC). The authors thank the members of Professor Buschmann Research Group for their assistance.
Disclosure
The authors report no conflicts of interest in this research.
References
- IllumLChitosan and its use as a pharmaceutical excipientPharm Res199815132613319755881
- HuangMKhorELimLYUptake and cytotoxicity of chitosan molecules and nanoparticles: effects of molecular weight and degree of deacetylationPharm Res20042134435315032318
- ZhangHNeauSHIn vitro degradation of chitosan by a commercial enzyme preparation: effect of molecular weight and degree of deacetylationBiomaterials2001221653165811374467
- PregoCTorresDAlonsoMJChitosan nanocapsules as carriers for oral peptide delivery: effect of chitosan molecular weight and type of salt on the in vitro behaviour and in vivo effectivenessJ Nanosci Nanotechnol200662921292817048499
- PregoCFabreMTorresDAlonsoMJEfficacy and mechanism of action of chitosan nanocapsules for oral peptide deliveryPharm Res20062354955616525861
- PregoCTorresDFernandez-MegiaENovoa-CarballalRQuinoaEAlonsoMJChitosan-PEG nanocapsules as new carriers for oral peptide delivery. Effect of chitosan pegylation degreeJ Control Release200611129930816481062
- JeanMSmaouiFLavertuMChitosan-plasmid nanoparticle formulations for IM and SC delivery of recombinant FGF-2 and PDGF-BB or generation of antibodiesGene Ther2009161097111019440230
- CentellesMNIsasiJRQianCCampaneroMAIracheJMInfluence of the chitosan nature on the transfection efficacy of DNA-loaded nanoparticles after hydrodynamic administration in miceJ Microencapsul2152010[Epub ahead of print].
- ZhengFShiXWYangGFChitosan nanoparticle as gene therapy vector via gastrointestinal mucosa administration: results of an in vitro and in vivo studyLife Sci20078038839617074366
- ZhengYYangWWangCNanoparticles based on the complex of chitosan and polyaspartic acid sodium salt: preparation, characterization and the use for 5-fluorouracil deliveryEur J Pharm Biopharm20076762163117533123
- LavertuMMethotSTran-KhanhNBuschmannMDHigh efficiency gene transfer using chitosan/DNA nanoparticles with specific combinations of molecular weight and degree of deacetylationBiomaterials2006274815482416725196
- HowardKARahbekULLiuXRNA interference in vitro and in vivo using a novel chitosan/siRNA nanoparticle systemMol Ther20061447648416829204
- FutamiKKumagaiEMakinoHAnticancer activity of RecQL1 helicase siRNA in mouse xenograft modelsCancer Sci2008991227123618422747
- GaoSDagnaes-HansenFNielsenEJThe effect of chemical modification and nanoparticle formulation on stability and biodistribution of siRNA in miceMol Ther2009171225123319401674
- BustinSAQuantification of mRNA using real-time reverse transcription PCR (RT-PCR): trends and problemsJ Mol Endocrinol200229233912200227
- GinzingerDGGene quantification using real-time quantitative PCR: an emerging technology hits the mainstreamExp Hematol20023050351212063017
- FleigeSWalfVHuchSPrgometCSehmJPfafflMWComparison of relative mRNA quantification models and the impact of RNA integrity in quantitative real-time RT-PCRBiotechnol Lett2006281601161316900335
- FleigeSPfafflMWRNA integrity and the effect on the real-time qRT-PCR performanceMol Aspects Med20062712613916469371
- PfafflMWA new mathematical model for relative quantification in real-time RT-PCRNucleic Acids Res200129e4511328886
- ArochoAChenBLadanyiMPanQValidation of the 2-ΔΔCt calculation as an alternate method of data analysis for quantitative PCR of BCR-ABL P210 transcriptsDiagn Mol Pathol200615566116531770
- TchemtchouaVTAtanasovaGAqilADevelopment of a procedure to simultaneously isolate RNA, DNA, and proteins for [corrected] characterizing cells invading or cultured on chitosan scaffoldsAnal Biochem200939314514719538933
- GambinoGPerroneIGribaudoIA Rapid and effective method for RNA extraction from different tissues of grapevine and other woody plantsPhytochem Anal20081952052518618437
- SkrypinaNATimofeevaAVKhaspekovGLSavochkinaLPBeabealashvilliRTotal RNA suitable for molecular biology analysisJ Biotechnol20031051914511905
- MacRaeEExtraction of plant RNAMethods Mol Biol2007353152417332630
- GeorgeMAbrahamTEPolyionic hydrocolloids for the intestinal delivery of protein drugs: alginate and chitosan – a reviewJ Control Release200611411416828914
- QiagenRNeasy mini handbook4th ed2004
- HoemannCDSunJChrzanowskiVBuschmannMDA multivalent assay to detect glycosaminoglycan, protein, collagen, RNA, and DNA content in milligram samples of cartilage or hydrogel-based repair cartilageAnal Biochem200230011011743684
- MaPLLavertuMWinnikFMBuschmannMDNew insights into chitosan-DNA interactions using isothermal titration microcalorimetryBiomacromolecules2009101490149919419142
- TanabeTMorinagaKFukamizoTMitsutomiMNovel chitosanase from Streptomyces griseus HUT 6037 with transglycosylation activityBiosci Biotechnol Biochem20036735436412728998
- JungHSSonJWJiHSKimKEffective Production of Chitinase and Chitosanase by Streptomyces griseus HUT 6037 Using Colloidal Chitin and Various Degrees of Deacetylation of ChitosanBiotechnot Bioprocess Eng199942631
- MasonPENeilsonGWDempseyCEBarnesACCruickshankJMThe hydration structure of guanidinium and thiocyanate ions: implications for protein stability in aqueous solutionProc Natl Acad Sci U S A20031004557456112684536
- CockleSAEpandRMMoscarelloMAResistance of lipophilin, a hydrophobic myelin protein, to denaturation by urea and guanidinium saltsJ Biol Chem197825380198026711734
- EkowatiCHariyadiPWitartoABHwangJKSuhartonoMTBiochemical characteristics of chitosanase from the Indonesian Bacillus licheniformis MB-2Mol Biotechnol2006339310216757796
- YoonHGKimHYLimYHThermostable chitosanase from Bacillus sp. Strain CK4: cloning and expression of the gene and characterization of the enzymeAppl Environ Microbiol2000663727373410966383
- MaoHQRoyKTroung-LeVLChitosan-DNA nanoparticles as gene carriers: synthesis, characterization and transfection efficiencyJ Control Release20017039942111182210