
Abstract
Semiquantitative and rapid detection of specific IgE (sIgE) with well clinical relevance to house dust mite (HDM) are promising for prevalence rhinitis and asthma patients due to the increasing air pollution. However, the conventional IgE measurement systems are time-consuming, complicated and require special instruments. Herein, we overcome the above limitations of sIgE to HDM detection system by developing a quantum dot nanobeads-based lateral flow immunoassay and an image analysis procedure. The proposed detection system could semiquantitatively measure the IgE in a linear range of 0.2–10 U/mL. Moreover, there is a well correlation between the developed detection system and the clinical symptoms by a comparison study using 56 positive patients’ sera and 40 healthy control sera. The proposed detection system is simple, robust and easy-to-use and promising for in home test.
Introduction
House dust mites (HDMs) are the most important source of indoor allergens.Citation1,Citation2 According to the clinical reports from China,Citation3,Citation4 HDM allergens are the main cause of sensitization in patient with chronic allergic rhinitis. Reliable diagnosis of HDM allergy is based on the combination of patient’s history, skin testing and laboratory tests for the detection of specific IgE (sIgE) to HDM. Compared to the in vivo skin testing, in vitro measurement of sIgE with immunoassay is more versatile with high throughput and less side effects on patients.
The identification of sIgE responsible for the clinical symptoms is a costly and lengthy procedure. The methodology for the measurement of sIgE has evolved in recent years.Citation5 Various immunoassays, including enzyme-linked immunosorbent assay,Citation6 the Radio Allergo Sorbent Test,Citation7 and high capacity solid phase test, for example, ImmunoCAP of Phadia,Citation8,Citation9 are currently used for the diagnosis of allergies and have shown satisfactory sensitivity and specificity to detect IgE in human serum. However, the above-mentioned assays are time-consuming, require large quantities of serum samples and need complicated instrumental system, and can only be performed in clinical central laboratory. Recently, rapid assays for the detection of sIgE as point-of-care test diagnostic tools have been developed using various strategies.Citation10 The Allergy Lateral Flow Assay (Dr FookeLaboratorien GmbH, Neuss, Germany) combines the advantage of lateral flow immunoassay (LFIA) with the flexibility of choosing different allergens,Citation11,Citation12 such as cat epithelia (e1), Dermatophagoides pteronyssinus (d1), Alternaria alternata (m6) and birch pollen (t3).
However, traditional LFIACitation13 using gold nanoparticles as label only can give a qualitative, positive or negative, test results and generally used for analyzing high concentration of analyte. The above limitations of conventional LFIA have motivated the development of other labels instead of gold nanoparticles, including color latex,Citation14 magnetic nanoparticlesCitation15 and various fluorescent reporters.Citation16,Citation17 Especially, fluorescent reporters, such as time-resolved fluorescent nanoparticles,Citation17 upconverting phosphorCitation18,Citation19 and quantum dots (QDs),Citation16,Citation20,Citation21 have attracted more attention due to the sensitivity, quantitative results and potential for multiplexing.
QDs,Citation22,Citation23 also known as semiconductor nanocrystals, are a promising fluorescent label due to their unique optical properties, such as high quantum yields, robust photostability and tunable emission peak. QDs-based LFIAs are frequently reported in recent literature and are used for detection of tumor markers,Citation24 toxinsCitation16,Citation25 and virus.Citation26 Mostly, the quantitative measurements were achieved by a specific commercialCitation21 or home-madeCitation20,Citation24 fluorescent strip reader. Moreover, single QD used as molecule label is not robust enough for high-sensitive immunoassay. Encapsulation of numerous QDs in one nanobead can largely improve the detection sensitivity of immunoassay,Citation27–Citation29 and has been used for the high-sensitive fluorescent LFIA.
In this study, we developed a fluorescent LFIA using QD nanobeads (QDNs) as label, and an image analysis strategy was developed for semiquantitative measurement of sIgE to HDM. Using this image processing strategy, the special fluorescent strip reader is replaced by a common digital camera for achieving a semiquantitative immunoassay. Furthermore, the proposed IgE detection strategy was verified with clinical sera samples and was well correlated with the clinical symptoms.
Material and methods
Materials and instruments
Carboxyl-capped fluorescent nanobeads embedded with CdSe/ZnS QDs (QBC610) were obtained from Kundao Biotech (Shanghai, China). HDM natural D. pteronyssinus allergen 1 (nDer p 1) was purchased from Indoor Biotechnologies (Cardiff, UK). Goat anti-human IgE antibody, bovine serum albumin (BSA) and N-(3-dimethylaminopropyl)-N′-ethylcarbodiimide hydrochloride (EDC) were provided by Sigma-Aldrich (Darmstadt, Germany). The rabbit IgG, nitrocellulose membrane, sample pad, adhesion plastic back sheet and adsorption pad were obtained from Shanghai Kinbio Tech Co. Ltd (Shanghai, China).
Absorption (Ab) spectra were acquired with an ultraviolet visible (UV-Vis) spectrophotometer (UV-2450; Shimadzu, Kyoto, Japan), and fluorescent spectra were recorded on a fluorescence spectrometer (LS-55; PerkinElmer, Waltham, MA, USA). The morphology and size of QDs were analyzed with a transmission electron microscope (TEM; H-7650, Hitachi, Tokyo, Japan) at an accelerating voltage of 100 kV. The hydrodynamic diameters and size distribution of QDNBs were determined by a dynamic light scattering (DLS) system (Zetasizer Nano ZS; Malvern Instruments Ltd, Malvern, UK). The elemental analysis of QDNs were performed using scanning electron microscopy (S-3500, Hitachi) equipped with an energy-dispersive X-ray (EDX) spectrometer (Link ISIS 300; Oxford Instruments, Oxford, UK).
Preparation of QDNs/antibody conjugates
Goat anti-human IgE antibody was conjugated onto QDNs according to vendor’s instruction. Briefly, 100 μL of QDNs (10 mg/mL) was diluted in 500 μL of reaction buffer (10 mM PBS, pH 7.4). Fifty microliters of goat anti-human IgE antibody (1 mg/mL) was dissolved in reaction buffer and incubated for 0.5 h at room temperature with rotation. Solution of 10 mM EDC in phosphate buffer (pH 6.0) was prepared immediately before use. Fifty-five microliters of EDC solution was added into the mixture and incubated at room temperature for another 1 h. Then, 60 μL of BSA (10 wt%) in PBS-T (0.05% Tween 20) buffer was added and incubated for another 1 h to block the activated sites on the surface of QDNs. The resulting mixture was purified by centrifugation at 10,000 rpm for 10 min and washed with PBS with Tween 20 (PBST) for 3 times. The QDNs/antibody conjugates were collected and dispersed in 100 μL of PBST buffer with 1% BSA.
Fabrication of lateral flow test strips
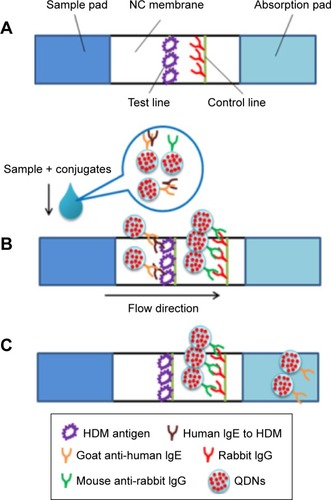
The main components of lateral flow test strips including a sample pad, a nitrocellulose membrane and an absorbent pad were assembled on a plastic backing pad, as illustrated in . First, the nitrocellulose (NC) membrane was laminated and pasted to the plastic back sheet. Then, the test line was prepared by dispersing nDer p 1 protein in PBS (10 mM, pH 7.4) solution at concentration of 0.8 mg/mL. The rabbit IgG in PBS (10 mM, pH 7.4) was immobilized at concentration of 1 mg/mL as control line. After protein immobilization, the NC membrane was dried at 37°C for 1 h. The sample pad and absorbent pad were sequentially laminated and pasted on the back sheet with proper overlaps to ensure that the test solution could migrate through the test strip. The whole assembled strip card was cut into strips with 3 mm width and assembled into the plastic card. The strips were stored at room temperature in a sealed bag with desiccant.
Figure 1 Schematic illustration the structure of QDNs-based LFIA test strip (A) and the detection of IgE to HDM using QDNs-based LFIA with positive (B) and negative (C) result.
Abbreviations: HDM, house dust mite; LFIA, lateral flow immunoassay; NC, nitrocellulose; QDNs, quantum dot nanobeads.
Detection principle and test procedure
The prepared QDNs/anti-IgE antibody conjugates and QDNs/anti-rabbit IgG antibody conjugates were, respectively, diluted into PBST buffer with 1% BSA at concentration of 10 and 5 μg/mL. To perform the fluorescent immunoassay, 10 μL of patient serum was added into 200 μL of QDNs conjugates solution. After thoroughly mixing, 80 μL of the fluorescent solution was dropped onto the sample hole and reacted for 10 min. Then, the fluorescent images of the lateral flow strips were obtained under ultraviolet light illumination with a digital camera (Canon G12; Canon Inc., Tokyo, Japan). Semiquantitative analysis of fluorescent images was performed by ImageJ,Citation30 free image processing software (ImageJ, National Institute of Health; Bethesda, Maryland, USA).
Sera collection
Fasting venous blood (5 mL) was collected from 56 rhinitis or asthma patients diagnosed by the First Affiliated Hospital of Harbin Medical University. The study population included 40 females and 16 males, aged 19–56 years (mean age 33.6±12.1 years), who had never received specific immunotherapy against HDM. All patients were tested with PhadiaImmunoCAP for allergy to HDM. Serum was separated from each sample, and then stored at -80°C for future use. Skin test reactions were evaluated based on the mean wheal diameter at 15 min after application of the extract, considering values >3 mm as a positive result. Forty healthy subjects without rhinitis or asthma and with negative skin tests to HDM were included as controls (control group). Human subject research was approved by the Institutional Review Board of The First Affiliated Hospital of Harbin Medical University. Participants signed an informed consent before the experiment, and the information of the volunteers was kept confidential.
Results and discussion
Characterization of QDNs and QDNs-antibody conjugates
Highly luminescent CdSe/ZnS QDs were incorporated into polymer nanobeads by the emulsion–evaporation process. As shown in , from the TEM image of the fluorescent nanobeads, many dark dots are presenting in the composite nanobeads. These dark dots are QDs, which can be visibly identified from the polymer matrix because of the different electron penetrability between QDs and polymer. Furthermore, in the enlarged TEM image, as shown in , the crystal lattice of nanocrystals observed in the dark dots also confirmed that the QDs were successfully enclosed in the polymer nanobeads. As shown in Figure S1, EDX spectrum from single QDN reveals peaks corresponding to S, Zn, Se and Cd, which also indicated that QDs were encapsulated in the nanobeads. The size of nanobeads calculated from TEM images is ~183 nm, which is a little smaller than the size 204 nm measured by DLS (). Using these nanobeads for antibody conjugation, the ratio of QD/antibody can be largely increased by encapsulation of many QDs in one nanobead, and thus the sensitivity of QDNs/antibody conjugates can be increased compared with QDs/antibody conjugates. At the same time, the size distribution of QDNs was measured by DLS and the polydispersity index of nanobeads is 0.06 (<0.1), indicating the narrow size distribution of nanobeads.
Figure 2 Characterization of QDNs and QDNs/antibody conjugates.
Notes: (A) TEM images of QDNs and (B) quantum dot embedded in the polymer composite nanobead. (C) Size and size distribution of QDNs and QDNs/antibody conjugate analyzed by the dynamic light scatting. The comparison of the adsorption (D) and fluorescent (E) spectra of QDNs and QDNs/antibody conjugates.
Abbreviations: TEM, transmission electronic microscopy; QDNs, quantum dot nanobeads; PL, photoluminescence.
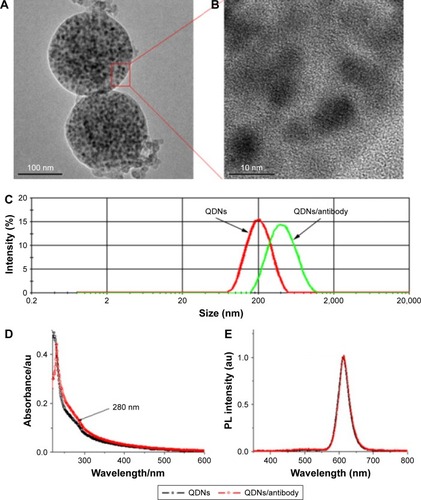
The goat anti-human IgE antibodies were covalently conjugated with QDNs by coupling the carboxyl groups on the surface of QDNs and the amino groups in the antibodies molecule using the carbodiimide chemistry. To confirm the successful conjugation of antibodies on the QDNs, both DLS and UV-Vis absorbance spectra () were performed to compare the free QDNs and QDNs/antibody conjugates. The average hydrodynamic diameter of QDNs-antibody conjugate increased from 204 to 413 nm after the anti-human IgE antibody conjugation. In addition, the increased absorbance of QDNs/antibody conjugates at 280 nm attributed to the antibody indicated that antibody was conjugated with QDNs. Moreover, the fluorescence spectrum of QDNs also presents a bright and narrow fluorescent peak at 610 nm. Nearly, no difference of fluorescent spectra between the QDNs and QDNs/antibody indicates that there is negligible influence on the fluorescent properties of QDNs in the antibody conjugation process ().
Detection procedure using QDNs-based LFIA
As shown in , the test strip composed of sample pad, nitrocellulose membrane, absorption pad and plastic back sheet. The test line and control line immobilized with nDer p 1 protein and rabbit IgG were, respectively, prepared on the NC membrane area. QDNs/anti-IgE antibody conjugates and QDNs/anti-rabbit IgG antibody conjugates were both diluted in the buffer at optimized concentration. The test was started by adding the sample in the QDNs conjugates solution. Then, aliquot reaction mixture was loaded on the sample pad and migrated through the NC membrane by the capillary effect. If human IgE specific to HDM presented in the sample, the formed QDNs/anti-IgE/IgE complex would be captured by the mite antigen on the test line, as shown in . The amount of QDNs accumulated on the test line is proportional to the concentration of sIgE in the sample, and the fluorescent intensity of QDNs on the test line can be correlated with the IgE concentration. The QDNs/anti-rabbit used as a control signal would be captured by rabbit IgG on the control line with consistent intensity because the interaction between QDNs/anti-rabbit IgG and rabbit IgG is independent to the concentration of human IgE to HDM. The sample was considered positive when two fluorescent lines appeared both in the test zone and control zone. For the negative sample, QDNs/anti-IgE would not be captured on the test line, as shown in , and only control line appeared. If there were no QDNs accumulating on the control line, the test strip was invalid and should be discarded.
Semiquantitative detection of IgE to HDM by image analysis
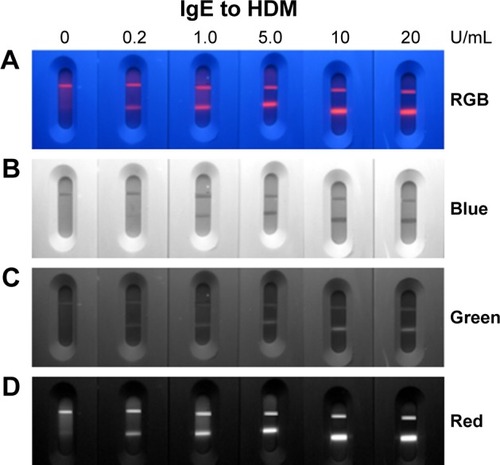
Several high-value sera of IgE to HDM measured by ImmnoCAP were pooled together and used as positive sample to establish a standard curve. Five sera with different concentration of IgE to HDM, ranging from 0.2 to 20 IU/mL, were prepared by diluting the high-value serum with physiological salt solution (NaCl 8.5 g/L). Physiological salt solution was used as the control. The test results were record by a digital camera under UV light illumination, as shown in . Obviously, as low as 0.2 U/mL IgE to HDM could be read with naked eyes under UV light illumination. For semiquantitative analysis of the detection results, the obtained RGB color images were split into blue, green and red channel images by the ImageJ software, as shown in . Through the color channel splitting processing, the test results are more clearly presented in the red channel images compared with the RGB, blue channel and green channel images. The red channel images were more effective to read the test line signal because the red color QDNs with emission peak at 610 nm were used as label. If green emission QDNs were used as label, the green channel images should be chosen. Thus, this image analysis processing is versatile for all color of fluorescent labels and promising for multiplexed assay.
Figure 3 RGB color fluorescent images for the detection of a serial dilution of sera human IgE to HDM for 0, 0.2, 1.0, 5.0, 10 and 20 U/mL (A).
Notes: The blue (B), green (C) and red (D) channel images by splitting the RGB color images.
Abbreviation: HDM, house dust mite.
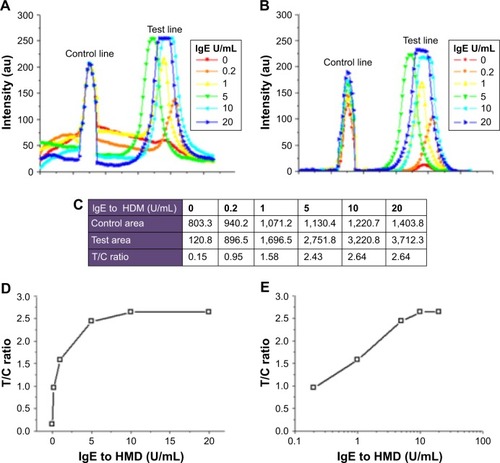
Moreover, the pixel intensity distribution of the NC membrane region was obtained from the “plot profile” of a line across the test and control area. The intensity distributions of each test were, respectively, analyzed and shown in . Then, the baseline of the intensity distribution was further subtracted to minimize the background signal influence, and the processed results were presented in . The semi-quantitative results were listed in by respective integration of control and test area. Due to the consistent control line intensity, the test line/control line (T/C) ratio was used as the test reporting signal. The standard curve was plotted, as shown in , by relating the known concentration of IgE to the corresponding T/C ratio. The linear regression equation was y =0.445 ln (x) +1.646, with a correlation coefficient (R2) of 0.997 (). This equation was fitted to be linear from 0.2 to 10 IU/mL. The IgE concentrations of patient sera could be calculated by the above equation, and T/C ratio was also obtained by the above-mentioned process.
Figure 4 Pixel intensity distributions of strips across the test area (A) and after baseline subtracting (B). The T/C ratio calculated from the integration of the control and test area, and their relation to the concentration of IgE (C). The standard curve of QDNs-based LFIA for the detection of IgE to HDM was obtained by plotting the T/C ratio against IgE concentration (D) and logarithm of IgE concentration (E).
Abbreviations: HDM, house dust mite; LFIA, lateral flow immunoassay; QDNs, quantum dot nanobeads; T/C, test line/control line.
Sera sample test
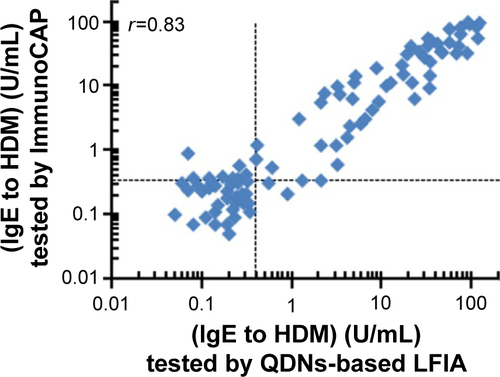
The developed QDNs-based LFIA strips and data analysis strategy were used to explore the feasibility of detecting the clinical samples. Sera collected from rhinitis or asthma patients had been determined with ImmunoCAP assay, and the sera with positive test results were used to evaluate our QDNs-based LFIA. The IgE-negative sera were selected from persons without rhinitis or asthma and with negative skin tests to HDM. The cutoff value of 0.4 U/mL of QDNs-based LFIA was calculated from the 40 control samples. The test comparative results were summarized in . For the positive sera, the prepared QDNs-based LFIA presents a satisfactory positive coincidence rate 92.9% (52/56). In addition, as shown in Figure S2, the Spearman correlation coefficient for QDNs-based LFIA versus ImmunoCAP was 0.83 and demonstrated a good quantitative agreement for the detection of sIgE to HDM. It indicated that our prepared QDNs-based LFIA and data analysis strategy are promising for accurate and reliable detection of human IgE to HDM. Compared with ImmunoCAP allergy IgE analysis system, the QDNs-based LFIA is rapid and complicated instrument is not required. It is a promising diagnosis tool in the resource-limited areas and at home point-of-care test.
Table 1 Sera test results of human IgE to HDM obtained by QDNs-based LFIA compared with that obtained by ImmunoCAP test system
Conclusion
A semiquantitative rapid test was developed to detect IgE to HDM combined with lateral flow test strips and an image analysis strategy. The QDNs-based LFIA test results are well correlated with the ImmunoCAP assay results with a satisfactory positive coincidence rate 92.9%. Using the developed image analysis strategy and a digital camera, the specific instrument for test strips analysis is not needed anymore. Considering their rapid detection, accurate clinical relevance and low cost, the proposed QDNs-based LFIA shows promising as a semiquantitative point-of-care test used for rural areas and in-home self-test.
Disclosure
The authors report no conflicts of interest in this work.
Supplementary materials
Figure S1 Typical SEM and EDX spectrum of quantum dots nanobeads.
Abbreviations: EDX, energy-dispersive X-ray; SEM, scanning electron microscopy.
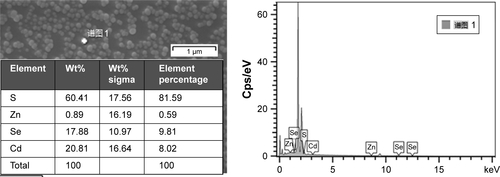
Figure S2 Comparison of QDNs-based LFIA with ImmunoCAP for the detection of sIgE to HDM.
Abbreviations: HDM, house dust mite; LFIA, lateral flow immunoassay; QDNs, quantum dot nanobeads; sIgE, specific IgE.
References
- HussKAdkinsonNFJrEgglestonPADawsonCVan NattaMLHamiltonRGHouse dust mite and cockroach exposure are strong risk factors for positive allergy skin test responses in the Childhood Asthma Management ProgramJ Allergy Clin Immunol20011071485411149990
- Platts-MillsTARakesGHeymannPWThe relevance of allergen exposure to the development of asthma in childhoodJ Allergy Clin Immunol20001052 Pt 2S503S50810669532
- ZhangCGjesingBSpangfortMDXuJZhongNThe allergen-specific IgE reactivity pattern of Chinese house dust mite allergic patientsAllergy200863121640164119032239
- LiJSunBHuangYA multicentre study assessing the prevalence of sensitizations in patients with asthma and/or rhinitis in ChinaAllergy20096471083109219210346
- Bacarese-HamiltonTMezzasomaLInghamCDetection of allergen-specific IgE on microarrays by use of signal amplification techniquesClin Chem20024881367137012142398
- TromboneAPTobiasKRFerrianiVPUse of a chimeric ELISA to investigate immunoglobulin E antibody responses to Der p 1 and Der p 2 in mite-allergic patients with asthma, wheezing and/or rhinitisClin Exp Allergy20023291323132812220471
- WideLBennichHJohanssonSGDiagnosis of allergy by an in-vitro test for allergen antibodiesLancet196727526110511074168552
- LeimgruberAMosimannBClaeysMClinical evaluation of a new in-vitro assay for specific IgE, the immuno CAP systemClin Exp Allergy19912111271312021870
- JohanssonSGImmunoCAP Specific IgE test: an objective tool for research and routine allergy diagnosisExpert Rev Mol Diagn20044327327915137895
- WenH-WBorejsza-WysockiWDeCoryTRDurstRADevelopment of a competitive liposome-based lateral flow assay for the rapid detection of the allergenic peanut protein Ara h1Anal Bioanal Chem200538251217122615977030
- PfenderNLucassenROffermannNSchulte-PelkumJFookeMJakobTEvaluation of a novel rapid test system for the detection of specific IgE to Hymenoptera VenomsJ Allergy (Cairo)2012201286202322500188
- LucassenRSchulte-PelkumJCsuvarszkiCKleine-TebbeJFookeMMahlerMEvaluation of a novel rapid test system for the detection of allergic sensitization to Timothy Grass Pollen against established laboratory methods and skin prick testJ Allergy (Cairo)2010201052408420948879
- Posthuma-TrumpieGAKorfJvan AmerongenALateral flow (immuno)assay: its strengths, weaknesses, opportunities and threats. A literature surveyAnal Bioanal Chem2009393256958218696055
- DanksCBarkerIOn-site detection of plant pathogens using lateral-flow devicesEPPO Bulletin2000303–4421426
- LiuCJiaQYangCLateral flow immunochromatographic assay for sensitive pesticide detection by using Fe3O4 nanoparticle aggregates as color reagentsAnal Chem201183176778678421793540
- BerlinaANTaranovaNAZherdevAVVengerovYYDzantievBBQuantum dot-based lateral flow immunoassay for detection of chloramphenicol in milkAnal Bioanal Chem2013405144997500023494278
- XiaXXuYZhaoXLiQLateral flow immunoassay using europium chelate-loaded silica nanoparticles as labelsClin Chem200955117918218974359
- HamplJHallMMuftiNAUpconverting phosphor reporters in immunochromatographic assaysAnal Biochem2001288217618711152588
- QuQZhuZWangYRapid and quantitative detection of Brucella by up-converting phosphor technology-based lateral-flow assayJ Microbiol Methods200979112112319635504
- ZhangXLiDWangCA CCD-based reader combined quantum dots-labeled lateral flow strips for ultrasensitive quantitative detection of anti-HBs antibodyJ Biomed Nanotechnol20128337237922764406
- LiZWangYWangJTangZPoundsJGLinYRapid and sensitive detection of protein biomarker using a portable fluorescence biosensor based on quantum dots and a lateral flow test stripAnal Chem201082167008701420704391
- MedintzILUyedaHTGoldmanERMattoussiHQuantum dot bio-conjugates for imaging, labelling and sensingNat Mater20054643544615928695
- ChanWCWNieSQuantum dot bioconjugates for ultrasensitive nonisotopic detectionScience19982815385201620189748158
- YangQGongXSongTQuantum dot-based immunochromatography test strip for rapid, quantitative and sensitive detection of alpha fetoproteinBiosens Bioelectron201130114515021963096
- QuHZhangYQuBRapid lateral-flow immunoassay for the quantum dot-based detection of puerarinBiosens Bioelectron20168135836226991602
- ChengSSunJYangJA new immunoassay of serum antibodies against Peste des petits ruminants virus using quantum dots and a lateral-flow test stripAnal Bioanal Chem2017409113314127783124
- BaiYTianCWeiXWangYWangDShiXA sensitive lateral flow test strip based on silica nanoparticle/CdTe quantum dot composite reporter probesRSC Advances20122517781781
- RenMXuHHuangXImmunochromatographic assay for ultrasensitive detection of aflatoxin B1 in maize by highly luminescent quantum dot beadsACS Appl Mater Int20146161421514222
- ZhouCYuanHShenHSynthesis of size-tunable photoluminescent aqueous CdSe/ZnS microspheres via a phase transfer method with amphiphilic oligomer and their application for detection of HCG antigenJ Mater Chem2011212073937400
- SchneiderCARasbandWSEliceiriKWNIH Image to ImageJ: 25 years of image analysisNat Methods20129767167522930834