
Abstract
Protein-related nanotheranostic agents hold great promise as tools to serve many clinical applications. Proteins such as BSA are used to regulate the synthesis of nondegradable inorganic nanoparticles (NPs). To fully employ the potential of such proteins, a new type of biosafe nanotheranostic agent must be designed to optimize BSA as a biomineralization agent. Here, a straightforward BSA-assisted biomineralization method was developed to prepare gallic acid (GA)–Fe(III) coordination polymer NPs. BSA-coated GA-Fe (GA-Fe@BSA) NPs were ultrasmall (3.5 nm) and showed good biocompatibility, a lower r2:r1 ratio (1.06), and strong absorption in the visible near-infrared region. T1-weighted magnetic resonance imaging of tumor-bearing mice before and after intratumoral injection with GA-Fe@BSA NPs definitively demonstrated positive change. In a subsequent in vivo study, antitumor activity was precipitated by intratumoral injection of GA-Fe@BSA NPs combined with laser treatment, suggesting excellent outcomes with this treatment method. These results describe a successful protocol in which BSA regulated the synthesis of benign organic polymer NPs. GA-Fe@BSA NPs have the potential to be ideal agents to be used in clinical theranostic nanoplatforms.
Introduction
Nanotheranostic agents have attracted much interest, given the potential of nanoengineering for cancer detection and treatment.Citation1 This is especially true of those agents that integrate both imaging and therapeutic functions into one nanoparticle (NP).Citation2,Citation3 The development of nanotheranostic agents can be classified into two categories: inorganic and organic.Citation4 Inorganic nanotheranostic agents, including noble metals,Citation5,Citation6 semiconductor NPs,Citation7,Citation8 and carbon materials,Citation9–Citation11 are studied extensively, as they are highly stable and have multifunctional properties. However, inorganic materials do not degrade, and long-term retention in the body limits their clinical use for cancer treatments,Citation12 since agents must completely clear the body within a reasonable period to receive regulatory approval from the US Food and Drug Administration (FDA).Citation13 Given the pitfalls of inorganic materials, an increasing number of organic nanotheranostic platforms are under intense investigation. Organic platforms contain benign ingredients and are easily degraded,Citation14–Citation16 thus offering higher biological compatibility.Citation17,Citation18 Indeed, several protein-related theranostic agents have been approved by the FDA for clinical use, including the albumin–paclitaxel NP Abraxane (nab-paclitaxel; Celgene, Summit, NJ, USA).Citation19,Citation20 Therefore, the development of degradable organic and protein-related nanotheranostic agents holds great promise for clinical applications.
Proteins, such as HSA and BSA, are enriched in N-terminal amines and cysteine residues.Citation21 These sites exhibit strong coordination abilities with transition-metal ions, such as Au3+, Cu2+, Gd3+, and Bi3+.Citation22 Research has shown a significant difference between the functions of HSA and BSA.Citation23 The high homology and low cost of BSA makes it an appropriate research proxy for HSA. Therefore, BSA is widely used as a surfactant to control the synthesis of transition-metal ion-based NPs, a process similar to the biomineralization observed in nature.Citation24 BSA was first used by Burt et al to prepare gold NPs using direct conjugation methods.Citation25 Several kinds of noble metals,Citation26 metal alloys,Citation27 and metal sulfide NPsCitation28 have also been created using BSA as the surfactant. Recently, BSA was used as a nanoreactor to prepare theranostic agents.Citation22 This improved biological compatibility and controlled size. These agents achieved more efficient cancer-detection rates and better treatments in vivo. For example, cypate-grafted BSA-Gd2O3 NPs were applied to near-infrared (NIR) fluorescence/photoacoustic/magnetic resonance imaging (MRI) and photothermal therapy.Citation29 Also, BSA-stabilized Bi2S3 NPs have been used for single-photon-emission computed tomography/computed tomography/photoacoustic imaging-guided combined photothermal and radiotherapies.Citation28 Nevertheless, BSA is typically designed to regulate the synthesis of nondegradable inorganic NPs.Citation25–Citation29 Further research is required to determine the potential of BSA in preparation of a new kind of biological safety material, such as a coordination polymer.
Coordination polymer NPs, a nanoscale metal–organic framework, are considered an ideal platform for developing nanomedicine. These NPs have the combined advantages of both nanomaterial and organic complexes, eg, biodegradability, compositional diversity, and ease of preparation.Citation30 As such, it was important to investigate whether BSA were able to tune the synthesis of coordination polymer NPs by the formation of a BSA–transition metal ion complex. In this process, the transition-metal ions would play a similar role as inorganic NPs.Citation23 In a recent proof-of-concept experiment, gallic acid (GA)-Fe(III) coordination polymer NPs were explored as theranostic agents, given their strong absorbance in the NIR region and good MRI properties.Citation31,Citation32 Here, GA-Fe was used to investigate the role of BSA in tuning the synthesis of coordination polymer NPs.
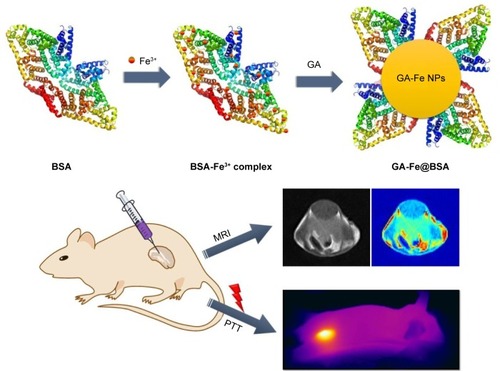
In this report, a straightforward BSA-assisted biomineralization method is described for the preparation of GA-Fe coordination polymer NPs (). The formation process of GA-Fe coordination polymer NPs consisted of two procedures. First, the BSA-Fe3+ complex was prepared. BSA is enriched in N-terminal amines and cysteine residues.Citation21 These sites strongly coordinate with transition-metal ions.Citation21 The BSA-Fe3+ complex was formed easily by thoroughly mixing an aqueous solution of BSA and FeCl3. Second, BSA-coated GA-Fe (GA-Fe@BSA) NPs were synthesized. GA monomers were mixed with the BSA-Fe3+ complex. GA-Fe@BSA NPs were formed by phenolic groups and carboxylic groups in GA chelating with Fe3+. GA-Fe@ BSA NPs were purified using ultrafiltration centrifugation to remove excess BSA. GA-Fe@BSA NPs were ultrasmall (3.5 nm) and showed good biocompatibility, lower r2:r1 ratio (1.06). and strong absorption in the visible NIR region. These properties made the GA-Fe NPs an excellent tool to enhance MRI diagnosis and photothermal therapy (). Results presented here describe a model that used BSA to regulate the synthesis of benign organic polymer NPs. They further support the potential of novel GA-Fe@BSA NPs as ideal agents for theranostic nanoplatform applications.
Materials and methods
Materials
GA (99%) and Fe(III) chloride hexahydrate were ordered from Sinopharm Chemical Reagent (Shanghai, China). BSA was ordered from Amresco (Solon, OH, USA). All reagents were used without further purification. Mouse selection, methods of care, welfare, and killing were approved by the animal ethics committee of Shanghai Normal University and in strict accordance with the policy of the Institutional Animal Care and Use Committee.
Synthesis of GA-Fe@BSA NPs
Using standard procedures, 66.6 mg BSA was dissolved into 9 mL deionized water with stirring to form a homogeneous solution. Aqueous FeCl3 solution (108.2 μL, 0.1 g/mL) was added dropwise. After being stirred for 30 minutes at room temperature, a yellow, homogeneous solution was formed. Next, GA aqueous solution (1.02 mL, 10 mg/mL) was added dropwise with vigorous stirring. After 3 hours’ incubation, GA-Fe@BSA NPs were collected using ultrafiltration centrifugation (polyether sulfone film) with a molecular weight cut point of 100 kDa at 3,500 rpm for 5 minutes, and then washed twice with water. The GA-Fe@BSA NPs were dissolved and stored in water at 4°C.
Characterization of GA-Fe@BSA NPs
Sizes and morphologies of the GA-Fe@BSA NPs were measured using atomic force microscopy (NanoScope IIa; Digital Instruments, Tonawanda, NY, USA). Fourier-transform IR (FT-IR) spectra were measured using potassium bromide pressed pellets on a Nicolet Avatar 370 FT-IR spectrophotometer. Visible NIR absorption spectra were gathered on a Beckman Coulter DU 730 ultraviolet (UV)-visible spectrophotometer using quartz cuvettes with an optical path of 1 cm. Hydration size was recorded using a Malvern Zetasizer Nano ZS. Iron-ion concentrations were calculated with high-dispersion inductively coupled plasma atomic emission spectroscopy (Prodigy; Teledyne Leeman Labs). Magnetic resonance relaxometry was carried out on an NMI20 Analyst (Niumag, Shanghai, China).
Measurement of photothermal performance
To determine the photothermal performance of GA-Fe@ BSA NPs, temperature changes were measured with different concentrations of GA-Fe@BSA NP aqueous mixtures (pure water, 0.03, 0.06, 0.12, 0.25, 0.5, and 1 mM) using an FLIR A300 thermal camera and 808 nm laser (1 W/cm2) ablation for 15 minutes. In photothermal stability tests, GA-Fe@BSA NP aqueous mixtures (1 mM) were treated with eight cycles of 15-minutes laser exposure followed by 15-minutes rest.
In vitro biocompatibility
The cytotoxicity of GA-Fe@BSA NPs was evaluated on human macrophages (Shanghai Institutes for Biological Sciences) using a CCK-8 assay (Beyotime, Haimen, China). For 12- and 24-hour exposure groups, 100 μL suspensions of human macrophages (105/mL) were seeded onto 96-well plates. Aliquots (100 μL) of PBS or media containing different concentrations of GA-Fe@BSA NPs (10, 25, 50, 100, 200 μM) were added. Cells were incubated for 12 or 24 hours. Next, 10 μL CCK-8 was introduced to each well. After 5 minutes’ incubation at 37°C, absorbance at 450 nm was recorded with a microplate reader (Varioskan Flash; Thermo Fisher Scientific).
Hemolysis assays were carried out on red blood cells (RBCs; obtained from healthy BALB/c nude mice 5−6 weeks old; Shanghai Laboratory Animal Center) to evaluate the biocompatibility of GA-Fe@BSA NPs. Briefly, 0.4 mL of packed RBCs (2% volume ratio) was added to 1 mL deionized water, PBS, or PBS mixtures containing concentrations of GA-Fe@BSA NPs (50, 100, 150, and 200 μM) in 1.5 mL polyethylene tubes. PBS and deionized water were used as positive and negative controls, respectively. After 1 hour’s incubation at 37°C, mixtures were centrifuged at 3,000 rpm for 5 minutes. Supernatant-absorbance measurements at 576 nm were taken with a Beckman Coulter DU 730 UV-visible spectrophotometer. Percentages of hemolysis were calculated using the equation (At – Anc)/(Apc – Anc) ×100%, where At, Apc and Anc are the absorbance of the test, positive controls, and negative controls, respectively, at 576 nm.
Cell-cycle assays were measured using a cell-cycle assay kit (Beyotime) with strict adherence to the manufacturer’s instructions. In brief, HEK293T cells (Shanghai Institutes for Biological Sciences) were plated onto a six-well plate at a density of 2×10⁵ cells/well overnight. Next, cells were treated with GA-Fe@BSA NPs for 24 hours at a 200 μM concentration. Cells were then harvested, washed twice with PBS, and analyzed with flow cytometry.
Routine blood tests were carried out to assess toxicity in GA-Fe@BSA NP-treated mice. Three healthy BALB/c mice (Shanghai Laboratory Animal Center) each received a single intravenous injection of saline (control) or GA-Fe@ BSA NPs (200 μL, 20 mM). After a 3-day incubation period, animals were humanely killed and dissected. Blood samples were collected from the mice and then separated into blood cells and plasma for routine blood analyses.
In vivo MRI studies
MRI was captured in live subjects using a 0.5 T MRI system (MiniMR-60; Niumag). For the biodistribution study, GA-Fe@BSA NP mixtures (150 μL, 20 mM) were administered to pathogen-free BALB/c nude mice 5−6 weeks old (Shanghai Laboratory Animal Center). Coronal scans were taken before and after NP injections (0.16, 2, 6, and 24 hours). For the tumor MRI study, GA-Fe@BSA NP mixtures (20 μL, 23 mM) were directly injected intratumorally into mammary carcinoma (4T1) tumor-bearing nude mice (Shanghai Institutes for Biological Sciences). Cross-sectional MRI scanned images were taken before and 1 hour after GA-Fe@BSA NP intratumoral injections.
In vivo photothermal ablation of cancer cells
Mammary carcinoma-tumor models were created by injecting 4T1 cells (Shanghai Institutes for Biological Sciences) into the right hind legs of BALB/c nude mice (5−6 weeks old, Shanghai Laboratory Animal Center). Tumor-bearing (0.5 cm) mice were randomly assigned to one of four groups (PBS alone, GA-Fe@BSA NPs alone, PBS + laser, and GA-Fe@BSA NPs + laser), with four tumor-bearing (0.5 cm) mice in each group. For the PBS and PBS + laser group, mice were injected intratumorally with PBS (20 μL). In the GA-Fe@BSA NPs and GA-Fe@BSA NPs + laser group, mice were intratumorally injected with GA-Fe@BSA NPs (20 μL, 15 mM). After a 2-hour incubation, the mice in PBS + laser and GA-Fe@BSA NPs + laser group were exposed to an 808 nm laser at 1 W/cm2 for 5 minutes. NIR thermal images from the groups receiving laser treatment were taken at time intervals after laser exposure. After photothermal therapy, one subject was killed and tumors evaluated for histopathology by H&E staining and for apoptosis rates with TUNEL stains. The tumor sizes of the rest of the subjects were recorded every day for 16 days.
Results and discussion
Synthesis and characterization of GA-Fe@BSA NPs
BSA, a low-cost and easily prepared protein, was investigated as a biomineralization agent to prepare metal–organic coordination polymer NPs. The GA-Fe complex was used as biocompatible metal–organic NPs by forming coordination bonds of phenoxide carboxylate groups and Fe3+. GA is a powerful antioxidant, and Fe3+ is a paramagnetic ion that is less toxic than Gd3+ and Mn2+.Citation31,Citation33 The synthesis method is illustrated in and Figure S1. First, BSA was dissolved in water. Then, Fe3+ was added to the BSA solution with agitation and the solution became yellow. Given that many amino-acid residues are components of BSA, BSA-Fe complexes were easily formed. In an FT-IR spectrum analysis, the characteristic peak signifying a stretching Fe-O bond appeared at 612 cm−1, suggesting the formation of the BSA-Fe complex (Figure S2). In addition, both broadband-enhanced absorption at 280 nm (Figure S3) and quenched fluorescence (Figure S4) demonstrated the formation of BSA-Fe complexes.Citation34,Citation35 Lastly, GA solution was added to the BSA-Fe complex solution at room temperature, with vigorous stirring. The color of the solution changed to purple immediately, which meant the formation of the GA-Fe complex. Circular dichroism spectroscopy (Figure S5) was used to trace conformational changes in the BSA. Results demonstrated that there were no obvious deformations of the BSA during the synthesis process. The synthesized GA-Fe@BSA NPs were incubated for 30 minutes and then collected by ultrafiltration centrifugation, as described earlier.
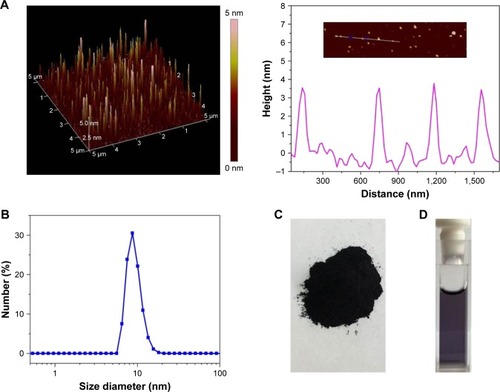
Synthesized GA-Fe@BSA NPs were first characterized by atomic force microscopy. GA-Fe@BSA NPs were monodispersed, spherical, and with an average diameter of 3.5 nm (). The size of these NPs is thought to be beneficial for biological applications, given that ultrasmall NPs are easily excreted from the human body.Citation7 Compared with previous data (in which the average NP diameter was 42.6 nm), the ultrasmall dimensions achieved here can be ascribed to strong coordinating effects between Fe3+ and BSA.Citation28,Citation32 Using dynamic light-scattering measurements ( and S6), the mean hydrodynamic diameter of GA-Fe@BSA NPs was 8.8 nm, which was slightly larger than results observed with atomic force microscopy. This phenomenon has been explained in a previous study in which the hydrodynamic diameter readings of BSA-coated NPs were slightly larger due to the strong hydrophilicity of BSA.Citation28 Importantly, preparation methods for GA-Fe@ BSA NPs can be easily amplified. The yield of synthesized GA-Fe@BSA NPs was nearly 1 g per reaction (). Given that BSA was anchored on GA particles (Figure S7), synthesized GA-Fe@BSA NPs were highly stable in water and dispersed easily, even after 1 month of storage ().
Figure 1 Characterization of GA-Fe@BSA NPs.
Notes: (A) 3-D AFM topography and height profile (measurements along a line are given after AFM imaging); (B) hydrodynamic size; (C) powder prepared in one synthesis reaction; (D) aqueous solution of GA-Fe@BSA NPs.
Abbreviations: GA, gallic acid; NPs, nanoparticles; AFM, atomic force microscopy.
Structural features of the NPs were characterized by measuring FT-IR and UV-visible NIR spectra. FT-IR spectra of GA, BSA, and GA-Fe@BSA NPs are shown in . Characteristic peaks were observed for BSA: 3,301 cm−1 (O-H or N-H stretch), 2,965 cm−1 (-CH2- symmetrical vibrations), 2,870 cm−1 (-CH2- asymmetric vibrations), 1,650 cm−1 (amide I, mainly C=O stretching vibrations), 1,521 cm−1 (amide II, coupling of bending vibrations of N-H and stretching vibrations of C-N), 1,391 cm−1 (side chain COO−), and 1,241 cm−1 (C-N stretching/N-H bending vibrations).Citation36 Similarly, GA characteristic peaks were observed: 3,376 cm−1 (O-H stretch), 3,290 cm−1 (O-H stretch), 1,706 cm−1 (C=O stretch), 1,616 cm−1 (C-C stretch), 1,544 cm−1 (C-C stretch), 1,442 cm−1 (C-O stretch), 1,344 cm−1 (C-C stretch), 1,254 cm−1 (C-O stretch), 1,031 cm−1 (O-H in-plane deformation), 866 cm−1 (C-H out-of-plane bending), and 704 cm−1 (C-H out-of-plane bending).Citation37 GA-Fe@BSA NPs possessed similar peaks that were characteristic of BSA – amide I band vibrations at 1,650 cm−1 and amide II band vibrations at 1,521 cm−1 – supporting the presence of BSA in the GA-Fe@ BSA NPs. The small shift in the amide I band vibration and quenched fluorescence of the GA-Fe@BSA NPs suggested that an interaction was occurring between Fe3+ and the amide of the BSA (Figure S4).Citation35 Disappearance of O-H stretching at 3,376 cm−1 and 3,290 cm−1, as well as the O-H of the carboxylic group bending the band at 1,031 cm−1, indicated that the phenolic groups and carboxylic groups in GA chelated with Fe3+ in GA-Fe@BSA NPs.Citation38
Figure 2 FT-IR (A) and UV-visible NIR absorption spectra (B) of GA-Fe@BSA NPs.
Abbreviations: FT-IR, Fourier-transform infrared; UV, ultraviolet; NIR, near-IR; GA, gallic acid; NPs, nanoparticles.
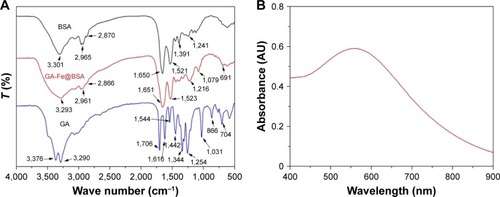
UV-visible NIR absorption spectra () illustrated that GA-Fe@BSA NPs had strong absorption in the entire visible NIR region, with a peak at 558 nm, which might have belonged to d–d electronic transitions of the GA-Fe complex.Citation32 Together, these data demonstrate that BSA-tuned GA-Fe NPs can be successfully synthesized.
Photothermal properties of GA-Fe@BSA NPs
Given the absorption profile observed with GA-Fe@BSA NPs, further investigations were performed to assess photo-thermal conversion effects. Temperature variations in aqueous GA-Fe@BSA NP mixtures were monitored with an IR thermal-imaging camera, while solutions were exposed to 808 nm laser irradiation at 1 W/cm2 for 15 minutes. GA-Fe@ BSA NP concentrations varied from 0 to 1 mM. Imaging colors of each solution varied greatly after exposure to laser treatment (), signifying that temperatures elevated quickly with increasing concentrations of GA-Fe@BSA NPs. Qualitatively observed color differences in imaging data were consistent with photothermal measurements (). As GA-Fe@BSA NPs concentrations increased, temperature changes over the 15-minute time course increased from 3.4°C to 25°C. Pure-water temperatures increased only 1.4°C under the same conditions. These results demonstrated that ultras-mall GA-Fe@BSA NPs absorbed laser energy and efficiently converted it to heat. The practical application for this feature is photothermal ablation to treat solid tumors.
Figure 3 Photothermal performance of the GA-Fe@BSA NPs.
Notes: (A) NIR thermal images and (B) temperature variations of GA-Fe@BSA NPs at increasing concentrations, after laser ablation in the same conditions. (C) Photostability tests for water dispersion of GA-Fe@BSA NPs after eight laser on/off cycles.
Abbreviations: NIR, near-infrared; GA, gallic acid; NPs, nanoparticles.
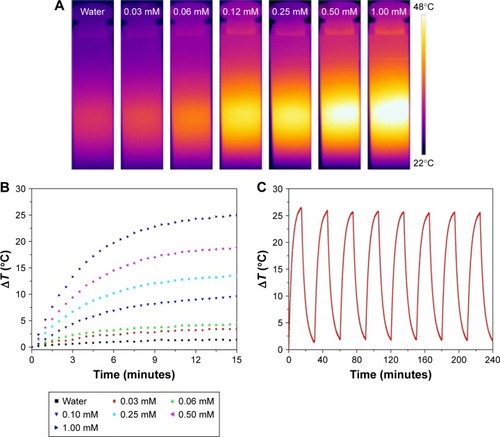
Photostability was measured by testing temperature changes in GA-Fe@BSA NP solutions as they were subjected to laser on/off cycles (). UV-visible NIR spectra were measured before and after laser treatments (Figure S8). After eight laser on/off cycles, temperature increments in the GA-Fe@BSA NP aqueous mixtures changed just slightly. Furthermore, the UV-visible NIR spectra of GA-Fe@BSA NP aqueous mixtures exhibited similar peak curves before and after laser exposure. These results suggested that GA-Fe@BSA NPs were photostable.
MRI of GA-Fe@BSA NPs
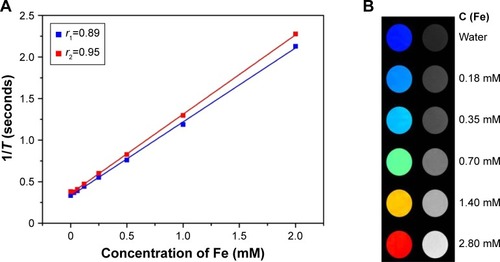
Longitudinal (T1) and transverse (T2) relaxation times were tested to evaluate whether GA-Fe@BSA NPs could serve as an MRI contrast agent. Relaxivity values of GA-Fe@BSA NPs were 0.89 mM/second for r1 and 0.95 mM/second for r2. These results were comparable with previous reports of other MRI contrast agents.Citation31,Citation39 However, the r2:r1 ratio of GA-Fe@BSA NPs, calculated from the data presented in (r2:r1=1.06<3), was relatively lower than previously described agents. These results suggested that GA-Fe@ BSA NPs would provide good T1-weighted contrast. The potential application of GA-Fe@BSA NPs as a T1-weighted MRI contrast agent was explored (). The subjective colors of T1-weighted images gradually shifted from dark (pure water) to light with increased concentrations of aqueous GA-Fe@BSA NP mixtures. Given these results, GA-Fe@ BSA NPs had encouraging potential as a T1-weighted MRI contrast agent for biomedical diagnostics.
Figure 4 (A) Relaxivity (r1 and r2) and (B) T1-weighted MRI images of GA-Fe@BSA NPs versus Fe3+ concentrations in solution.
Abbreviations: MRI, magnetic resonance imaging; GA, gallic acid; NPs, nanoparticles.
Biocompatibility of GA-Fe@BSA NPs
The biocompatibility of GA-Fe@BSA NPs was evaluated using cytotoxicity tests on human macrophages, hemolysis assays on RBCs, cell-cycle assays on HEK293T cells, and in vivo toxicity analyses by routine blood testing. Cell viability was tested in human macrophages after 12- or 24-hour incubation with increasing concentrations of GA-Fe@BSA NPs (). Compared with controls, the viability of GA-Fe@BSA NP-treated human macrophages was modestly reduced. Nonetheless, cell viability remained greater than 80% in samples incubated with GA-Fe@BSA NPs at the highest concentration (200 μM) and longest time (24 hours). Therefore, GA-Fe@BSA NPs exhibited low cytotoxicity (>80%) overall when used at concentrations <200 μM.
Figure 5 The biocompatibility of GA-Fe@BSA NPs.
Notes: (A) Cell viability of human macrophages after incubation with GA-Fe@BSA NPs at different concentrations (0, 10, 25, 50, 100, and 200 mM) for 12 and 24 hours. (B) Rates of hemolysis in RBCs after 1-hour incubations with increasing GA-Fe@BSA NP concentrations. (C) Visual differences observed in RBCs treated with water, PBS, and concentrations of GA-Fe@BSA NPs after centrifugation. (D) Cell-cycle analyses of HEK293T cells treated with 200 μM GA-Fe@BSA NPs for 24 hours. (E) Routine blood analyses for subjects after intravenous infusion of GA-Fe@BSA NPs (200 μL, 20 mM for each mouse) for 3 days: urea nitrogen levels, albumin:globulin ratios, white blood-cell counts, hemoglobin levels, mean corpuscular volumes, and mean corpuscular hemoglobin levels.
Abbreviations: GA, gallic acid; NPs, nanoparticles; RBCs, red blood cells.
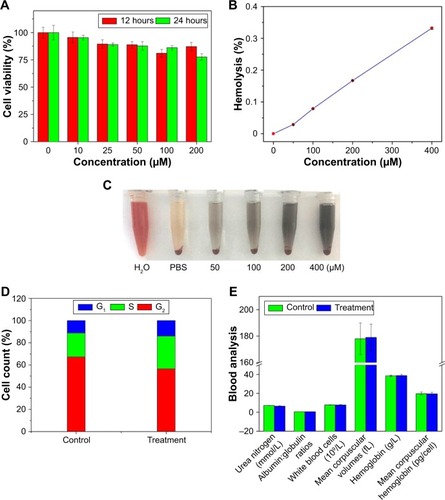
Next, hemolysis assays were performed on mouse erythrocytes. The hemolysis ratio of GA-Fe@BSA NPs for all tested concentrations was lower than 0.33% (; much lower than the permissible limit of 5%). Therefore, no gross hemolysis was observed with GA-Fe@BSA NP treatment at concentrations <400 μM. Furthermore, RBCs treated with GA-Fe@BSA NPs at 400 μM concentrations had similar hemolytic responses to the negative controls ().
Cell cycles of HEK293T cells were measured. Results suggested that GA-Fe@BSA NPs did not significantly impact cell-cycle distributions in comparison with controls (). The results of cytokinesis-blocked micronucleus assays also further demonstrated that GA-Fe@BSA NPs exhibited no noteworthy genotoxicity (Figure S9).
Additionally, routine blood analyses were performed to evaluate toxicity in mouse models: urea nitrogen, albumin:globulin ratios, white blood-cell counts, hemoglobin, mean corpuscular volume, and mean corpuscular hemoglobin. All test results were normal in subjects treated with GA-Fe@BSA NPs at 200 μL concentrations when compared with control subjects. Taken together, these results suggested that GA-Fe@BSA NPs exhibited good biocompatibility.
In vivo biodistribution and clearance of GA-Fe@BSA
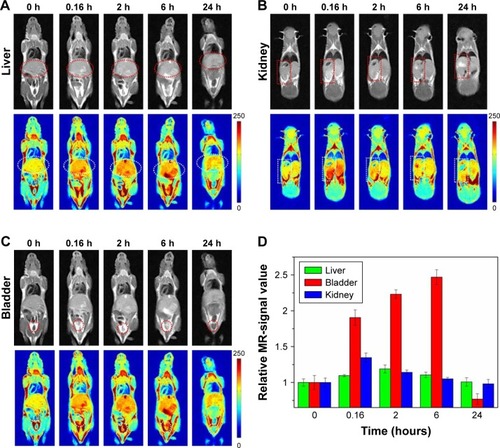
For human use of in vivo infused agents, the FDA requires that they be excreted from the body over a reasonable time course.Citation13 As such, ultrasmall GA-Fe@BSA NPs were tested for body-clearance rates. The biodistribution of GA-Fe@ BSA NPs in healthy mice was followed by tracking changes in MR signals after application of the reagent. T1-weighted MRI of murine subjects was recorded prior to and at 0.16, 2, 6, and 24 hours after intravenous infusion of GA-Fe@ BSA NPs (). T1-weighted MRI of the mice before and 0.16 hours after infusion was compared. At this time point, MR signals accumulated in the kidneys and bladder; the signal in the liver was relatively weak. Decay of MR signals began at 2 and 6 hours after infusion for the kidneys and liver, respectively. The MR signal in the bladder continued to increase at 6 hours after administration. At 24 hours posttreatment, MR signals returned to basal levels observed in all organs prior to treatment. To be noted, extensive MR signals observed in the kidneys and bladder revealed that ultrasmall GA-Fe@BSA NPs were excreted from the body through renal filtration pathways. Moreover, relatively small changes in MR signals observed in the liver suggested that only a small amount of GA-Fe@BSA NPs was intercepted by the reticuloendothelial system.
Figure 6 MRI findings.
Notes: In vivo images of (A) livers (marked with ellipses), (B) kidneys (marked with rectangles), and (C) bladders (marked with circles) of subjects before (0 h) and after (0.16, 2, 6, and 24 h) intravenous infusion with GA-Fe@BSA NPs. (D) Corresponding MR-signal intensities of MRI shown in (A–C).
Abbreviations: MRI, magnetic resonance imaging; GA, gallic acid; NPs, nanoparticles.
In order to identify if the GA-Fe@BSA NPs were degraded in vivo, the urine and blood of the mice administered PBS and GA-Fe@BSA NPs at 0 and 24 hours were collected. After ultrafiltration centrifugation with molecular weight cutoff of 3 kD, iron concentration in the urine and blood was acquired by inductively coupled plasma. Slight differences in urine and blood iron concentrations between subjects administered PBS versus GA-Fe@BSA NPs were observed at 0 and 24 hours (Figure S10). This suggested that GA-Fe@BSA NPs were stable in vivo and easily excreted from the body. Altogether, these results demonstrate that ultrasmall GA-Fe@BSA NPs can effectively avoid phagocytosis by the reticuloendothelial system and are easily eliminated through renal filtration systems.
In vivo tumor MRI
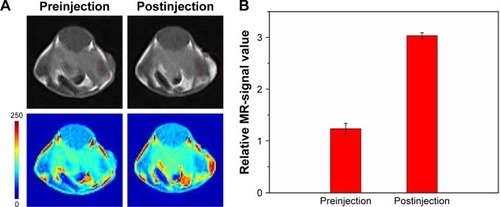
Imaging is a critical function for a novel nanotheranostic agent; these classes of agents are typically employed in detection and evaluation of cancer therapeutic effects.Citation3 Here, GA-Fe@BSA NP MRI properties were evaluated in nude mice bearing 4T1 breast tumors. As shown in , marked positive accumulation of GA-Fe@BSA NPs was observed in T1-weighted MRI of 4T1 breast tumors acquired 1 hour after intratumoral injections with reagents. Signal intensity of tumors 1 hour after intratumoral injection was nearly twice as high as preinjection intensity (). These results demonstrated that GA-Fe@BSA NPs were successfully applied as T1-weighted MRI contrast agents that captured tumor-size differences occurring in vivo.
Figure 7 (A) MRI and (B) corresponding relative signal values of tumor-bearing subjects before and after intratumoral injection of GA-Fe@BSA NPs.
Abbreviations: MRI, magnetic resonance imaging; GA, gallic acid; NPs, nanoparticles.
In vivo photothermal therapy
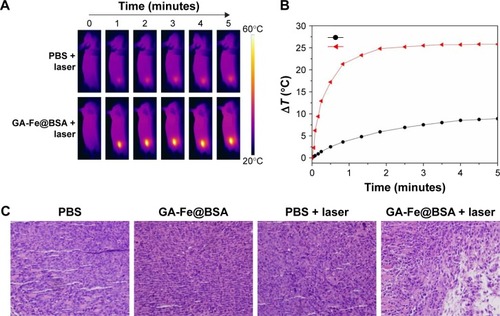
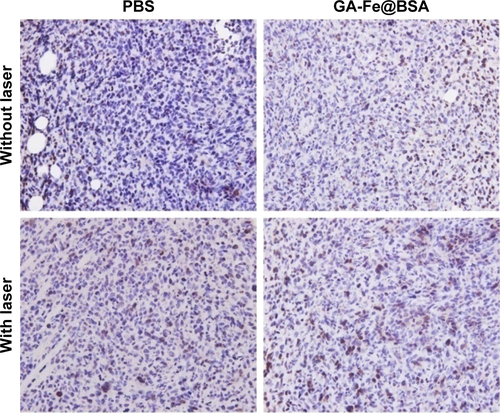
NIR thermal imaging, a method that quantifies spatial temperature distribution, allows real-time evaluation of thermal treatment effects on tumors.Citation4 NIR thermal images were recorded of 4T1 tumor-bearing subjects who were treated with intratumoral GA-Fe@BSA NP injections, with increased lengths of laser ablation (). While being ablated, the rate of temperature rise in GA-Fe@BSA NPs-injected subjects was faster than controls. Also increments of temperature increase were higher than controls (), suggesting that better in vivo photothermal therapy was occurring when GA-Fe@BSA NPs and laser technologies were combined. Subsequent histological examinations assessed photothermal treatment effects on tumor tissues. Representative images of tumor sections taken from each of the four groups are given (). In these experiments, tumor specimens were harvested 2 hours after intratumoral injection with PBS or GA-Fe@BSA NPs, with or without laser-ablation treatment (1 W/cm2, 5 minutes). For the group treated with GA-Fe@BSA NPs and laser therapies, tumor sections exhibited visible differences from all other conditions. For instance, cell densities appeared low in these subjects. The cells also possessed obvious thermonecrotic features (ie, cell shrinkage, coagulation, and nuclear damage). Differences were also observed with TUNEL staining (Figure S11). The GA-Fe@BSA NPs and laser ablation-treated group showed extensive regions stained brown, denoting apoptotic cells. Taken together, these experiments demonstrated that GA-Fe@BSA NPs coupled with laser ablation destroyed solid-tumor tissue in vivo.
Figure 8 In vivo photothermal therapy.
Notes: NIR thermal images (A) and corresponding temperature variations (B) of mice bearing tumors after intratumoral injection with PBS or GA-Fe@BSA and receiving laser ablation; (C) representative images of tumor sections taken from each exposure group (magnification 40×).
Abbreviations: NIR, near-infrared; GA, gallic acid.
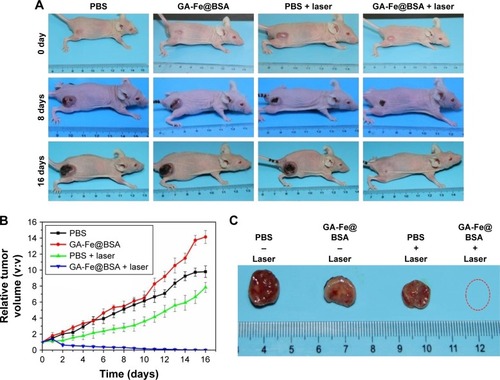
To evaluate further the photothermal therapeutic effects of GA-Fe@BSA NPs, changes to tumors were investigated after various treatments. Murine subjects were randomized to one of four groups treated with PBS, GA-Fe@BSA NPs, PBS plus laser ablation, or GA-Fe@BSA NPs plus laser ablation. The tumor-treatment group receiving GA-Fe@BSA NPs and laser ablation exhibited an incrustation 8 days after treatment. This was lost by the 16-day posttreatment time point (). The other three groups had similar changes in peritumoral edema at 8 days posttreatment. Necrotic regions in the tumor appeared at 16 days after treatment, owing to rapid growth of the tumor. Tumor size, as measured daily with calipers, was notably reduced in subjects receiving both GA-Fe@BSA NPs and laser ablation (). Slower tumor growth was observed in the PBS group receiving laser ablation. Faster tumor growth was observed in mice receiving any treatment without laser ablation. Photographs of dissected tumors, gathered 16 days after treatment, further supported that the GA-Fe@BSA NPs plus laser group exhibited complete tumor ablation (). These results suggested that higher temperatures (approximately 52°C) generated by GA-Fe@BSA NPs after laser ablation had antitumor activities. Subjects treated with PBS or GA-Fe@ BSA NPs without laser ablation had lower temperatures and less antitumor activity; temperatures stimulated by PBS plus laser also produced a limited range of inhibitory effects on tumor growth.
Figure 9 Tumor changes after photothermal therapy.
Notes: (A) Representative images and (B) profiles of tumor volumes in mice, with different treatments at different time points; (C) representative images of dissected tumors from mice 16 days after different treatments without (-) or with laser ablation (+). The red circle denotes that no tumor was dissected.
Abbreviation: GA, gallic acid.
Scheme 1 Synthesis protocol for GA-Fe@BSA NPs and application of GA-Fe@BSA NPs in in vivo MRI and PTT for cancer.
Abbreviations: GA, gallic acid; NPs, nanoparticles; MRI, magnetic resonance imaging; PTT, photothermal therapy.
Conclusion
In summary, BSA was investigated as a substrate used to control the synthesis of GA-Fe(III) coordination polymer NPs. GA-Fe@BSA NPs were ultrasmall (3.5 nm) due to strong interactions between BSA and Fe3+. These particles showed good biocompatibility, and a lower r2:r1 ratio (1.06). Strong absorption in the visible NIR region of GA-Fe@BSA NPs gave them the potential application as an MRI diagnosis and photothermal therapy tool. Moreover, ultrasmall GA-Fe@ BSA NPs effectively avoided phagocytosis in the reticuloendothelial system and were easily eliminated through renal filtration. This quality also reduced potential toxicity induced by long-term corporal retention in the injected agents. Remarkable signal changes in T1-weighted MRI were observed in tumor-bearing subjects before and after intratumor injection with GA-Fe@BSA, which efficiently destroyed solid tumors that were also treated with laser ablation. Together, these data suggest a bright future for GA-Fe@BSA NPs as safe and efficient theranostic agents for use in clinical applications. The extensive experiments shown here demonstrated that high-performance GA-Fe@ BSA NPs could help in the development and improvement of current diagnostic nanoplatforms.
Acknowledgments
This work was partially supported by the National Natural Science Foundation of China (21601124 and 21671135), Program of Young Eastern Scholar from Shanghai Institutions of Higher Learning (QD2015038), Shanghai Rising Star Program (17QA1402600), Natural Science Foundation of Shanghai (16ZR1424700), Ministry of Education of China (PCSIRT_IRT_16R49), and the International Joint Laboratory on Resource Chemistry (IJLRC).
Disclosure
The authors report no conflicts of interest in this work.
Supplementary materials
Figure S1 Color changes at different stages in synthesis of GA-Fe@BSA nanoparticles.
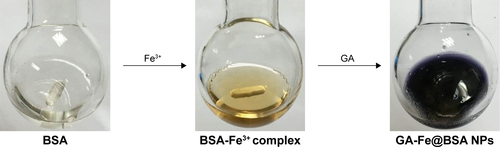
Figure S2 FT-IR of the BSA (red color) and BSA-Fe complex (blue color).
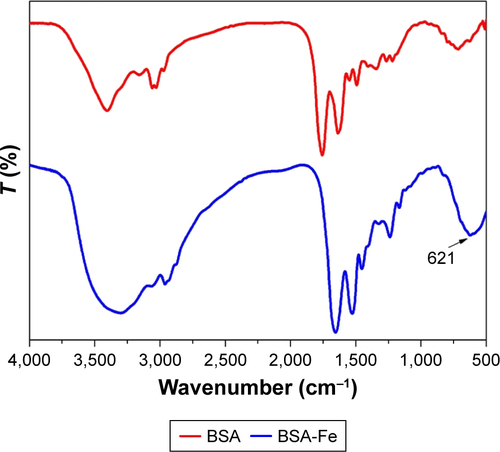
Figure S3 UV-vis-NIR absorption spectra of the BSA, BSA-Fe3+ complex, GA, GA-Fe and GA-Fe@BSA nanoparticles.
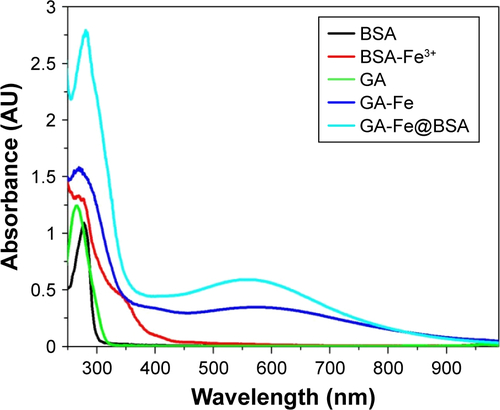
Figure S4 The fluorescence spectra of pure BSA, BSA after adding Fe3+ and GA-Fe@BSA nanoparticles.
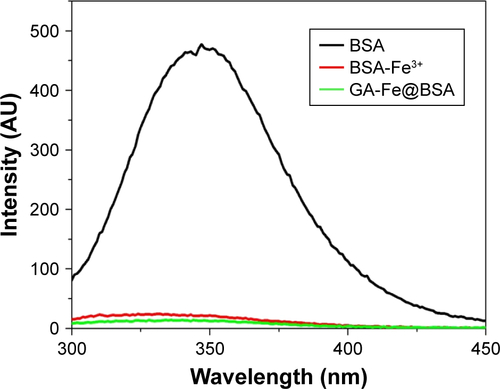
Figure S5 Circular dichroism spectra (recorded by BioLogic ALX250) of pure BSA, BSA-Fe3+ and GA-Fe@BSA nanoparticles.
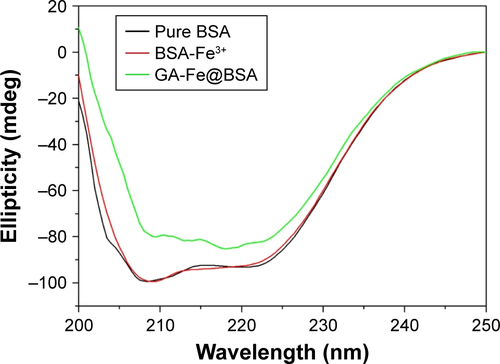
Figure S6 The primary data of dynamic light scattering analysis generated by the Malvern Zetasizer Nano ZS.
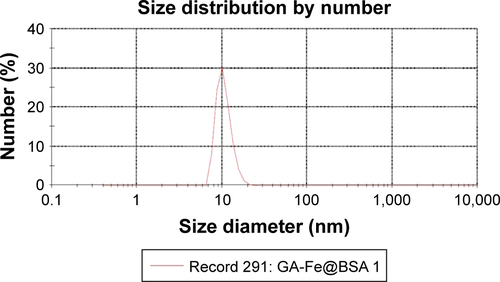
Figure S7 TEM images of the obtained with different magnification: (A) low magnification, (B) high magnification.
Abbreviation: TEM, transmission electron microscopy.
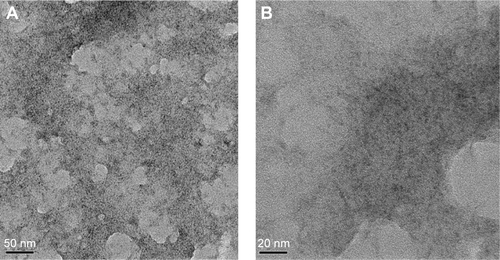
Figure S8 (A) UV-vis-NIR absorption spectra of the as prepared GA-Fe@BSA nanoparticles with different concentrations dispersed in water before and after the laser irradiation. (B) The absorption of the GA-Fe@BSA nanoparticles with different concentrations dispersed in water at 808 nm before and after the laser irradiation.
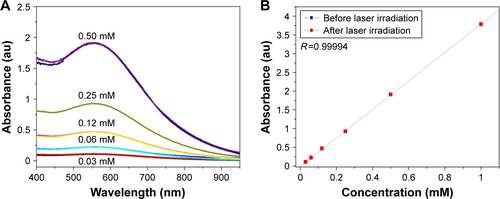
Figure S9 Frequency of micronucleated RAW cells incubated with GA-Fe@BSA. The values represent the mean of three experiments ± SD. Each frequency is not significantly different (p>0.05) from that of control cell in a Student’s t-test (using the methods of AshaRani et alCitation1).
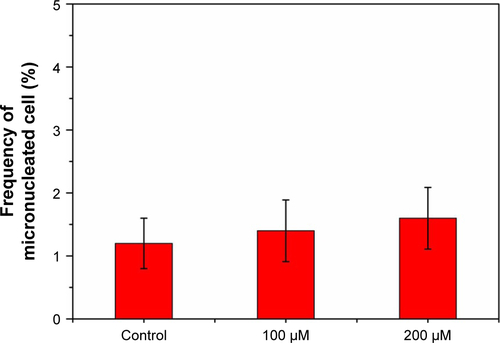
Figure S10 The Iron concentration in the urine (A) and blood (B) of the mice administrated with PBS (control) and GA-Fe@BSA nanoparticles (treatment) at 0 and 24 h.
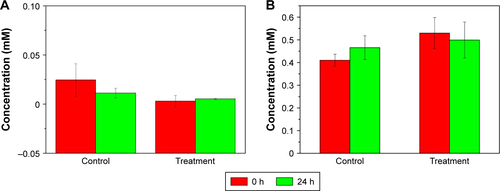
Figure S11 Typical images tumor section with TUNEL staining for the group of PBS, PBS + laser, GA-Fe@BSA and GA-Fe@BSA + laser, respectively.
Reference
- AshaRaniPVLow Kah MunGHandeMPValiyaveettilSCytotoxicity and genotoxicity of silver nanoparticles in human cellsACS Nano20093227929019236062
References
- LiuJNBuWBShiJLChemical design and synthesis of functionalized probes for imaging and treating tumor hypoxiaChem Rev201711796160662228426202
- HuynhELeungBYHelfieldBLIn situ conversion of porphyrin microbubbles to nanoparticles for multimodality imagingNat Nanotechnol201510432533225822929
- PatraMZarschlerKPietzschHJStephanHGasserGNew insights into the pretargeting approach to image and treat tumoursChem Soc Rev201645236415643127722526
- ChengLWangCFengLZYangKLiuZFunctional nanomaterials for phototherapies of cancerChem Rev201411421108691093925260098
- HuangXHEl-SayedIHQianWEl-SayedMACancer cell imaging and photothermal therapy in the near-infrared region by using gold nanorodsJ Am Chem Soc200612862115212016464114
- SongJBYangXYJacobsonOUltrasmall gold nanorod vesicles with enhanced tumor accumulation and fast excretion from the body for cancer therapyAdv Mater201527334910491726198622
- ZhouMLiJJLiangSSoodAKLiangDLiCCuS nanodots with ultrahigh efficient renal clearance for positron emission tomography imaging and image-guided photothermal therapyACS Nano2015977085709626098195
- WenLChenLZhengSMUltrasmall biocompatible WO3−x nanodots for multi-modality imaging and combined therapy of cancersAdv Mater201628255072507927136070
- ZhangYXZhangHWangYKHydrophilic graphene oxide/bismuth selenide nanocomposites for CT imaging, photoacoustic imaging, and photothermal therapyJ Mater Chem B Mater Biol Med20175918461855
- SunBMWuJRCuiSBIn situ synthesis of graphene oxide/gold nanorods theranostic hybrids for efficient tumor computed tomography imaging and photothermal therapyNano Res20171013748
- SobhaniZBehnamMAEmamiFDehghanianAJamhiriIPhotothermal therapy of melanoma tumor using multiwalled carbon nanotubesInt J Nanomedicine2017124509451728684911
- YangKXuHChengLSunCYWangJLiuZIn vitro and in vivo near-infrared photothermal therapy of cancer using polypyrrole organic nanoparticlesAdv Mater201224415586559222907876
- LiuJBYuMXZhouCZhengJRenal clearable inorganic nanoparticles: a new frontier of bionanotechnologyMater Today20131612477486
- TaratulaOSchumannCNalewayMAPangAJChonKJTaratulaOA multifunctional theranostic platform based on phthalocyanine-loaded dendrimer for image-guided drug delivery and photodynamic therapyMol Pharm201310103946395824020847
- LiYPLinTYLuoYA smart and versatile theranostic nanomedicine platform based on nanoporphyrinNat Commun20145471225158161
- SunYDuXQHeJLHuJZhangMZNiPHDual-responsive core-crosslinked polyphosphoester-based nanoparticles for pH/redox-triggered anticancer drug deliveryJ Mater Chem B Mater Biol Med201752037713782
- SongXJChenQLiuZRecent advances in the development of organic photothermal nano-agentsNano Res201582340354
- HuangPRongPFJinADye-loaded ferritin nanocages for multimodal imaging and photothermal therapyAdv Mater201426376401640825123089
- RongPFHuangPLiuZGProtein-based photothermal theranostics for imaging-guided cancer therapyNanoscale2015739163301633626382146
- ToddTJZhenZPXieJFerritin nanocages: great potential as clinically translatable drug delivery vehicles?Nanomedicine (Lond)20138101555155724074382
- MünchGSchicktanzDBehmeAAmino acid specificity of glycation and protein-AGE crosslinking reactivities determined with a dipeptide SPOT libraryNat Biotechnol199917101006101010504703
- YangTWangYKeHTProtein-nanoreactor-assisted synthesis of semiconductor nanocrystals for efficient cancer theranosticsAdv Mater201628285923593027165472
- MoriyamaYOhtaDHachiyaKMitsuiYTakedaKFluorescence behavior of tryptophan residues of bovine and human serum albumins in ionic surfactant solutions: a comparative study of the two and one tryptophan(s) of bovine and human albuminsJ Protein Chem19961532652728804574
- YuanHMXuCZhaoYYuBRChengGXuFJWell-defined protein-based supramolecular nanoparticles with excellent MRI abilities for multifunctional delivery systemsAdv Funct Mater2016261728552865
- BurtJLGutiérrez-WingCMiki-YoshidaMJosé-YacamánMNoble-metal nanoparticles directly conjugated to globular proteinsLangmuir20042026117781178315595811
- HuangPYangDPZhangCLProtein-directed one-pot synthesis of Ag microspheres with good biocompatibility and enhancement of radiation effects on gastric cancer cellsNanoscale2011393623362621842073
- LiuHYZhangXWuXMJiangLPBurdaCZhuJJRapid sonochemical synthesis of highly luminescent non-toxic AuNCs and Au@ AgNCs and Cu(II) sensingChem Commun (Camb)201147144237423921359289
- WangYWuYYLiuYJBSA-mediated synthesis of bismuth sulfide nanotheranostic agents for tumor multimodal imaging and thermoradiotherapyAdv Funct Mater2016262953355344
- WangYYangTKeHTSmart albumin-biomineralized nanocomposites for multimodal imaging and photothermal tumor ablationAdv Mater201527263874388225997571
- NovioFSimmchenJVázquez-MeraNCoordination polymer nanoparticles in medicineCoord Chem Rev201325719–2028392847
- LiuFYHeXXChenHDZhangJPZhangHMWangZXGram-scale synthesis of coordination polymer nanodots with renal clearance properties for cancer theranostic applicationsNat Commun20156800326245151
- ZengJFChengMWangYpH-responsive Fe(III)-gallic acid nanoparticles for in vivo photoacoustic-imaging-guided photothermal therapyAdv Healthc Mater20165777278026845393
- GiftsonJSJayanthiSNaliniNChemopreventive efficacy of gallic acid, an antioxidant and anticarcinogenic polyphenol, against 1,2-dimethyl hydrazine induced rat colon carcinogenesisInvest New Drugs201028325125919300909
- LiDJZhuMXuCJiBMCharacterization of the baicalein-bovine serum albumin complex without or with Cu2+ or Fe3+ by spectroscopic approachesEur J Med Chem201146258859921195512
- LiDJZhuMXuCChenJJJiBMThe effect of Cu2+ or Fe3+ on the noncovalent binding of rutin with bovine serum albumin by spectroscopic analysisSpectrochim Acta A Mol Biomol Spectrosc2011781747920961801
- DasLGuleriaAAdhikariSAqueous phase one-pot green synthesis of SnSe nanosheets in a protein matrix: negligible cytotoxicity and room temperature emission in the visible regionRSC Adv20155756139061397
- Mohammed-ZieglerIBillesFVibrational spectroscopic calculations on pyrogallol and gallic acidTheochem20026183259265
- TanYXZhuLHNiuHYCaiYQWuFCZhaoXLSynthesis of flower-shaped ZrO2-C composites for adsorptive removal of trichlorophenol from aqueous solutionRSC Adv20155947717577183
- DaiYLXiaoHHLiuJHIn vivo multimodality imaging and cancer therapy by near-infrared light-triggered trans-platinum pro-drug-conjugated upconverison [sic] nanoparticlesJ Am Chem Soc201313550189201892924279316