
 ?Mathematical formulae have been encoded as MathML and are displayed in this HTML version using MathJax in order to improve their display. Uncheck the box to turn MathJax off. This feature requires Javascript. Click on a formula to zoom.
Abstract
Introduction
Biomedical applications of nanoparticles (NPs) as enzyme inhibitors have recently come to light. Oxides of metals native to the physiological environment (eg, Fe, Zn, Mg, etc.) are of particular interest—especially the functional consequences of their enzyme interaction.
Materials and methods
Here, Fe2O3, zinc oxide (ZnO), magnesium oxide (MgO) and nickel oxide (NiO) NPs are compared to copper (Cu) and boron carbide (B4C) NPs. The functional impact of NP interaction to the model enzyme luciferase is determined by 2-dimensional fluorescence difference spectroscopy (2-D FDS) and 2-dimensional photoluminescence difference spectroscopy (2-D PLDS). By 2-D FDS analysis, the change in maximal intensity and in 2-D FDS area under the curve (AUC) is in the order Cu~B4C>ZnO>NiO>>Fe2O3>MgO. The induced changes in protein conformation are confirmed by tryptic digests and gel electrophoresis.
Results
Analysis of possible trypsin cleavage sites suggest that cleavage mostly occurs in the range of residues 112–155 and 372–439, giving a major 45 kDa band. By 2-D PLDS, it is found that B4C NPs completely ablate bioluminescence, while Cu and Fe2O3 NPs yield a unique bimodal negative decay rate, −7.67×10³ and −3.50×101 relative light units respectively. Cu NPs, in particular, give a remarkable 271% change in enzyme activity. Molecular dynamics simulations in water predicted that the surfaces of metal oxide NPs become capped with metal hydroxide groups under physiological conditions, while the surface of B4C becomes populated with boronic acid or borinic acid groups. These predictions are supported by the experimentally determined zeta potential. Thin layer chromatography patterns further support this conception of the NP surfaces, where stabilizing interactions were in the order ionic>polar>non-polar for the series tested.
Conclusion
Overall the results suggest that B4C and Cu NP functional dynamics on enzyme biochemistry are unique and should be examined further for potential ramifications on other model, physiological or disease-relevant enzymes.
Video abstract
Point your SmartPhone at the code above. If you have a QR code reader the video abstract will appear. Or use:
Introduction
Nanoparticle (NP) interactions with proteins and other molecules within the biological milieu have been termed the nano-bio interface. This new field has created great excitement within the biomaterials and engineering community.Citation1–Citation7 Recently, the anticancer activity of zinc oxide (ZnO) NPs has been shown by our group and several others and is now considered a nanoscale chemotherapeutic.Citation8–Citation10 Furthermore, the antibacterial activity of ZnO NPs has recently been linked to its ability to serve as a biomimetic inhibitor of the beta-galactosidase enzyme.Citation11 Indeed nickel oxide (NiO), magnesium oxide (MgO) and ZnO possess some inherent catalytic activity themselves.Citation12–Citation14 Strikingly, NiO NPs have been shown to restore the function of fragmented enzyme that is nonfunctional in solution.Citation3 Thus, the biochemical activity of physiological metal oxide NPs including zinc, iron, magnesium and others and their functional impact on enzymes are of tremendous interest but have never before been directly compared. Furthermore, studies on some NP compositions suggest that boron carbide (B4C) NPs may disturb RNA–protein interactions and that copper (Cu) NPs may strongly influence protein secondary structure, yet the effect of these NPs on biochemical activity remains unexplored.Citation15,Citation36
What is known about NP–protein interaction is based primarily on transport proteins or those which are highly prevalent in blood such as albumin.Citation7,Citation15–Citation19 In these cases, a variety of different techniques were employed to investigate NP–protein interaction, including (but not limited to) circular dichroism (CD), Raman, far UV and infrared spectroscopy, as well as isothermal calorimetry.Citation15–Citation19,Citation20 Fluorescence spectroscopy tends to be more quantitative,Citation16 and fluorescence difference spectroscopy (FDS) has been used to investigate changes in protein conformation and adsorption to the surface of derivatized silica.Citation21 Interaction of ZnO NPs with fibrinogen, globulins and albumin resulted in a marked change in the tryptophan (Trp) emission spectra compared to the same proteins in solution or in contact with other NPs.Citation17 Luciferase (Luc) is often used as a model enzyme whose structureCitation22–Citation26 is such that the fluorescence of Trp moieties in the hinge region flanking its active site provide a sensitive probe of conformational changes.Citation27,Citation28 Two-dimensional spectroscopy (performed by independent scanning of excitation and emission frequencies) provides an excellent quantitative measure with which to compare conformational changes induced by various NPs upon their interaction to Luc.
In concert with the effects of NPs on protein conformation, interaction of NPs with enzymes has been shown to stabilize, activate or inhibit them.Citation11,Citation29–Citation32 In addition to fluorescence, the exquisite sensitivity of the bioluminescence produced by Luc and its detection by photoluminescence (PL) spectroscopy have been widely exploited in biotechnology and more recently in nanobiotechnology.Citation3,Citation4,Citation29,Citation35 Bioluminescence resonance energy transfer between Luc and NPs may be a potential means of amplifying and increasing signal to noise in biosensor applications.Citation4,Citation33–Citation35 Mapping the bioluminescence difference spectra in 2-dimensions (excitation and emission) provides an excellent quantitative measure with which activity changes induced by various NPs upon their interaction with Luc can be compared. More importantly, area under the curve (AUC) analysis of the kinetics provides a new way to compare the functional impact of NP.
Materials and methods
Materials
ZnO NPs obtained from Dr G Glaspell (Virginia Commonwealth University) and NiO NPs obtained from Dr K Ghosh (Department of Physics, Missouri State University) were synthesized as previously described.Citation10 All NPs used were of high purity (>97%) with size specifications in the nanoscale (<100 nm). B4C, Fe2O3 and Cu nanopowders were purchased from PlasmaChem GmbH (Berlin, Germany). MgO nano-powder was purchased from Sigma-Aldrich (St. Louis, MI, USA). The NPs were washed with double-distilled deionized water, 70% ethanol/water and ethanol and stored dry prior to use. QuantiLum r-Firefly Luc (Ppy Luc, molecular weight [MW] 61 kDa, 14.37 mg/mL) and the Luc Assay System were obtained from Promega (Madison, WI, USA) and prepared and stored as described by Käkinen et al.Citation32 They were subsequently diluted to a 1 mg/mL (16.4 µM) stock solutions in 0.01 mM PBS (pH adjusted to 7.8 with 0.01 N NaOH). d-luciferin (high-performance liquid chromatography [HPLC], 99% purity, monosodium salt) was purchased from Pierce Biotechnology (Waltham, MA, USA) and suspended in PBS (0.01 mM, pH 7.8) for a stock solution of 100 µg/mL. Trypsin-EDTA (0.05%) was purchased from Life Technologies (Waltham, MA, USA), and GelCode Blue Safe Protein Stain was purchased from Thermo Scientific (Waltham, MA, USA). All steady-state fluorescence and bioluminescence measurements (2-dimensional FDS [2D-FDS], intrinsic fluorescence, PL) were conducted on SpectraMax i3x multi-mode microplate reader at 25°C (Molecular Devices, (San Jose, CA, USA)) equipped with a Xenon flash lamp using 96-well black polypropylene microplates.
Intrinsic fluorescence measurements
Luc (1.64 µM in 0.01 M PBS, pH 7.8) excitation and emission spectra were recorded between 250–310 nm (λem = 342 nm) and 315–450 nm (λex = 295 nm), respectively. Excitation and emission slit width was fixed at 5 nm. For studying NP alterations in Luc fluorescence, Luc samples were manually titrated with successive 10 µL additions of NP solutions (100 µg/mL, in double-distilled water [ddH2O]) to final NP concentrations of 10–100 µg/mL, with 11 samples in total. Luc–NP samples were homogenized and incubated for 30 min prior to measurement (25°C). Concentration and inner filter effects were corrected by zeroing measurements of Luc with each NP to identically prepare Luc-ddH2O samples (absent NPs). The recorded spectra were corrected and analyzed using SigmaPlot v12.3.
Fluorescence measurements of d-Luciferin ± NPs
To verify that the NP complexation occurred to Luc and not d-luciferin (substrate), intrinsic fluorescence of d-luciferin was conducted as already described. d-luciferin (prepared as outlined already) was incubated with 100 µg/mL or 10 µg/mL NP solutions, at a 1:1 ratio, for a final w/v ratio of 1:1 and 10:1. Excitation and emission spectra were recorded between 250–500 nm (λem = 530 nm) and 450–650 nm (λex = 390 nm), respectively. Concentration and inner filter effects were corrected as already described.
Data analysis
Luc and d-luciferin fluorescence data spectra were obtained from the instrument, and raw baseline measurements were corrected by subtracting appropriate buffer background fluorescence values using SpectraMax Pro 6.5 software. Inner filter effects and instrumental variation were corrected by Luc or d-luciferin standard curve of fluorescence (Fem) at λex = 280 nm and λex = 295 nm. This was converted into corrected intensity values (Iem) using the well-known Lambert–Beer’s law:
The Trp emission spectra, including the wavelength (max λem) at which fluorescence intensity is maximal (Imax) is highly sensitive to changes in local Trp microenviorment. Integrated fluorescence intensity, AUC, computed as the area under the curve, is a measure for the relative fluorescence quantum yield and indicates changes in the overall protein environment.Citation37 For each spectra, Luc fluorescence (λex = 295 nm) was integrated between 300 and 380 nm using the Gaussian curve fitting function in SigmaPlot v13.0. Fluorescence ratio intrinsic basis states analysis (FRIBSTA) utilizes the Iem, Imax and AUC to give a fractional area spectrum, useful for comparing the effects of denaturants on protein stability and conformation.Citation38 Accordingly, Luc-NP spectra were normalized to the Luc-only spectra and plotted as Iem/AUC or ΔImax/AUC.Citation27 This was done for better interpretation of the overall photochemical excitation and de-excitation processes attributed to Luc possessing dual-Trp residue. Fluorescence analysis of d-luciferin was conducted in a similar manner with extraction of Iem from instrumental Fem values; however, because the photoexcitation and emission process is attributed entirely to each molecule, the functional activation resides on the excitation efficiency of d-luciferin, Iem⋅(AUC)−1.
Two-dimensional fluorescence difference spectroscopy
2-D FDS measurements were run according to specifications outlined previouslyCitation39 with modifications. Fluorescence excitation (λex, 250–310 nm) and emission (λem, 280–400 nm) wavelengths of Luc were scanned at 2 nm increments with 9 nm and 15 nm slit widths for λex and λem, respectively. The measured value was corrected for background fluorescence and the resulting values were plotted as fluorescence emission vs excitation sensitivity, measured in relative fluorescence units (RFU).
Bioluminescence spectra and kinetic measurements of Luc with/without NPs
Ppy Luc bioluminescence spectra were conducted as detailed by manufacturer’s instructions and described by Käkinen et al.Citation32 Luc kinetic and bioluminescence experiments were conducted using 20 µL of 0.05 mg/mL Luc (0.82 µM) and 100 µL of reconstituted Luc reagent (LR) in 96-well opaque polypropylene microplates. Signal was recorded on a SpectraMax i3x multi-mode microplate reader equipped with LED capability. Instrument sensitivity was standardized using serial dilution of Luc samples (50 µM–5×10⁻⁹ µM) with 100 µL LR. Initial bioluminescence spectra were measured between 450 and 750 nm with 150 ms integration at pH 7.8 and a temperature of 25°C. The estimated mixing time was 15 s. Kinetic measurements were recorded directly after initial bioluminescence (t0 = 60 s) over 600 s at 21 data points. Bioluminescence intensity (relative light units [RLU]) readings were measured between 450 and 750 nm with 150 ms integration. For NP-mediated alterations in Luc bioluminescence and kinetics, the bioluminescence spectra (t0 = 15 sec) and kinetic readings (t0 = 60 sec) were recorded identically (as discussed already) with pre-incubated Luc–NP mixtures at a 1:1 w/v and 10:1 w/v ratio, respectively. Briefly, for the 1:1 w/v Luc–NP mixture, 100 µL Luc (100 µg/mL) was added to 100 µL of homogenized NP (100 µg/mL) and incubated under mild agitation (30 min, 25°C). The 10:1 w/v Luc:NP mixtures were prepared identically with a 10-fold dilution of the 100 µg/mL NP samples. Final Luc concentration in Luc–NP samples was 0.05 µg/mL for all trials. Immediately prior to measurements, 20 µL of either 1:1 w/v or 10:1 w/v Luc–NP mixtures were added to 100 µL of LR.
Thin layer chromatography (TLC)
NP solutions with a concentration of 10 mg/mL in water were prepared for ZnO, Cu, Co3O4, NiO, MgO, Si3N4, B4C and Fe2O3. A saturated amino acid solution was prepared by adding amino acids – lysine (Lys), glutamine (Glu), arginine (Arg), histidine (His), tyrosine (Tyr) and threonine (Thr) – to 1 mL ddH2O. Spotting solutions of amino acid and NPs were prepared in a 1:1 ratio by volume. In total, 1 µL of the mixture was applied to a 13×19 cm TLC plate. The plate was allowed to dry and placed in 10 mL of elution buffer (9:1 ratio of ethanol: acetic acid [1 M]). The plate was left for 1 hour to allow the eluent to elute up the plate. This plate was dried, sprayed with ninhydrin staining solution and placed in a drying oven at 60°C for 10 minutes. Possible interactions/reactions between the amino acids and NPs were determined by comparing Rf values.
Limited proteolysis with trypsin
To investigate the structural perturbation of Luc in the presence of NP complexation, limited proteolysis by trypsin was accomplished. Briefly, Luc–NP samples were prepared at a 1:1 w/v ratio (0.5 mg/mL) with a final volume of 10 µL, which were homogenized, centrifuged and incubated for 5 min at 25°C. The Luc–NP samples were incubated with 2 µL trypsin (0.05% w/v) for the specified time periods (5 min, 15 min, 30 min and 60 min). Samples were run on sodium dodecyl sulfate polyacrylamide gel electrophoresis (SDS-PAGE) (100 V, 2 hours) and visualized using GelCode Blue Safe Protein. Gels were imaged with a BioRad Molecular Image Gel DocXR+ and analyzed with Image Lab software.
Luc–NP binding
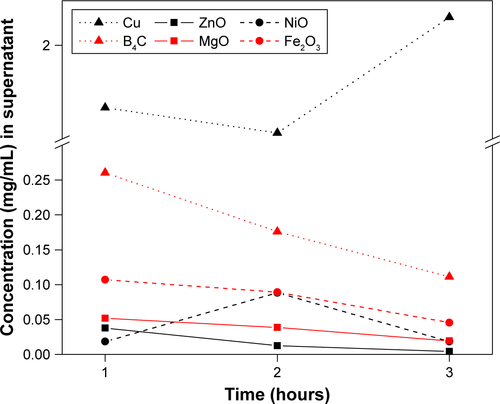
To determine the quantity of Luc binding to NPs, 1 mg/mL NPs and 0.5 mg/mL Luc were added to a final volume of 30 µL and spun down for 1, 2 and 3 hours at 14,000 rpm at 4°C. The quantity of protein in the supernatant unbound to the NPs was obtained using Nanodrop 8000 spectrophotometer.
Examination of the effect of NPs on the secondary structure of Luc
The secondary structure of untreated Luc and Luc–NP mixtures was examined by CD spectroscopy (Chirascan; Applied Photophysics Ltd., Leatherhead, UK). Luc solution was prepared to a concentration of 200 µg/mL. Cu and B4C NP solutions were prepared in deionized water with two different concentrations, 200 µg/mL and 20 µg/mL. Luc–NP solutions with 1:1 and 10:1 ratios (Luc: NP, w/w) were then prepared by mixing equal amounts of Luc and NP solutions. Prior to mixing, NP solutions were homogenized with a probe sonicator (VCX 130; Sonics & Materials, Inc., Newtown, CT, USA) for 2 min at 50% amplitude. The Luc–NP mixtures were incubated under ambient conditions at 200 rpm for 30 min and examined using CD spectroscopy. The final concentration of Luc in every CD sample was 100 µg/mL, and the volume of each sample was 200 µL. CD in the UV range (200–260 nm) was monitored with a 0.1 mm path length quartz cell at ambient temperature. The CD spectra were recorded with a step size of 1.0 nm, bandwidth 0.5 nm and an averaging time of 3.0 s. CD spectra processing and background subtractions were performed using Pro-Data Viewer software (Applied Photophysics Ltd.). The CD data were expressed in terms of molar residue ellipticity, [Ɵ], in deg cm2 dmol−1. The distribution of secondary structures was estimated from the obtained CD spectra by the Dichroweb software packageCitation42–Citation44 with the K2D algorithm. A total of six samples were measured, and all data were presented as mean ± standard deviation. Data were compared using a Student’s t-test with equal variances. A value of P<0.05 was considered statistically significant.
MTT assay
3T3 mouse fibroblast cells (American Type Culture Collection [ATCC]) were seeded on a 96-well plate with 5,000 cells/well and allowed to grow for 24 hours in DMEM with 10% FBS and 1% penicillin/streptomycin. After 24 hours, the medium was changed and the metal oxide treatments were added (Fe2O3, NiO, MgO, B4C, ZnO and Cu), all at a concentration of 200 µg/mL in the same DMEM solution as before. Each treatment was tested on four sample wells. There were also four wells with cells that did not receive treatment and four wells that did not get any cells. After 24 hours with the treatment, the treatment was removed and the wells were rinsed with PBS and then a 1:20 mix of MTT: indicator-free DMEM was added to each well with 110 µL per well and left to metabolize for 5 hours in the incubator. After 5 hours, 85 µL of the mixture was removed from each well and 75 µL of dimethyl sulfoxide was added to each well to solubilize the crystals. The plate was then put on an orbital shaker at 37°C at 175 revolutions/minute. After 15 minutes on the orbital shaker, the plate was then read on a Synergy H1 Hybrid Multi-Mode Microplate Reader for absorbance at a wavelength of 562 nm.
Results
Transmission electron microscopy confirmed the NP size and morphology prior to the binding of Luc, which was demonstrated by the particle size and zeta potential (ZP) analysis as shown in . Furthermore, the same techniques were used to characterize the NPs after binding with Luc. As expected, interactions between these NPs and Luc protein caused an increase in hydrodynamic diameter for all NPs ().
Table 1 Physical characteristics of NPs before and after binding of Luc
The changes in the NP size and ZP demonstrate protein–NP interaction consistent with a prior study with ZnO NPs.Citation18 The decrease in polydispersity index for Cu and increase in ZP for B4C in the presence of Luc suggest a fundamental difference in their physicochemical interaction and were explored further for their impact on Luc enzyme structure-function by 2-D FDS and 2-dimensional photoluminescence difference spectroscopy (2-D PLDS), as described further in the following text.
2-D FDS can be used to measure protein–NP interaction;Citation39 here, it was performed comparatively by plotting the change in intensity and AUC for Luc as a function of the NP type to which it was exposed ().
Figure 1 2-D FDS spectrum of Luc alone and Luc in the presence of Cu NPs at 25°C in 0.01 M PBS (pH 7.8). The y axis represents Iem/AUC in relative absorbance units RFU or the change in ΔImax/AUC (%). The x axis represents emission wavelength (315–455 nm) (λex = 295 nm). The data are tabulated in for all NPs at 50 µg/mL NP. The black line represents Iem/AUC (corresponding to the black axis) and the orange line represents ΔImax/AUC (%) (corresponding to the orange axis).
Table 2 Data comparison on the maximal fluoresence emission, intensity and AUC
Abbreviations: 2-D FDS, 2-dimensional fluorescence difference spectroscopy; Luc, luciferase; NPs, nanoparticles; AUC, area under the curve; RFU, relative fluorescence units.
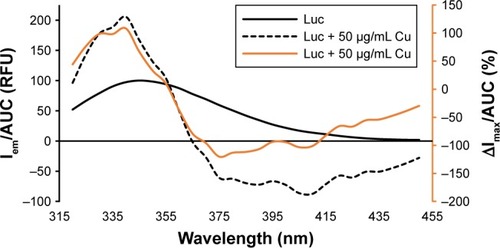
As shown in , a concentration-dependent change in the 2-D FDS pattern was observed, where the most overt change in both maximal fluorescence intensity (Imax) and AUC was for Cu-NP. The remaining data of the series by this criterion are summarized in .
As summarized in , B4C and Cu NPs caused the greatest change in 2-D FDS as reflected in the maximal fluorescence intensity, its change (ΔImax) and AUC analysis. While the fluorescence wavelength was unchanged, Imax and AUC changes are presumed to be due to Trp residues in the flexible hinge region, implying an excellent in situ read out of the protein’s conformation.Citation27,Citation28
The dramatic change in AUC fluorescence for Cu and B4C suggested potential conformational changes induced in Luc upon interaction with these NPs. To further examine this, limited trypsin digestion was performed followed by protein gel electrophoresis analysis. Here, degradation is being caused by trypsin proteolysis. The rate of proteolysis is expected to increase for an unfolded versus a folded protein ().
Figure 2 SDS-PAGE analysis of Luc tryptic digests in presence of (A) Cu or (B) B4C NP. The arrow denotes the lane corresponding to a mass of 45±4 kDa, assigned based on prior gels relative to molecular weight markers and the known molecular weight of Luc in the main band above. (C) Possible locations of a single cleavage of Luc by trypsin resulting in the observed 45±4 kDa fragments. Luc (PDB ID: 1LCI) is shown in a secondary-structure representation and cleavage locations are highlighted by spheres. The color of the spheres indicates the cleavage probability as predicted by the algorithm,Citation40 with green, yellow and red, respectively, denoting probabilities P>0.85, 0.85≤P≤0.6 and P<0.6. (D) Cleavage locations that preclude formation of 45±4 kDa fragments (magenta) and those locations that are consistent with the formation of 45±4 kDa fragments by one or more cleavage events (yellow).
Abbreviations: SDS-PAGE, sodium dodecyl sulfate polyacrylamide gel electrophoresis; Luc, luciferase; NP, nanoparticle.
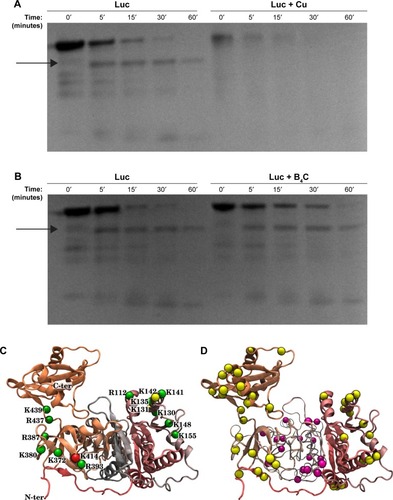
As shown in , Luc–Cu samples degraded faster than Luc–B4C or Luc-only controls. These data are consistent with the hypothesis that absorption of Luc to Cu NPs causes partial unfolding and, thus, greater accessibility for cleavage. Similar to controls, B4C NPs showed an initial band migrating at an apparent MW of approximately 45 kDa. Although it was not possible to unambiguously identify the Luc fragment corresponding to this band from the electrophoresis analysis, the trypsin cleavage positions capable of producing such a fragment are limited. Trypsin cleavage occurs only at Lys (K) or Arg (R) residues, with the neighboring environment determining the probability of any particular cleavage. Notably, cleavage at a particular site implies that this site is accessible to trypsin and not completely occluded by contact with the NPs. We applied the Cleavage Prediction with Decision Trees algorithmCitation40 to determine the probability of cleavages that yield fragments with a mass of 45±4 kDa. For the shortest durations shown in , it can be assumed that most Luc molecules are uncleaved or have been cleaved only once. shows the 15 locations of Luc where a single cleavage can yield 45±4 kDa fragments, occupying just two regions of the protein. The Luc image is based on the x-ray-derived structure (Protein Data Bank identifier [PDB ID]: 1LCI)Citation23 with atomic coordinates for missing residues as estimated by MODELLER software.Citation41 Based on protected regions of the protein not being cleaved, these results seem to imply that either residues 372–439 or residues 112–155 remain accessible to trypsin when Luc is adsorbed to B4C NP. Even when multiple cleavage events are taken into account, there remain some limitations on where cleavage can occur to form 45±4 kDa fragments, as shown in . We hypothesize that cleavage of the relatively independent C-terminal domainCitation23 at residue 437 or 439 is a major contributor to the band at ~45 kDa.
Next, the impact of protein–NP interaction on Luc enzyme activity was investigated by 2-D PLDS. The rapid kinetics of the enzyme was monitored 60 seconds after the injection of the Luciferin substrate. The decay rate, PL spectra and AUC were plotted over the course of approximately one half-life (11 minutes or 660 seconds), as shown in .
Figure 3 Effect of NPs on Luc kinetics and PL spectra. (A) Time dependence of Luc activity in the presence of Fe2O3 and Cu NP. (B) Luminescence as a function of wavelength for Luc control and in the presence of Cu, Fe2O3 and B4C NP.
Abbreviations: NPs, nanoparticles; Luc, luciferase; PL, photoluminescence.
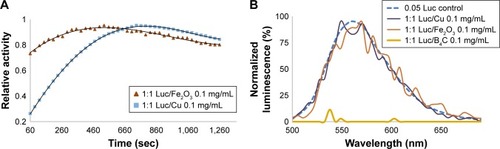
As shown in , and consistent with enzyme denaturation by Cu NPs, nanobiocatalysis was delayed causing a negative decay rate within the rapid timespan of the experiment (60–660 seconds). The AUC increased accordingly. The decay rate for Fe2O3 NPs was also negative and unique relative to the other NPs. Quite surprisingly, in the presence of B4C NPs, no PL was catalyzed. These data suggested that the impact of nano-bio interaction on enzyme function may be more complicated than altering protein conformation. These data are summarized in .
Table 3 Effect of NPs on Luc kinetics and PL spectra
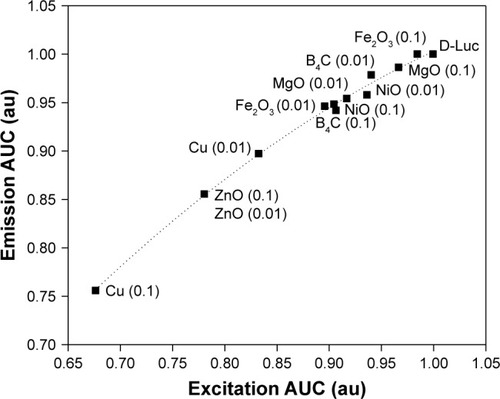
The data in when taken comparatively suggest some plausible mechanistic insight. In addition to partial protein denaturation causing loss of activity (as suggested in ), another potential explanation for the delayed onset and fine structure observed in the PL spectra for Cu and Fe2O3 is interaction between the NPs and the d-luciferin substrate rather than the protein itself. Given the intrinsic fluorescence of the luciferin substrate, its quantum efficiency could be obtained by integrating AUC for its excitation and emission in the presence of the NPs as per the following equation:
Figure 4 Change in emission–excitation of d-luciferin in the presence or absence of NPs. The relative ϕf (AUC) values are normalized such that the emission and excitation AUC values of the d-luciferin samples are 1. NP concentrations are indicated in mg/mL (0.1 and 0.01 mg/mL). The dotted line indicates the quadratic fit to the AUC data.
Abbreviations: NPs, nanoparticles; AUC, area under the curve.
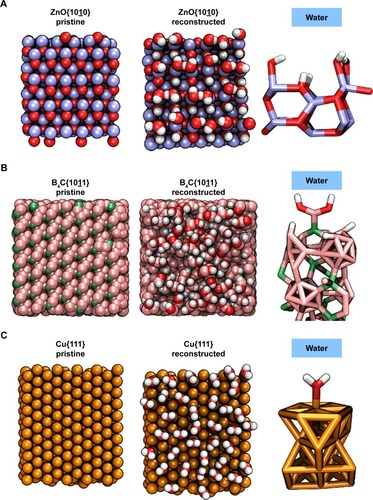
One major difficulty in understanding the physicochemistry of interactions between proteins and NPs is that the atomic-scale structure of the NP surfaces in an aqueous environment where they encounter enzymes are not well characterized. To approximate the chemical structure of the NP surfaces, molecular dynamics simulations were used to reconstruct ZnO, Cu and B4C surfaces in water under ambient conditions. As shown in , 79% and 73% of the under-coordinated Zn and O atoms of the pristine ZnO{1010} surface became capped with OH or H groups, respectively. Similarly, under-coordinated atoms of the B4C surface underwent chemical reactions with water to yield boranes and oxygen-containing boron moieties. Notably, 96% of surface boron atoms bound to carbon formed boronic acid moieties () or, more rarely, borinic acid groups. Surface boron atoms not bound to carbon tended to form borane or diborane motifs. The Cu{111} surface, on the other hand, underwent much less modification. Only 29% of the under-coordinated surface atoms formed covalent bonds to water molecules (), leaving a majority of the Cu atoms free to make contact with solutes. In the experiments, these particles are stabilized by 3% oleic acid, which may impact water behavior at the surface.
Figure 5 Reconstruction of pristine nanomaterial surfaces in the presence of water using reactive molecular dynamics simulations. The images on the left show a top-down view of the surface after equilibration in vacuum, while the images on the right show the same surfaces after 1 ns of reactive molecular dynamics in contact with water. The images on the right are side views of a select portion of the surface, revealing the bonding topology of the chemical modifications. The location of the aqueous phase above the surface is indicated. (A) The ZnO{1010} surface becomes almost completely populated by zinc hydroxides. (B) The B4C{1011} surface forms boronic acid groups as well as borane moieties. (C) The Cu{111} surface accumulates some chemisorbed water molecules, but many under-coordinated Cu atoms remain exposed.
Another advantage of Luc as a model enzyme is that its active site has also been well characterized.Citation46 The key Trp moieties making conformational changes in the protein induced by NP interaction are measurable by 2-D FDS as already mentioned. A model for the substrate binding site is shown in .Citation25,Citation26 In addition to glutamate and Tyr shown in the inset, site-directed mutagenesis and comparative homology studies also suggest the importance of His, Thr and Lys.Citation28–Citation30,Citation40 Altered chromatographic elution has previously been used to gauge interactions to derivatized silica, and was used similarly here to investigate NP interaction with these different amino acids by TLC (). The greatest migrational difference (% control Rf) was seen for Lys that occurred to all NPs, likely indicative of ionic interactions. However, migration differences were seen for Glu and Thr, indicating that hydrogen bonding or polar type interactions may also contribute to interaction. Minor migration differences for Tyr and His do not rule out non-polar stabilizing interactions but would need to be extended to other non-polar amino acids to better determine their effect.
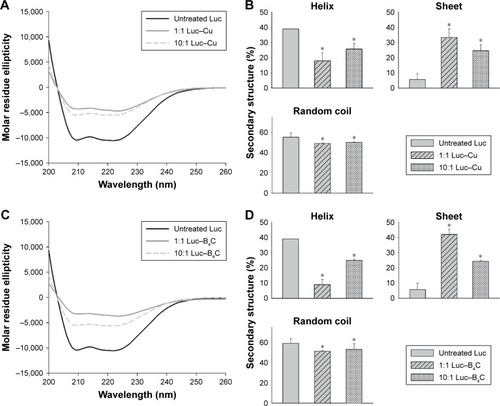
To confirm conformation changes suggested by the fluorescence, bioluminescence, gel and biochemical activity data by Cu and B4C NP, a final CD experiment was conducted. shows the CD spectra of Luc–Cu mixture with 1:1 and 10:1, and presents their secondary structure distribution. Untreated (native) Luc was used as a control. The untreated Luc had two negative ellipticity values at 208 and 222 nm and contained 39.00% α-helix, 5.67% β-sheet and 55.17% random coil structures. The Luc–Cu mixtures, on the other hand, showed significant reduction in ellipticity values. The α-helix structure of the Luc–Cu mixture with 10:1 ratio was decreased from 39.00% to 25.67%, together with an increase of β-sheet from 5.67% to 24.67%. Particularly, the α-helix contents of the Luc–Cu mixture with 1:1 ratio were significantly decreased as compared with untreated Luc (18.23%), along with a substantial increase of β-sheet (33.33%). displays the CD spectra and the secondary structure distribution of Luc–B4C mixture with two different ratios, respectively. The CD spectra of Luc–B4C mixture with 10:1 and 1:1 ratio showed remarkably lower ellipticity values as compared with untreated Luc, and the corresponding secondary structure distribution showed a trend similar to that of Luc–Cu mixture. For 1:1 ratio, however, B4C NPs seemed to induce more conformational changes of Luc than Cu NPs. Overall, it was apparent that Cu and B4C NPs disturbed the secondary structure of Luc, and the degree of disturbance increased as the concentration of NPs increased.
Figure 6 (A) CD spectra of Luc–Cu mixtures with 1:1 and 10:1 ratios. (B) Distribution of secondary structure estimated by the K2D algorithm provided by DichroWeb.Citation42–Citation44 (C) CD spectra of Luc–B4C mixtures with 1:1 and 10:1 ratios. (D) Distribution of the secondary structures. Untreated (native) Luc was used as a control. *Significant difference between untreated Luc and Luc–NP mixtures (n = 6, P<0.05).
Abbreviations: CD, circular dichroism; Luc, luciferase; NP, nanoparticle.
Taken together, the CD data suggest that Cu and B4C NPs induce substantial structural rearrangement in the Luc protein. These data are consistent with the prior fluorescence and luminescence measurements. Although the biophysical or biochemical impact of the nano-bio interaction was the driving force behind this investigation, the NP series were tested by MTT assay on NIH3T3 cells. The B4C NPs absorb in the 562 nm range, interfering with this assay. The cell viability of the remaining NPs had the following ranking: MgO>Fe2O3>NiO>ZnO>Cu, where only Cu and to a lesser extent NiO and ZnO were significantly different than MgO, Fe2O3 or controls. Given these data, the NiO and ZnO were compared to MgO in the mouse splenocyte assay,Citation45 where only NiO significantly altered the P1/P2 ratio after propidium iodide staining and flow cytometry analysis (data not shown).
Conclusion
In conclusion, here comparative functional nano-bio analysis was performed. A change in fluorescence intensity was observed in the presence of all NPs tested. The largest change in both these parameters was seen with Cu NPs and B4C NPs. These NPs in particular also greatly impact the enzyme kinetics and bioluminescence output of the enzyme, with Cu NPs prolonging the kinetics and B4C NPs greatly inhibiting bioluminescence. Furthermore, trypsin digestion studies show that B4C NPs protect Luc from degradation, whereas the presence of Cu NPs increases the rate of degradation with virtually no intact enzyme remaining after only a short period of incubation. These data suggest that these two NPs in particular have very different conformational effects on the enzyme. The increase in UV absorbance seen in the presence of Cu NPs, as contrasted with all other NPs where sedimentation of the Luc bound NPs and loss of UV absorbance in the supernatant occurred, is also consistent with partial protein unfolding as a consequence of Cu–NP interaction (). Certainly cerium oxide and ZnO have similarly been shown to induce conformational changes on thermal denaturation when monitoring Trp fluorescence or UV absorbance changes to fibrinogen and albumin similarly.Citation17 By contrast, the fine structure observed in the PL spectra in the presence of Fe2O3 NPs and the quantum efficiency energy change in the presence of ZnO NPs suggests that the mechanisms of these NP effects on enzymes may be more complicated and may involve interactions between the NPs and substrate (in this case, d-luciferin), which need to be further explored. Finally, the inhibition seen by B4C appears to be unique in comparison to the other NPs, where no bioluminescence was detected even though this NP protects against trypsin digestion and does appear to induce conformation change as seen by 2-D FDS and CD. In this case, no photoelectron disturbance or quantum efficiency change in the presence of substrate was seen. For the most part, the metal or metal oxide surfaces appear to behave similarly in water where enzyme interaction causes an increase in NP size and a decrease in ZP consistent with their protein association. However, here again, B4C behaves very differently and in this case the molecular dynamics simulations of its surface shed some insight suggesting that, in water, boron surfaces convert to boronic acid, which likely leads to hydrogen-bonding interactions with protein. This is consistent with the ZP change. Whereas the ZP of all other materials shifted to the negative upon protein interaction, the ZP of B4C NPs shifted to the positive. Chromatographic interactions with amino acids, particularly with glutamate, were quite distinct between B4C and Fe2O3 again suggesting the fundamentally different physicochemical behavior of B4C versus the well-characterized Fe2O3 metal oxide NPs. These results suggest that this panel of NPs, particularly B4C and Cu as well as Fe2O3 NP, should be further evaluated against disease-relevantCitation10,Citation18,Citation39 and physiologically significant enzymes.
Acknowledgments
SET was supported by the Undergraduate Summer Research Fellowship (American Physiological Society) and RKD by a research grant from the National Cancer Institute (7R15CA139390-03). We would like to thank Miranda Hurst, Kate Inchun, Chandler Curtis and Dr Santosh Aryal for their help and suggestions with the manuscript and Dr Nancy A. Montiero-Riviere and the Nanotechnology Innovation Center of Kansas State (NICKS) for the availability of equipment and generous start up. We would also like to thank Baolin Wang and Amanda Hoffman who supported the cell culture experiment and absorbance background determinations. Our additional thanks go to the Molecular Biology Core funded by Kansas State University College of Veterinary Medicine for the use of the facility.
Supplementary materials
Figure S1 Luc active site showing the luciferin substrate binding site.
Abbreviations: Luc, luciferase; Glu, glutamate; Tyr, tyrosine; Ser, serine; Lys, lysine; Asp, aspartate.
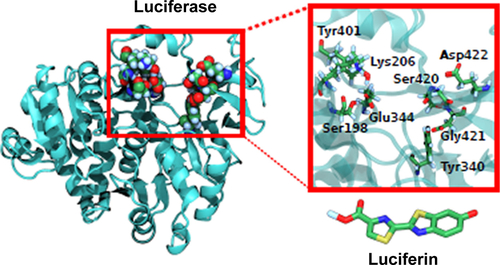
Figure S2 TLC migration of amino acids and the change in migration distance relative to the solvent front (Rf) in the presence of each NP.
Abbreviations: TLC, thin layer chromatography; NP, nanoparticle; Lys, lysine; Glu, glutamate; Arg, arginine; His, histidine; Tyr, tyrosine; Thr, threonine.
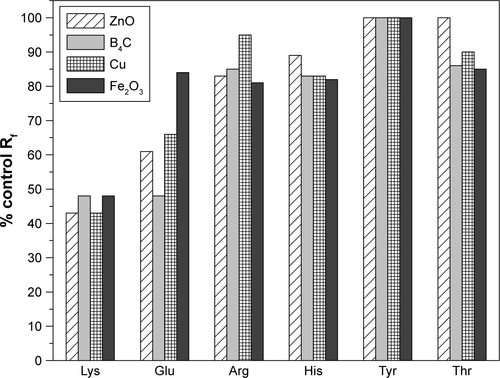
Figure S3 Binding capacity of Luc to NP surface. Cu NPs cause conformational changes leading to higher OD reading, and subsequently concentration in the supernatant.
Abbreviations: Luc, luciferase; NPs, nanoparticles.
Disclosure
The authors report no conflicts of interest in this work.
References
- XiaXRMonteiro-RiviereNARiviereJEAn index for characterization of nanomaterials in biological systemsNat Nanotechnol20105967167520711178
- XuMLiJIwaiHFormation of nano-bio-complex as nanomaterials dispersed in a biological solution for understanding nanobiological interactionsSci Rep2012240622586516
- YuYWangJLiuJLingDXiaJFunctional assembly of protein fragments induced by spatial confinementPLoS One2015104e012210125875003
- HsuCYChenCWYuHPLinYFLaiPSBioluminescence resonance energy transfer using luciferase-immobilized quantum dots for self-illuminated photodynamic therapyBiomaterials20133441204121223069718
- LimJHParkGCLeeSMSurface-tunable bioluminescence resonance energy transfer via geometry-controlled ZnO nanorod coordinationSmall201511283469347525802061
- ForoozandehPAzizAAMerging worlds of nanomaterials and biological environment: factors governing protein corona formation on nanoparticles and its biological consequencesNanoscale Res Lett20151022125995715
- MariamJSivakamiSDongrePMAlbumin corona on nanoparticles – a strategic approach in drug deliveryDrug Deliv20162382668267626056719
- MoonSHChoiWJChoiSWAnti-cancer activity of ZnO chips by sustained zinc ion releaseToxicol Rep2016343043828959565
- MishraPKMishraHEkielskiATalegaonkarSVaidyaBZinc oxide nanoparticles: a promising nanomaterial for biomedical applicationsDrug Discov Today201722121825183428847758
- DeLongRKMitchellJAMorrisRTEnzyme and cancer cell selectivity of nanoparticles: inhibition of 3-D metastatic phenotype and experimental melanoma by zinc oxideJ Biomed Nanotechnol201713222123129377653
- ChaSHHongJMcGuffieMYeomBVanEppsJSKotovNAShape-dependent biomimetic inhibition of enzyme by nanoparticles and their antibacterial activityACS Nano2015999097910526325486
- LinYGHsuYKChenSYLinYKChenLCChenKHNanostruc-tured zinc oxide nanorods with copper nanoparticles as a microreformation catalystAngew Chem Int Ed Engl200948417586759019739158
- NasseriMAKamaliFZakerinasBCatalytic activity of reusable nickel oxide nanoparticles in the synthesis of spirooxindolesRSC Adv201552651726520
- GangulyATrinhPRamanujacharyKVAhmadTMugweruAGanguliAKReverse micellar based synthesis of ultrafine MgO nanoparticles (8–10 nm): characterization and catalytic propertiesJ Colloid Interface Sci2011353113714220934186
- BhogaleAPatelNMariamJDongrePMMiotelloAKothariDCComprehensive studies on the interaction of copper nanoparticles with bovine serum albumin using various spectroscopiesColloids Surf B Biointerfaces201411327628424121071
- BhogaleAPatelNSarpotdarPSystematic investigation on the interaction of bovine serum albumin with ZnO nanoparticles using fluorescence spectroscopyColloids Surf B Biointerfaces201310225726423010116
- Simón-VázquezRLozano-FernándezTPeleteiro-OlmedoMGonzález-FernándezAConformational changes in human plasma proteins induced by metal oxide nanoparticlesColloids Surf B Bioint-erfaces2014113198206
- GannHGlaspellGGarradRInteraction of MnO and ZnO nanomaterials with biomedically important proteins and cellsJ Biomed Nanotechnol201061374220499830
- YangQLiangJHanHProbing the interaction of magnetic iron oxide nanoparticles with bovine serum albumin by spectroscopic techniquesJ Phys Chem B200911330104541045819583232
- DembereldorjUGanboldEOSeoJHLeeSYYangSIJooSWConformational changes of proteins adsorbed onto ZnO nanoparticle surfaces investigated by concentration-dependent infrared spectroscopyVib Spectrosc2012592328
- KatzensteinGEVronaSAWechslerRJSteadmanBLLewisRVMiddaughCRRole of conformational changes in the elution of proteins from reversed-phase HPLC columnsProc Natl Acad Sci U S A19868312426842723459173
- UgarovaNNBrovkoLYProtein structure and bioluminescent spectra for firefly bioluminescenceLuminescence200217532133012407671
- ContiEFranksNPBrickPCrystal structure of firefly luciferase throws light on a superfamily of adenylate-forming enzymesStructure1996432872988805533
- MortazaviMHosseinkhaniSDesign of thermostable luciferases through arginine saturation in solvent-exposed loopsProtein Eng Des Sel2011241289390322068960
- BranchiniBRSouthworthTLMurtiashawMHBoijeHFleetSEA mutagenesis study of the putative luciferin binding site residues of firefly luciferaseBiochemistry20034235104291043612950169
- BranchiniBRMagyarRAMurtiashawMHPortierNCThe role of active site residue arginine 218 in firefly luciferase bioluminescenceBiochemistry20014082410241811327861
- DementievaEIFedorchukEABrovkoLYSavitskiiAPUgarovaNNFluorescent properties of firefly luciferases and their complexes with luciferinBiosci Rep2000201213010888408
- Amini-BayatZHosseinkhaniSJafariRKhajehKRelationship between stability and flexibility in the most flexible region of Photinus pyralis luciferaseBiochim Biophys Acta20121824235035822155276
- VoeikovVLYablonskayaOIStabilizing effects of hydrated fullerenes C60 in a wide range of concentrations on luciferase, alkaline phosphatase, and peroxidase in vitroElectromagn Biol Med201534216016626098530
- BarberSAbdelhakiemMGhoshKEffects of nanomaterials on luciferase with significant protection and increased enzyme activity observed for zinc oxide nanomaterialsJ Nanosci Nanotechnol20111112103091031922408903
- ChakrabortiSChatterjeeTJoshiPStructure and activity of lysozyme on binding to ZnO nanoparticlesLangmuir20102653506351320000758
- KäkinenADingFChenPMortimerMKahruAKePCInteraction of firefly luciferase and silver nanoparticles and its impact on enzyme activityNanotechnology2013243434510123899823
- AlamRKaramLMDoaneTLNear infrared bioluminescence resonance energy transfer from firefly luciferase – quantum dot bio-nanoconjugatesNanotechnology2014254949560625414169
- LimJHParkGCLeeSMSurface-tunable bioluminescence resonance energy transfer via geometry-controlled ZnO nanorod coordinationSmall201511283469347525802061
- VasquezESFeugangJMWillardSTRyanPLWaltersKBBio-luminescent magnetic nanoparticles as potential imaging agents for mammalian spermatozoaJ Nanobiotechnology2016142026984640
- DelongRKHurstMNAryalSInchunNKUnique boron carbide nanoparticle nanobio interface: effects on protein-RNA interactions and 3-D spheroid metastatic phenotypeAnticancer Res20163652097210327127109
- GhisaidoobeABChungSJIntrinsic tryptophan fluorescence in the detection and analysis of proteins: a focus on Förster resonance energy transfer techniquesInt J Mol Sci20141512225182253825490136
- TsonevLIHirshAGFluorescence ratio intrinsic basis states analysis: a novel approach to monitor and analyze protein unfolding by fluorescenceJ Biochem Biophys Methods200045112110899387
- HurstMNDeLongRKTwo-dimensional fluorescence difference spectroscopy to characterize nanoparticles and their interactionsSci Rep201663328727624316
- FannesTVandermarliereESchietgatLDegroeveSMartensLRamonJPredicting tryptic cleavage from proteomics data using decision tree ensemblesJ Proteome Res20131252253225923517142
- SaliABlundellTLComparative protein modelling by satisfaction of spatial restraintsJ Mol Biol199323437798158254673
- LobleyAWhitmoreLWallaceBADICHROWEB: an interactive website for the analysis of protein secondary structure from circular dichroism spectraBioinformatics200218121121211836237
- WhitmoreLWallaceBADICHROWEB, an online server for protein secondary structure analyses from circular dichroism spectroscopic dataNucleic Acids Res200432W668W67315215473
- WhitmoreLWallaceBAProtein secondary structure analyses from circular dichroism spectroscopy: methods and reference databasesBiopolymers200889539240017896349
- MedberryPDennisSVan HeckeTDeLongRKpDNA bioparticles: comparative heterogeneity, surface, binding, and activity analysesBiochem Biophys Res Commun2004319242643215178424
- BranchiniBRMagyarRAMurtiashawMHAndersonSMHelgersonLCZimmerMSite-directed mutagenesis of firefly luciferase active site amino acids: a proposed model for bioluminescence colorBiochemistry19993840132231323010529195