
Abstract
Background
Cerium dioxide nanoparticles (nanoceria) are increasingly being used in a variety of products as catalysts, coatings, and polishing agents. Furthermore, their antioxidant properties make nanoceria potential candidates for biomedical applications. To predict and avoid toxicity, information about their biokinetics is essential. A useful tool to explore such associations between exposure and internal target dose is physiologically based pharmacokinetic (PBPK) modeling. The aim of this study was to test the appropriateness of our previously published PBPK model developed for intravenous (IV) administration when applied to various sizes of nanoceria and to exposure routes relevant for humans.
Methods
Experimental biokinetic data on nanoceria (obtained from various exposure routes, sizes, coatings, doses, and tissues sampled) in rats were collected from the literature and also obtained from the researchers. The PBPK model was first calibrated and validated against IV data for 30 nm citrate coated ceria and then recalibrated for 5 nm ceria. Finally, the model was modified and tested against inhalation, intratracheal (IT) instillation, and oral nanoceria data.
Results
The PBPK model adequately described nanoceria time courses in various tissues for 5 nm ceria given IV. The time courses of 30 nm ceria were reasonably well predicted for liver and spleen, whereas the biokinetics in other tissues were not well captured. For the inhalation, IT instillation, and oral exposure routes, re-optimization was difficult due to low absorption and, hence, low and variable nanoceria tissue levels. Moreover, the nanoceria properties and exposure conditions varied widely among the inhalation, IT instillation, and oral studies, making it difficult to assess the importance of different factors.
Conclusion
Overall, our modeling efforts suggest that nanoceria biokinetics depend largely on the exposure route and dose.
Introduction
The most common commercial form of cerium is cerium dioxide, also known as ceric oxide or ceria. Nanoscale forms of ceria (nanoceria) are used in a variety of products as catalysts, fuel additives and cells, polishing agents, and coatings.Citation1–Citation4 The ability of nanoceria to react catalytically with reactive oxygen species has made it interesting for use in biomedical applications, such as therapeutic agents in the treatment of diseases related to oxidative stress, including obesity, wound healing, retinal degeneration, and Alzheimer’s disease.Citation5–Citation10
Increased consumer and worker exposure to nanoceria combined with sparse availability and conflicting toxicological information have raised concerns for health effects in the human population.Citation3,Citation11,Citation12 Systemic uptake of nanoceria is quite low (typically <1% for inhalation and even less for oral exposure), nevertheless bioaccumulation may occur due to slow dissolution and excretion.Citation13–Citation15 Acute toxicity is considered to be low; however, long-term inhalation and oral studies show that toxicity may occur in tissues distant to the uptake site, suggesting systemic uptake is of importance.Citation3,Citation16–Citation18 For example, high oral doses of nanoceria caused severe liver, spleen, and brain damage in rats.Citation17 The results of safe-by-design concepts used in an attempt to reduce toxicity are promising. For example, the lung inflammatory response to intratracheal (IT) instillation of nanoceria coated with amorphous silica was lower compared to uncoated nanoceria.Citation19
To better predict the toxic effects and toxic mechanisms of nanomaterials, understanding their biokinetics is crucial. Biokinetics can be elucidated by physiologically based pharmacokinetic (PBPK) modeling. The PBPK model converts physiological and anatomical properties to mass balance equations and describes the time-dependent fate of substances in the body, linking exposure to the internal (target) dose.Citation20,Citation21 By use of experimental data from biodistribution studies, the model can be developed, calibrated, refined, and validated.Citation22,Citation23 There is a limited number of PBPK models for nanoparticles, and to our knowledge, so far, no model for intravenous (IV) exposure has been calibrated and validated for nanoceria.Citation24–Citation51
Modeling efforts have demonstrated that there are many challenges to the development of models for nanoparticles.Citation22,Citation23,Citation52 The biological activity of nanoparticles differs from their solute and larger forms.Citation53–Citation59 However, these factors are not well characterized in quantitative terms and thus not readily implemented in PBPK models. One limiting factor in the development of PBPK models for nanoparticles is the availability of rich in vivo data, with well-characterized properties of nanoparticles, multiple doses, multiple tissues, and multiple sampling times. The IV route is important as bioavailability is 100%; hence, IV studies serve as a reference when studying biokinetics after exposure via other routes. In addition, IV dosing is the likely choice if nanoceria are to be used as therapeutic agents, since bioavailability via other routes is low.
In this study, we applied our previously developed PBPK model for different nanoparticles given IV to rats to nanoceria of different sizes and coatings.Citation52 We further modified the model to account for inhalation, IT instillation, and oral exposures to nanoceria.
Materials and methods
Data source
Experimental data on the biodistribution of nanoceria administered to rats were collected from the literature or received directly from authors. Data published only in graphs were extracted using WebPlotDigitizer version 2.6. Only studies where dose and tissue levels of nanoceria could be converted to mass or concentration were included. Data were converted to cerium dioxide concentration. We found eight publications of biodistribution studies with IV exposure, reporting 21 data sets with different nanoceria sizes (3, 5, 15, 30, 40, and 55 nm), coatings (uncoated, citrate, or EDTA-citrate), doses (between 6 and 750 mg/kg), and dosing methods (bolus and infusion).Citation15,Citation60–Citation66 Inhalation or IT instillation were addressed in seven publications, which included 14 data sets.Citation13,Citation14,Citation18,Citation49,Citation53,Citation67,Citation68 Oral uptake was described in six publications, which included 12 data sets.Citation14,Citation17,Citation53,Citation67,Citation69,Citation70 The experimental studies are summarized in –.
Table 1 Summary of biodistribution studies with IV dosed Sprague Dawley rats which are used to calibrate and validate the PBPK model for 5 nm ceria
Table 2 Summary of biodistribution studies with IV dosed rats which are used to calibrate and validate PBPK model for 30 nm ceria
Table 3 Summary of biodistribution studies with Sprague Dawley rats IV dosed with 15 and 55 nm ceria
Table 4 Summary of inhalation, IT instillation, and oral biodistribution studies with nanoceria in rats
Due to the limited and scattered nature of these biodistribution studies, assigning the data to calibration and validation sets could not be randomized. Instead, the data sets for calibration were chosen based on the following inclusion criteria: 1) the total recovered mass in analyzed tissues should be at least 25% of the injected dose, and 2) nanoceria levels should be reported for more than four internal tissues and include at least three time points. The remaining data sets were used for validation.
Comparison of biodistribution data for the non-IV exposure routes
The collected data sets for biodistribution after inhalation exposure, IT instillation, and oral administration varied in study design (dose, dose frequency, sampling frequency, and collected tissues), and the nanoceria used had different properties.
Only the administered dose was given in these data sets, the systemically absorbed fraction being unknown. However, liver is a major target tissue for nanoceria and the most frequently sampled internal organ in the data sets. The nanoceria mass in liver was therefore used as a surrogate for systemic absorption; this allowed for comparison among the different studies. Nanoceria translocation from the lung and gastrointestinal tract was thus calculated by dividing the mass in liver with the IT and orally administered dose, respectively. For inhalation, the nanoceria mass in lung was used instead of administered dose.
Reported delivered dose and internal organ concentrations differed substantially among exposure routes. To allow for comparisons of the biodistribution among data sets and exposure routes, the experimental data were first normalized by dividing the nanoceria concentration in each tissue by the average concentration in the liver, here called the tissue:liver concentration ratio.
PBPK model structure
Studies of nanoceria given IV to rats show, as do similar studies with other nanoparticles, that nanoceria are captured by phagocytic cells (PCs) in tissues belonging to the mono-nuclear phagocyte system (MPS), including liver, spleen, and bone marrow.Citation14,Citation53,Citation61,Citation63 Once distributed to the MPS, nanoceria reside there for a long time.Citation14,Citation15 We based the PBPK model on the one previously developed by Carlander et al.Citation52 The model consists of 10 compartments: arterial blood, venous blood, liver, spleen, lung, kidney, heart, brain, bone marrow, and other tissues (). Each compartment is divided into three sub compartments: 1) blood in tissue, 2) tissue, and 3) PCs in the tissue, with venous and arterial blood described by two subcompartments: blood and PCs.
Figure 1 Schematic illustration of the physiologically based pharmacokinetic (PBPK) model.
Notes: Black arrows indicate transport of nanoceria between subcompartments, blue and red arrows represent systemic circulation, green arrows indicate uptake into the circulatory system, and dashed arrows indicate excretion. The blue area is venous blood, and the red area is arterial blood. Green boxes correspond to exposure via inhalation/intratracheal instillation, and intravenous and oral administration. The grey box represents tissue. White boxes with the text PC symbolize phagocytic cells in tissue. Orange boxes indicate clearance of nanoceria to mucus, urine, and feces.
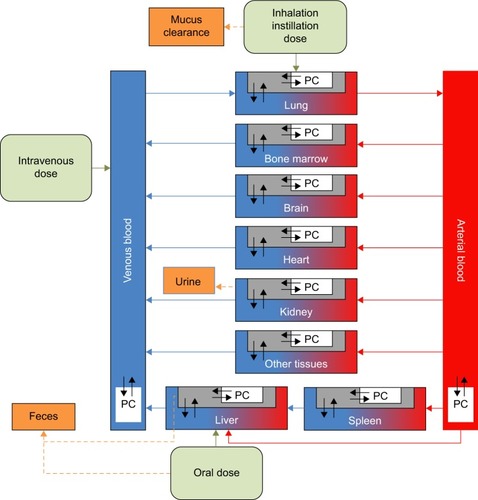
The PCs are described by a particle-dependent uptake rate constant (Ksab0 for spleen and Kab0 for all other tissues), an exocytosis rate constant (Kde), and a maximum uptake capacity (Mcap). With one exception (Ksab0), all PCs are assumed to have the same properties (ie, same Kab0 and Mcap), and only their numbers (a particle-independent parameter) differ among compartments. The model includes flow and diffusion-limited processes from blood to tissues described by three permeability coefficients (Xfast for liver, spleen, and bone marrow; Xbrain for the blood–brain barrier; and Xrest for other tissues). Partitioning between blood and other tissues is expressed by a partition coefficient (P). Excretion occurs from the liver and kidney and is accounted for by clearance rate constants (CLf and CLu, respectively).
Systemic uptake after inhalation, IT instillation, and oral exposure is addressed by adding a first-order absorption compartment to the PBPK model. The absorption rate constant (a route- and particle-dependent parameter) was obtained by best fit to each data set. Clearances from the lungs via the mucociliary escalator and from the gastrointestinal tract to feces are also described by first-order kinetics and were obtained by best fit to the respective data sets. Dissolution of nanoceria has been reported but experimental data useful for modeling are lacking so far.Citation71 For this reason, dissolution is not included in the model.
Model calibration
The model was parameterized by best fit against experimental tissue concentrations of nanoceria given IV to rats. All physiological (nanoparticle independent) parameters of the model were kept the same as previously reported by Carlander et al (Table S1), except for scaling to body weight in the individual experiments.Citation52 The fitted (nanoparticle-dependent) parameters were CLf, CLu, kab0, ksab0, kde, P, Mcap, Xbrain, Xrest, and Xfast.
As size has been reported to influence the biokinetics of nanoparticles, the model was fitted against 5 and 30 nm experimental IV data separately.Citation15,Citation60,Citation61 Excretion data for nanoceria have only been reported for 30 nm particles, where the amount of nanoceria recovered in feces and urine was reported to be <0.5% and 0.01% of the dose, respectively.Citation14,Citation15 The clearance rate constants for urine and feces were estimated during the calibration of the PBPK model for 30 nm ceria and next used as fixed values in the calibration of 5 nm ceria.
For calibration of the model for 5 nm ceria, we used two sets of experimental data reported by Yokel et al (85 mg/kg, 1 h infusion, and 11 mg/kg, 1 h infusion) ().Citation60,Citation61 Both the data sets cover three sampling times (1 h, 20 h, and 30 d post-infusion) and report concentrations for all tissues defined in our PBPK model. Calibration of the model for 30 nm ceria was carried out using the richest available data set (number of tissues collected, number of sampling times, and time span) (87 mg/kg, 1 h infusion) ().Citation15 This data set covers four sampling times and cerium concentrations in all tissues in our model as well as in urine and feces.
Regarding inhalation, IT instillation, and oral exposure studies, only one study for inhalation, one for IT instillation, and three for the oral route fulfilled the calibration criteria (). The studies that did not fulfill the calibration criteria were used to calculate liver:dose ratios for comparison among exposure routes. The calibration involved fitting each data set by changing nanoparticle-dependent parameters, the absorption rate constant (all three routes), the mucociliary clearance rate constant (inhalation and IT instillation), and the gastrointestinal clearance rate constant (oral route).
In the calibration using inhalation, IT instillation, and ingestion data, we departed from the initial calibration with 5 and 30 nm IV data and added two route-dependent rate constants, for absorption (all three routes) and clearance (mucociliary for inhalation and IT instillation, gastrointestinal for the oral route). We first tried to achieve calibration by fitting all nanoparticle-dependent parameters. However, no results could be obtained due to the high number of parameters combined with relatively few data points and widely disparate experimental data. In a second attempt, we considered the parameters from the IV calibration and fitted the route-dependent parameters only.
Model validation
The model was validated with additional independent biodistribution studies that used 5 and 30 nm, or similarly sized, ceria. In addition, as proposed by the WHO, the validation was considered adequate if the simulated values were within a factor of two of the measured mean values.Citation21
Four IV data sets were used for the validation of our PBPK model for 5 nm ceria (),Citation61–Citation63,Citation65 and for the 30 nm PBPK model, five IV data sets ()Citation53,Citation60,Citation61,Citation65 were used. The data sets cover doses of 1–750 mg/kg, infusion durations between 0 and 7.5 h, and post-dosing sampling up to 90 days. The nanoceria were either uncoated or coated with citrate, citrate/EDTA, or silica.
Sensitivity analysis
Local sensitivity analyses were carried out to identify the most influential model parameters. Normalized sensitivity coefficients were calculated by dividing the percent change in the area under the concentration–time curve in tissues (blood, liver, spleen, brain, and PCs) by the percent change in different model parameters, as described by Carlander et al.Citation52
Modeling software and algorithms
Computer simulations were carried out with acslX Libero™ version 3.0.2.1 using the Gear algorithm or Berkeley Madonna™ version 8.3.18 using the Runge-Kutta (4th-order) method. AcslX Libero with the Nedler Mead method was used for optimization.
The overall goodness of fit between the simulated and experimental data was evaluated using linear regression in GraphPad Prism 6 (GraphPad Software, Inc., La Jolla, CA, USA).
Results
IV exposure – 5 nm ceria
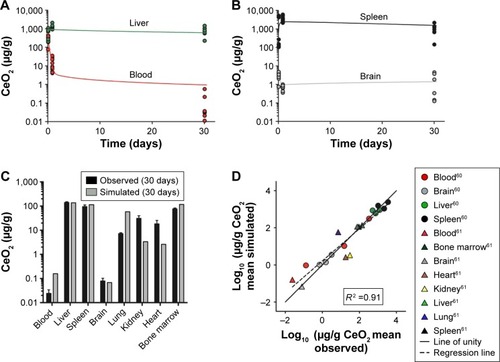
As shown in , the PBPK model adequately describes the measured concentration of 5 nm ceria in liver, brain, and bone marrow (less than twofold differences) and in blood, spleen, lung, kidney, and heart reasonably well (less than 10-fold difference). Furthermore, the simulated values correlate well with the experimental data reported by Yokel et al in 2013 (Figure S1A) and correlate reasonably well with those reported by Yokel et al in 2014 (Figure S1B).Citation60,Citation61 The overall coefficient of determination (R2) for both the data sets is 0.91 ().
Figure 2 Physiologically based pharmacokinetic (PBPK) model calibration of 5 nm ceria administered intravenously to rats.
Notes: (A and B) Simulated (solid curves) and experimentally observed concentrations (circles) in tissues of rats at various time points, following 1 h intravenous (IV) infusion of 85 mg/kg body weight. Data from Yokel et al.Citation60 (C) Simulated and experimentally observed concentrations in tissues of rats, 30 days after a 1 h infusion of 11 mg/kg body weight. Error bars represent standard deviation for experimental observed data. Data from Yokel et al.Citation61 (D) Comparison of logs of simulated and observed mean concentration in tissues. The line of unity (solid) represents a perfect match, and the regression line (R2, dashed) describes the outcome. Data from Yokel et al.Citation60,Citation61
Four independent data sets were used to validate the PBPK model for 5 nm ceria. In three of the data sets, the properties were identical to those in the calibration data sets, whereas in the fourth, the size (3 nm instead of 5 nm) and coating (citrate/EDTA instead of citrate only) differed slightly. The simulations indicate differences in time courses in blood between these two types of nanoceria. Thus, for the 5 nm ceria, the model predicts well the most observed concentrations in tissues, whereas for the 3 nm ceria, it underpredicts the concentration in blood at every time point, suggesting dependence on size and coating ( and S2). This suggests that EDTA/citrate coating prolongs the circulation time in blood, a conclusion also drawn by Heckman et al.Citation62
Figure 3 Validation of the physiologically based pharmacokinetic (PBPK) model against independent data sets with 5 nm ceria administered intravenously into rats.
Notes: (A and B) Simulated (solid curves) and observed (symbols) time courses of the concentration of 5 nm ceria in different tissues following intravenous infusion in rats from different studies (A, data from Dan et al,Citation65 B, data from Hardas et alCitation63). (C) Simulated (grey columns) and observed (black columns) concentrations of 5 nm ceria in different tissues following intravenous infusion in rats. Data from Yokel et al.Citation61 (D) Comparison of logs of simulated and observed mean concentration in different tissues. The line of unity (solid) represents a perfect match, and the regression line (R2, dashed) describes the outcome. Data from Yokel et al,Citation61 Dan et al,Citation65 and Hardas et al.Citation63
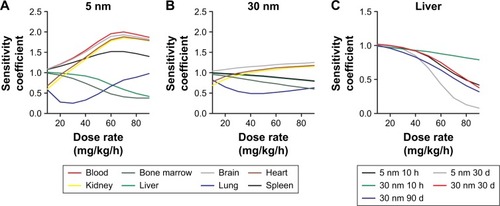
The sensitivity analysis showed that the concentrations in the different compartments are influenced by physiological- and nanoparticle-dependent parameters and dose and are time dependent ( and Tables S2–S7, sensitivity coefficients are shown for two time points only for each dose set). The most influential nanoparticle-dependent parameters are kab0, ksab0, Mcap, P, Xbrain, and Xrest, as described further in the “Discussion” section (). As a consequence of nonlinear kinetics in the model (saturation of PCs), the concentration in tissues does not increase in proportion to dose as dose increases from 11 to 85 mg/kg. This nonlinearity is seen as sensitivity coefficients that change with dose (). For most tissues, the sensitivity coefficients generally increase with dose rate. For liver, the trend is opposite with decreasing sensitivity coefficients for all examined nanoparticles ().
Figure 4 Sensitivity analyses of the physiologically based pharmacokinetic (PBPK) model calibrated with 5 and 30 nm ceria administered intravenously to rats.
Notes: Normalized sensitivity coefficients for nanoparticle-specific parameters in blood, liver, spleen, brain, and phagocytic cell compartments are given for 10 h after dosing and at the end of the experiment (30 d for 5 nm and 90 d for 30 nm). Experimental data used for modeling are from Yokel et al.Citation15,Citation60,Citation61
Abbreviations: CLf, clearance rate constant to feces; CLu, clearance rate constant to urine; kab0, uptake rate constant by phagocytic cells; ksab0, uptake rate constant by phagocytic cells in spleen; kde, exocytosis rate constant from phagocytic cells; Mcap, maximum uptake capacity per phagocytic cell; P, partition coefficient between blood and tissue; Xfast, coefficient of permeability from blood to liver, spleen, and bone marrow; Xrest, coefficient of permeability from blood to lung, kidney, heart, and carcass; Xbrain, coefficient of permeability from blood to brain.
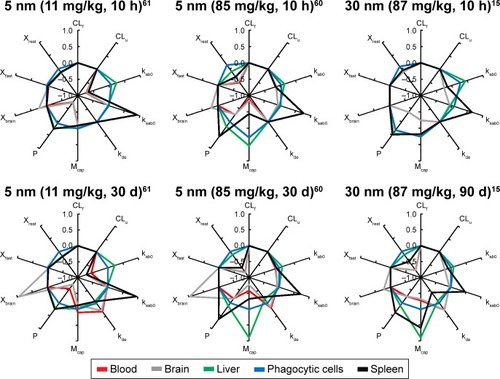
Figure 5 Dose-dependent sensitivity analyses of the physiologically based pharmacokinetic (PBPK) model calibrated with 5 and 30 nm ceria administered intravenously into rats.
Notes: Calculation of normalized sensitivity coefficients for dose when nanoceria is infused intravenously at a dose rate ranging from 10 to 90 mg/kg/h over 1 h. Normalized sensitivity coefficients for dose in tissues, 10 h after a dose of 5 nm ceria (A) and 30 nm ceria (B). Data for A and B from Yokel et al.Citation15,Citation61 Normalized sensitivity coefficients for dose in liver, 10 h after dosing and at end of experiment (C).
IV exposure – 30 nm ceria
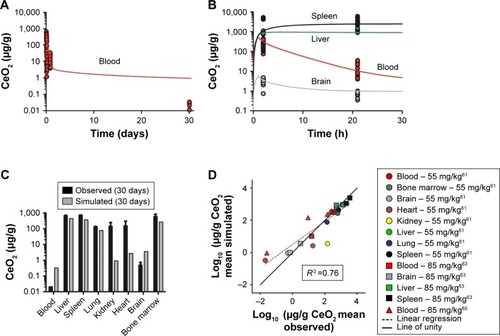
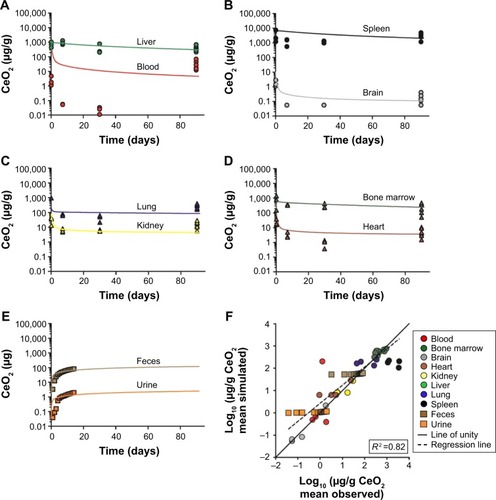
The model describes the experimental data for 30 nm ceria fairly well with a reasonable correlation between simulated and measured values (R2 =0.82, ). In particular, the time courses in liver and bone marrow are adequately captured with less than twofold difference between measured and simulated values. However, the increases in concentration observed after 90 days compared to 30 days after dosing in various tissues (blood, brain, heart, lung, and spleen) are not well captured, that is, the model overestimates at 30 days but underestimates at 90 days ().
Figure 6 Calibration of physiologically based pharmacokinetic (PBPK) model of 30 nm ceria administered intravenously into rats.
Notes: (A–E) Simulated (solid curves) and observed (symbols) time courses of the 30 nm ceria concentration in different tissues and accumulated mass in urine and feces following 1 h infusion of 85 mg/kg body weight. Data for A–E from Yokel et al.Citation15 (F) Comparison of logs of simulated and observed mean concentration in different tissues and mean mass accumulated in urine and feces. The line of unity (solid) represents a perfect match, and the regression line (R2, dashed) describes the outcome.
As expected, the nanoparticle-dependent parameters obtained for 30 nm ceria deviate from those obtained for 5 nm ceria (). Four of the fitted nanoparticle-dependent parameters (kab0, kde, Mcap, and Xfast) are similar, that is, within a factor of 2. The remaining four parameters differ more, thus, the uptake rate constant for PCs in spleen (ksab0) is 22-fold lower; the partition coefficient between blood and tissues (P) is fivefold lower; the coefficient of permeability from blood to lung, kidney, heart, and carcass (Xrest) is eightfold lower; and the coefficient of permeability from blood to brain (Xbrain) is 242-fold lower for the 30 nm compared to 5 nm ceria.
Table 5 Nanoparticle-dependent parameters of 5 and 30 nm ceria physiologically based pharmacokinetic (PBPK) model
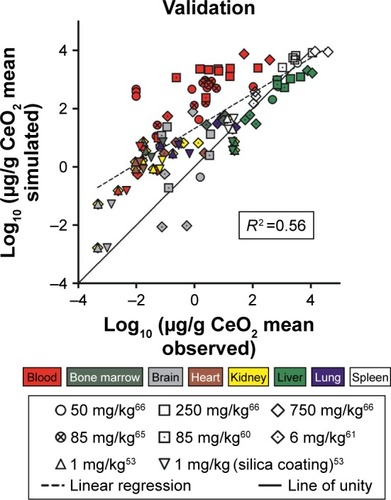
The validation of the model against independent data from 30 nm ceria show poor predictions for most tissues ( and S3–S10). The predictions are somewhat better for liver and spleen, compared to other tissues. Half of the predictions are within twofold of the experimental values.
Figure 7 Validation of the physiologically based pharmacokinetic (PBPK) model against independent data sets with 30 nm ceria administered intravenously into rats.
Notes: Comparison of logs of simulated and observed mean concentration in different tissues. The line of unity (solid) represents a perfect match, and the regression line (R2, dashed) describes the outcome. Different shapes/symbols represent different data sets and colors symbolize organs. Data from Konduru et al,Citation53 Yokel et al,Citation60,Citation61,Citation66 and Dan et al.Citation65
The sensitivity analysis for the 30 nm ceria shows similar pattern as for 5 nm but with fewer highly sensitive parameters ( and Tables S2–S7). The most influential nanoparticle-dependent parameters are kab0, ksab0, Mcap, P, and Xrest. A change in maximum uptake capacity of PCs has less influence on the sensitivity coefficient in the 30 nm model than in the 5 nm model (). Similar to the 5 nm PBPK model, the 30 nm PBPK model suggests nonlinear (saturated) biokinetics for nanoceria.
IV exposure – other sizes
It was not possible to calibrate the model for 15 and 55 nm ceria due to the limited and scattered experimental data. We therefore compared these two data sets to predictions based on the calibrations obtained with the 5 and 30 nm data. For both the data sets, the 5 nm provides better predictions than the 30 nm calibration. A closer look at the simulations reveals that the predictions for liver and spleen are reasonable, whereas those for blood and brain are poorer. For the 15 nm ceria, all liver and spleen values are within twofold difference, whereas for the 55 nm ceria, 80% are within fivefold and none differ more than 10-fold (Figures S11 and S12).
Inhalation, IT instillation, and oral exposure
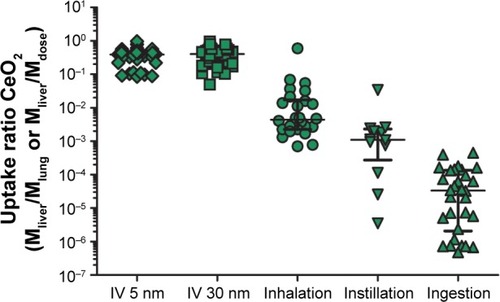
The compilation of data from inhalation, IT instillation, and oral biodistribution studies underscores that the systemic uptake via these routes is limited, in agreement with conclusions previously reached by others ().Citation16 Less than 1% (on mass basis) of the administered dose was distributed from lung to liver, and after oral gavage, the uptake to liver was <0.001%.
Figure 8 Uptake ratio of nanoceria to liver from different exposure routes.
Notes: Translocation of nanoceria from lung and gastrointestinal tract was calculated by dividing the cerium mass in liver with the administered dose, expressed as mass, that is, the uptake ratio. For inhalation, the cerium lung burden was used as the dose. For intravenous (IV) administration, the uptake ratio was calculated as the mass in liver divided by the administered dose. The symbols represent different data sets, and the colors represent different organs.
As systemic bioavailability differs among exposure routes, we normalized the time courses of concentration in tissues to that in liver. A comparison of the time courses to the blood:liver, spleen:liver, and brain:liver concentration ratios suggest several orders of magnitude of differences, between and among the IV, inhalation, IT instillation, and oral routes (Figures S13–S15). The time courses of the tissue:liver concentration ratios differ not only among exposure routes and studies but also between tissues (Figures S13–S15).
In spite of differences in size and coatings, the time courses of the ratios after IV administration differed distinctly from the ratios for other exposure routes, illustrated, for example, by the clearly lower blood:liver concentration ratios and the apparently higher spleen:liver concentration ratios (Figures S13–S15). Noticeably and expected, the concentration in brain was substantially lower than in liver after IV administration (3–5 orders of magnitude) and IT instillation (2–4 orders of magnitude) compared to inhalation exposure (0–2 order of magnitude), suggesting uptake via olfactory nerves (Figure S15). This contrasts to the distribution after oral dosing where, with few exceptions, the concentrations in brain are in the same range as, or up to 1 order of magnitude lower than, in the liver. Finally, this suggests that the exposure route has a large influence on the biokinetics.
The first calibration efforts with inhalation, IT instillation, and oral data were unsuccessful, in that the model parameters could not be estimated. In a second attempt, calibrations were performed by adjusting the route-specific parameters only and keeping all other model parameters from the 5 and 30 nm calibrations. With the second approach, the calibration was still unsuccessful for data set 1 from Li et al.Citation49 No calibration of the Kumari et al study was carried out as these data were considered uncertain due to the small amounts recovered in feces and analyzed organs, apparently <10% of the administered dose (Figure S16).Citation70 With few exceptions, poor fits were achieved for the remaining data sets (Figures S17–S23).Citation17,Citation49,Citation67,Citation69,Citation70
Discussion
The PBPK model described herein is the first to describe the biokinetics of nanoceria injected IV in rats. In line with previous studies, our simulations give additional support that both properties of nanoparticles (size and coating) and exposure conditions (dose and route) affect the biokinetics of nanoceria.Citation53,Citation60 It should be noted that there are data available on experimental biokinetics of nanoceria in mice.Citation72–Citation74 However, rats and mice differ substantially, especially with respect to the anatomy of the spleen and the properties of the MPS, which requires modification of the model.Citation75–Citation77
In a unique attempt to compare different exposure routes using PBPK modeling, the model structure was modified to include inhalation, instillation, and oral administration. However, modeling of these routes was difficult, and the results were inconclusive. We did not include intraperitoneal exposure as this route is not relevant for environmental exposure or pharmacological treatment. Moreover, when we carried out a literature search on IP administration, we did not find any suitable biodistribution data for PBPK modeling.
The model adequately predicts the biokinetics of 5 nm ceria with citrate coating given IV to rats. The model is less successful in capturing the kinetics of other sizes of nanoceria, which partly can be explained by the larger spread in properties among these particles. Size-dependent uptake of nanoparticles in PCs has been reported by several research groups, and the optimum uptake by cells seems to occur for sizes around 40–60 nm.Citation78,Citation79 However, several other factors may also affect the uptake and excretion, such as cell type, nanoparticle–membrane binding energy, nanoparticle curvature, and corona composition.Citation80–Citation83 In our simulations, some of the fitted parameters differed between 5 and 30 nm ceria suggesting size dependencies, whereas other parameters were similar for the two nanoceria sizes. Overall, our modeling results point to dependence not only on size but also on coating, dose, and exposure route on the biokinetics.
Coating is a known modifying factor of biokinetics for nanoparticles, including nanoceria.Citation53,Citation58,Citation62 According to Heckman et al, the clearance of nanoceria from blood is reduced when EDTA is added to the citrate coating.Citation62 Our model is well in line with this finding as our model, calibrated with citrate-coated 5 nm ceria, predicts a faster clearance than observed in experimental data with citrate/EDTA-coated 3 nm ceria.Citation62 Heckman et al argued that the prolonged blood circulation time observed for citrate/EDTA-coated nanoceria compared to citrate-coated nanoceria may be explained by fewer adsorbed proteins, resulting in reduced recognition and uptake by the mononuclear phagocytic system.Citation62 Similarly, Konduru et al proposed that the alteration in biodistribution patterns between uncoated and silica-coated nanoceria correlates with differences in the corona composition.Citation53
Our PBPK model includes saturable uptake of nanoceria in PCs as a major feature. At sufficiently high doses, tissue levels will be less than proportional to dose as the PCs approach saturation. Moreover, PCs are unevenly distributed among tissues and permeability into tissues varies, as high, medium, or low (Xbrain, Xfast, and Xrest). Therefore, the nano-ceria distribution pattern will change as the dose increases. To develop reliable and validated PBPK models, one would need to validate them against low (non-saturating) as well as high (saturating) doses. Unfortunately, nearly all experimental studies that could be used for modeling used a single dose only, or a very narrow dose span (–).
Our model was not designed to, and cannot, account for the peculiar biokinetic behavior seen in one of Yokel et al studies, where the concentration increased up to three orders of magnitude in various tissues between 1 and 3 months after IV infusion of 30 nm ceria ().Citation15 One possible explanation might be the dissolution of nano-ceria in the liver and subsequent release of cerium ion, resulting in increased cerium in the blood and redistribution to the spleen.Citation71,Citation84 On the other hand, the observed biokinetic pattern is not consistent with that reported for cerium ion.Citation14 If this peculiar increase is indeed a true biokinetic phenomenon, better understanding of the underlying physical or physiological mechanisms is needed in order to further develop the PBPK model. In addition, improved quantitative analytical methods that are able to distinguish between primary and secondary cerium oxide nanoparticles and cerium ions would be needed.
When comparing the experimental data for different exposure routes, it quickly became apparent that the present PBPK model is unable to describe the biokinetics for the non-IV routes. This was later confirmed during our modeling efforts. However, our comparison of the experimental data for IV, inhalation, instillation, and oral exposure suggests that the tissue distribution pattern is a result of the need for nanoceria to cross epithelial barriers before reaching the systemic circulation (see Figures S13–S15 for time course plots of tissue:liver concentration ratios for the different exposure routes). Modification of biodistribution as a result of exposure route has also been demonstrated for other types of nanoparticles such as gold.Citation85,Citation86 These pattern changes may be due to a “true” route dependency, but may also reflect differences in nanoparticle property, dose, tissue sampling techniques, sample treatment, analytical method, and so on among the studies. The underlying mechanisms are unclear; however, modified protein binding has been suggested as a likely factor.Citation86 Additional studies are needed to understand the possible route dependency and to rule out other experiment-related factors.
Development, calibration, and validation of PBPK models for nanoparticles require reliable and relevant experimental data that provide information about properties of nanoparticles as well as quantities in several tissues at multiple time points over extended periods. Among all published reports on nanoceria, only a few data sets comprised this type of information. Small sample size in combination with high intra- and inter-individual variability and method error are other complication factors for modeling as these lower the confidence in the parameter estimates as well as the model structure. An additional problem with the non-IV exposure routes is that absorption is generally low, resulting in very low tissue levels, sometimes below the detection limit and/or not different from background.
In the data sets provided by Yokel et al, we had access to raw data, and hence individual data on body weight and tissue weights could be used in the model.Citation15,Citation60,Citation61,Citation63,Citation65,Citation66 Information for the other data sets are more uncertain as they were reported as mean values. The latter situation typically reflects how data are reported in published biodistribution studies where individual data points are rarely provided. More frequent reporting of individual data would be helpful to improve model development and to facilitate discrimination between variability and uncertainty.
Due to lack of quantitative physiological knowledge, several of the PBPK parameters had to be fitted to experimental data. Such approaches may result in over parameterization, especially if the experimental data are limited to a few tissues and time points. In this study, 10 parameters were optimized and 156 data points were used to calibrate the model. Noteworthily, the number of data points were well above the number of parameters optimized which reduces the risk for over fitting. In addition, the model has successfully been used to describe the biokinetics of other nanoparticles (titanium dioxide, gold, and polyethylene-coated and -uncoated polyacryl amide) administered IV.Citation38,Citation52
A parameter with a high sensitivity coefficient means that a small change in this parameter will have a high impact on the model output. Reliable experimental data on these parameters are hence critical. On the other hand, a parameter with very low sensitivity can have a range of values with negligible impact on the output. Model estimates of such parameters are thus more uncertain. Overall, the sensitivity analysis showed time, dose, and size dependencies (, Tables S2–S7). The model parameters were generally more sensitive for the 5 nm than 30 nm ceria, and in addition, the sensitivity of the parameters increased with dose. The dose-dependent increase in sensitivity can be explained by increased nanoceria burden in the PCs, expressed as higher sensitivity coefficients for such parameters as the maximum uptake capacity per PC (Mcap), number of PCs per gram liver (ncap in liver), and liver fraction of body weight (kwl) (Tables S2–S7).
Experimental values for physiologically based parameters can be found in the literature, and many of them can also be readily measured.Citation87,Citation88 However, reliable data on, for example, residual amount of blood in tissues and number of PCs in tissues are sparse. Relevant and reliable experimental data on nanoparticle-dependent parameters are more difficult to find. Methods, primarily in vitro, are under development, but the result will depend on the properties of the nanoparticles and the test method used.Citation46,Citation89–Citation91 Correlations between in vitro and in vivo results need to be established to make route-to-route extrapolations.Citation92 Consequently, it is difficult, at least so far, to predict how properties of nanoparticles may affect the parameters of the PBPK model.
The biological environments in the gastrointestinal tract and the lungs differ from that in blood, and this may affect the behavior of the nanoparticles with respect to processes such as agglomeration, corona formation, and nanoparticle dissolution.Citation57,Citation93–Citation95 These processes depend not only on the environment but also on the properties of nanoparticles and contribute to changes in the biodistribution pattern.Citation54,Citation81,Citation96 There are also indications that the processes are dynamic and change over time.Citation54,Citation97,Citation98 Hence, an obvious next step would be to examine if introduction of these processes in the PBPK model improves the predictions. To our knowledge, there is no PBPK model for nanoparticles with physically relevant descriptions of agglomeration, corona formation, and dissolution, although dissolution has been empirically implemented in PBPK models for silver and zinc.Citation35,Citation45 A limiting factor is that the three processes have so far not been well characterized in quantitative terms, and consequently, they cannot yet be used in PBPK modeling.Citation54
Our model has a simplified structure that describes the deposition and transport processes in the lung and gastrointestinal tract. Research groups have shown that a more complex model structure for deposition and clearance in the respiratory system via mucociliary clearance to pharynx and uptake to brain via olfactory and trigeminal nerves is more adequate to predict the deposition of inhaled nanoparticles.Citation47,Citation49 Systemic uptake of nanoparticles via the lymphatic system and subsequent distribution to tissues has been demonstrated but so far not incorporated in any PBPK model for nanoparticles.Citation99,Citation100 This can be explained by the challenge in visualization and sampling of lymph nodes and the small amounts of nanoparticles therein; thus, the observations are qualitative rather than quantitative. Even if incorporated, the model would still not be able to explain the route-dependent biodistribution patterns.
Our study illustrates well the usefulness of PBPK modeling to better understand the biokinetics of nanoparticles. First, PBPK modeling can be used to challenge or generate hypotheses. Thus, the PBPK model described herein supports the hypothesis that coating and size influence biokinetics. Second, PBPK models can be used to identify knowledge gaps. In this study, we identified the need to update future models with mechanistic understanding of exposure route dependencies and nanoparticle interactions with body fluids such as corona formation, agglomeration, and dissolution. Third, PBPK models may be used to improve the design of experimental studies. Our modeling efforts suggest dose- and route-dependent biokinetics of nanoceria. Hopefully this will be taken into consideration when future biodistribution studies are designed. Fourth, PBPK models can be used to predict the biokinetics and tissue doses for new exposure scenarios without need for new experiments. This is particularly important in risk assessment of nanoparticles when there seems to be dose- or route-dependent biokinetics.
Conclusion
The PBPK model could adequately describe and predict the biokinetics for 5 nm ceria with citrate coating given IV but less well so for other sizes. For non-IV exposure routes, calibration was difficult due to low absorption, few samples, widely disparate data, and concentrations below or close to the detection limit. However, the tissue time courses seemed to differ from those in the IV experiments and had shapes that were difficult to reproduce with the PBPK model. Overall, our modeling results suggest that the biokinetics of nanoceria depend not only on the properties of nanoparticles (size and coating) but also, and even more so, on the exposure conditions (route and dose). Inclusion of physically and physiologically adequate descriptions of lung deposition, agglomeration, corona formation, and dissolution is needed. This requires improved mechanistic understanding and targeted experimental studies.
Author contributions
All authors contributed toward data analysis, drafting, and critically revising the paper and agree to be accountable for all aspects of the work.
Acknowledgments
The study was financed by the Swedish Research Council for Health, Working Life and Welfare (Forte, grant number 2010-0702), Sweden, and by the United States Environmental Protection Agency Science to Achieve Results (grant number RD-833772). Although the research described in this article has been funded in part by the United States Environmental Protection Agency through STAR Grant RD-833772, it has not been subjected to the Agency’s required peer and policy review and therefore does not necessarily reflect the views of the Agency and no official endorsement should be inferred.
Disclosure
The authors report no conflicts of interest in this work.
References
- SunCWLiHChenLQNanostructured ceria-based materials: synthesis, properties, and applicationsEnergy Environ Sci20125984758505
- MelchionnaMFornasieroPThe role of ceria-based nanostructured materials in energy applicationsMater Today2014177349357
- CasseeFRvan BalenECSinghCExposure, health and ecological effects review of engineered nanoscale cerium and cerium oxide associated with its use as a fuel additiveCrit Rev Toxicol201141321322921244219
- CastanoCEO’KeefeMJFahrenholtzWGCerium-based oxide coatingsCurr Opin Solid State Mater20151926976
- CelardoIPedersenJZTraversaEGhibelliLPharmacological potential of cerium oxide nanoparticlesNanoscale2011341411142021369578
- RoccaAMoscatoSRoncaFPilot in vivo investigation of cerium oxide nanoparticles as a novel anti-obesity pharmaceutical formulationNanomedicine20151171725173426003299
- WalkeyCDasSSealSCatalytic properties and biomedical applications of cerium oxide nanoparticlesEnviron Sci Nano201521335326207185
- ChigurupatiSMughalMROkunEEffects of cerium oxide nanoparticles on the growth of keratinocytes, fibroblasts and vascular endothelial cells in cutaneous wound healingBiomaterials20133492194220123266256
- ZhouXHWongLLKarakotiASSealSMcGinnisJFNanoceria inhibit the development and promote the regression of pathologic retinal neovascularization in the Vldlr knockout mousePLoS One201162e1673321364932
- KwonHJChaMYKimDMitochondria-targeting ceria nanoparticles as antioxidants for Alzheimer’s diseaseACS Nano20161022860287026844592
- Integrated laboratory Systems (ILS)Chemical information profile for ceric oxide [CAS No. 1306-38-3]. Supporting Nomination for Toxicological Evaluation by the National Toxicology Program2006 Available from: http://ntp.niehs.nih.gov/ntp/htdocs/chem_background/exsumpdf/ceric_oxide2_508.pdfAccessed March 12, 2018
- Organisation for Economic Co-operation and Development (OECD)List of manufactured nanomaterials and list of endpoints for phase one of the sponsorship programme for the testing of manufactured nanomaterials: revision2010 http://www.oecd.org/officialdocuments/publicdisplaydocumentpdf/?cote=env/jm/mono(2010)46&doclanguage=enAccessed March 12, 2018
- GeraetsLOomenAGSchroeterJDColemanVACasseeFRTissue distribution of inhaled micro- and nano-sized cerium oxide particles in rats: results from a 28-day exposure studyToxicol Sci2012127246347322430073
- MolinaRMKonduruNVJimenezRJBioavailability, distribution and clearance of tracheally instilled, gavaged or injected cerium dioxide nanoparticles and ionic ceriumEnviron Sci Nano201416561573
- YokelRAAuTCMacPhailRDistribution, elimination, and biopersistence to 90 days of a systemically introduced 30 nm ceria-engineered nanomaterial in ratsToxicol Sci2012127125626822367688
- YokelRAHussainSGarantziotisSDemokritouPCastranovaVCasseeFRThe yin: an adverse health perspective of nanoceria: uptake, distribution, accumulation, and mechanisms of its toxicityEnviron Sci Nano20141540642825243070
- KumariMKumariSIGroverPGenotoxicity analysis of cerium oxide micro and nanoparticles in Wistar rats after 28 days of repeated oral administrationMutagenesis201429646747925209125
- KellerJWohllebenWMa-HockLTime course of lung retention and toxicity of inhaled particles: short-term exposure to nano-ceriaArch Toxicol201488112033205925273020
- DemokritouPGassSPyrgiotakisGAn in vivo and in vitro toxicological characterisation of realistic nanoscale CeO2 inhalation exposuresNanotoxicology2013781338135023061914
- JohansonGToxicokinetics and modelingMcQueenCComprehensive Toxicology13rd ed2018165187OxfordElsevier Ltd
- IPCSCharacterization and application of physiologically based pharmacokinetic models in risk assessmentIPCS Harmonization Project Document No. 9Geneve, SwitzerlandWorld Health Organization (WHO)2010 Available from: http://www.who.int/ipcs/methods/harmonization/areas/pbpk_models.pdfAccessed March 12, 2018
- LinZMonteiro-RiviereNARiviereJEPharmacokinetics of metallic nanoparticlesWiley Interdiscip Rev Nanomed Nanobiotechnol20157218921725316649
- LiMAl-JamalKTKostarelosKReinekeJPhysiologically based pharmacokinetic modeling of nanoparticlesACS Nano20104116303631720945925
- SnipesMBLong-term retention and clearance of particles inhaled by mammalian speciesCrit Rev Toxicol19892031752112692607
- PengBAndrewsJNestorovIBrennanBNicklinPRowlandMTissue distribution and physiologically based pharmacokinetics of antisense phosphorothioate oligonucleotide ISIS 1082 in ratAntisense Nucleic Acid Drug Dev2001111152711258618
- LinPChenJWChangLWComputational and ultrastructural toxicology of a nanoparticle, Quantum Dot 705, in miceEnviron Sci Technol200842166264627018767697
- LeeHALeavensTLMasonSEMonteiro-RiviereNARiviereJEComparison of quantum dot biodistribution with a blood-flow-limited physiologically based pharmacokinetic modelNano Lett20099279479919128005
- PeryARBrochotCHoetPHNemmarABoisFYDevelopment of a physiologically based kinetic model for 99m-technetium-labelled carbon nanoparticles inhaled by humansInhal Toxicol200921131099110719814607
- MacCalmanLTranCLKuempelEDevelopment of a bio-mathematical model in rats to describe clearance, retention and translocation of inhaled nano particles throughout the bodyJ Phys Conf Ser20091511012028
- LankveldDPOomenAGKrystekPThe kinetics of the tissue distribution of silver nanoparticles of different sizesBiomaterials201031328350836120684985
- OpitzAWWickstromEThakurMLWagnerNJPhysiologically based pharmacokinetics of molecular imaging nanoparticles for mRNA detection determined in tumor-bearing miceOligonucleotides201020311712520406142
- LiMReinekeJMathemathical modelling of nanoparticle biodistribution: extrapolation among intravenous, oral and pulmonary administration routesInt J Nano Biomaterials201133222238
- MagerDEModyVXuCPhysiologically based pharmacokinetic model for composite nanodevices: effect of charge and size on in vivo dispositionPharmaceut Res201229925342542
- LiMPanagiZAvgoustakisKReinekeJPhysiologically based pharmacokinetic modeling of PLGA nanoparticles with varied mPEG contentInt J Nanomedicine201271345135622419876
- BachlerGvon GoetzNHungerbuhlerKA physiologically based pharmacokinetic model for ionic silver and silver nanoparticlesInt J Nanomedicine201383365338224039420
- KolanjiyilAVKleinstreuerCNanoparticle mass transfer from lung airways to systemic regions – Part II: multi-compartmental modelingJ Biomech Eng20131351212100424008585
- KaganLGershkovichPWasanKMMagerDEDual physiologically based pharmacokinetic model of liposomal and nonliposomal amphotericin B dispositionPharm Res2014311354523793994
- LiDJohansonGEmondCCarlanderUPhilbertMJollietOPhysiologically based pharmacokinetic modeling of polyethylene glycol-coated polyacrylamide nanoparticles in ratsNanotoxicology20148S112813724392664
- RajoliRKRBackDJRannardSPhysiologically based pharmacokinetic modelling to inform development of intramuscular long-acting nanoformulations for HIVClin Pharmacokinet201554663965025523214
- BachlerGvon GoetzNHungerbuhlerKUsing physiologically based pharmacokinetic (PBPK) modeling for dietary risk assessment of titanium dioxide (TiO2) nanoparticlesNanotoxicology20159337338025058655
- DongDWangXWangHLZhangXWWangYFWuBJElucidating the in vivo fate of nanocrystals using a physiologically based pharmacokinetic model: a case study with the anticancer agent SNX-2112Int J Nanomedicine2015102521253525848269
- LinZMonteiro-RiviereNARiviereJEA physiologically based phar-macokinetic model for polyethylene glycol-coated gold nanoparticles of different sizes in adult miceNanotoxicology201610216217225961857
- GilkeyMJKrishnanVScheetzLJiaXRajasekaranAKDhurjatiPSPhysiologically based pharmacokinetic modeling of fluorescently labeled block copolymer nanoparticles for controlled drug delivery in leukemia therapyCPT Pharmacometrics Syst Pharmacol201543e0001326225236
- ElgrabliDBeaudouinRJbilouNBiodistribution and clearance of TiO2 nanoparticles in rats after intravenous injectionPLoS One2015104e012449025909957
- ChenWYChengYHHsiehNHPhysiologically based pharmacokinetic modeling of zinc oxide nanoparticles and zinc nitrate in miceInt J Nanomedicine2015106277629226491297
- BachlerGLosertSUmeharaYTranslocation of gold nanoparticles across the lung epithelial tissue barrier: combining in vitro and in silico methods to substitute in vivo experimentsPart Fibre Toxicol20151211826116549
- SweeneyLMMacCalmanLHaberLTKuempelEDTranCLBayesian evaluation of a physiologically-based pharmacokinetic (PBPK) model of long-term kinetics of metal nanoparticles in ratsRegul Toxicol Pharmacol201573115116326145831
- LinZMonteiro-RiviereNAKannanRRiviereJEA computational framework for interspecies pharmacokinetics, exposure and toxicity assessment of gold nanoparticlesNanomedicine201611210711926653715
- LiDMorishitaMWagnerJGIn vivo biodistribution and physiologically based pharmacokinetic modeling of inhaled fresh and aged cerium oxide nanoparticles in ratsPart Fibre Toxicol20161314527542346
- LaomettachitTPuriIKLiangruksaMA two-step model of TiO2 nanoparticle toxicity in human liver tissueToxicol Appl Pharm20173344754
- LinZJaberi-DourakiMHeCPerformance assessment and translation of physiologically based pharmacokinetic models from acslX to Berkeley Madonna, MATLAB, and R Language: Oxytetracycline and gold nanoparticles as case examplesToxicol Sci20171581233528402537
- CarlanderULiDJollietOEmondCJohansonGToward a general physiologically-based pharmacokinetic model for intravenously injected nanoparticlesInt J Nanomedicine20161162564026929620
- KonduruNVJimenezRJSwamiASilica coating influences the corona and biokinetics of cerium oxide nanoparticlesPart Fibre Toxicol2015123126458946
- UtembeWPotgieterKStefaniakABGulumianMDissolution and biodurability: Important parameters needed for risk assessment of nanomaterialsPart Fibre Toxicol2015121125927337
- DecuzziPGodinBTanakaTSize and shape effects in the biodistribution of intravascularly injected particlesJ Control Release2010141332032719874859
- KeeneAMPetersDRouseRStewartSRosenETTynerKMTissue and cellular distribution of gold nanoparticles varies based on aggregation/agglomeration statusNanomedicine20127219920922339133
- TenzerSDocterDKuharevJRapid formation of plasma protein corona critically affects nanoparticle pathophysiologyNat Nanotechnol201381077278124056901
- OwensDE3rdPeppasNAOpsonization, biodistribution, and pharmacokinetics of polymeric nanoparticlesInt J Pharmaceut2006307193102
- CantonIBattagliaGEndocytosis at the nanoscaleChem Soc Rev20124172718273922389111
- YokelRATsengMTDanMBiodistribution and biopersistence of ceria engineered nanomaterials: size dependenceNanomedicine20139339840722960425
- YokelRAUnrineJMWuPWangBHGrulkeEANanoceria biodistribution and retention in the rat after its intravenous administration are not greatly influenced by dosing schedule, dose, or particle shapeEnviron Sci Nano201416549560
- HeckmanKLDeCoteauWEstevezACustom cerium oxide nanoparticles protect against a free radical mediated autoimmune degenerative disease in the brainACS Nano2013712105821059624266731
- HardasSSButterfieldDASultanaRBrain distribution and toxicological evaluation of a systemically delivered engineered nanoscale ceriaToxicol Sci2010116256257620457660
- KonduruNVJimenezRJSwamiAErratum to: Silica coating influences the corona and biokinetics of cerium oxide nanoparticles (vol 12, 31, 2015)Part Fibre Toxicol2016133527334863
- DanMWuPGrulkeEAGrahamUMUnrineJMYokelRACeria-engineered nanomaterial distribution in, and clearance from, blood: size mattersNanomedicine (Lond)2012719511022191779
- YokelRAFlorenceRLUnrineJMBiodistribution and oxidative stress effects of a systemically-introduced commercial ceria engineered nanomaterialNanotoxicology200933234248
- HeXZhangHMaYLung deposition and extrapulmonary translocation of nano-ceria after intratracheal instillationNanotechnology2010212828510320562477
- NalabotuSKKolliMBTriestWEIntratracheal instillation of cerium oxide nanoparticles induces hepatic toxicity in male Sprague-Dawley ratsInt J Nanomedicine201162327233522072870
- ParkEJParkYKParkKAcute toxicity and tissue distribution of cerium oxide nanoparticles by a single oral administration in ratsToxicol Res20092527984
- KumariMKumariSIKamalSSKGroverPGenotoxicity assessment of cerium oxide nanoparticles in female Wistar rats after acute oral exposureMutat Res Genet Toxicol Environ Mutagen201477571925435351
- GrahamUMTsengMTJasinskiJBIn vivo processing of ceria nanoparticles inside liver: impact on free-radical scavenging activity and oxidative stressChempluschem20147981083108826322251
- HirstSMKarakotiASinghSBio-distribution and in vivo antioxidant effects of cerium oxide nanoparticles in miceEnviron Toxicol201328210711821618676
- PortioliCBenatiDPilYShort-term biodistribution of cerium oxide nanoparticles in mice: Focus on brain parenchymaNanosci Nanotechnol Lett201351111741181
- AalapatiSGanapathySManapuramSAnumoluGPrakyaBMToxicity and bio-accumulation of inhaled cerium oxide nanoparticles in CD1 miceNanotoxicology20148778679823914771
- CestaMFNormal structure, function, and histology of the spleenToxicol Pathol200634545546517067939
- Van FurthRDiesselhoff-den DulkMMCharacterization of mononuclear phagocytes from the mouse, guinea pig, rat, and manInflammation19826139536282747
- HaleyPJSpecies differences in the structure and function of the immune systemToxicology20031881497112748041
- ChithraniBDGhazaniAAChanWCDetermining the size and shape dependence of gold nanoparticle uptake into mammalian cellsNano Lett20066466266816608261
- ZhangSLiJLykotrafitisGBaoGSureshSSize-dependent endocytosis of nanoparticlesAdv Mater20092141942419606281
- DasguptaSAuthTGompperGShape and orientation matter for the cellular uptake of nonspherical particlesNano Lett201414268769324383757
- DocterDWestmeierDMarkiewiczMStolteSKnauerSKStauberRHThe nanoparticle biomolecule corona: lessons learned – challenge accepted?Chem Soc Rev201544176094612126065524
- MuQXJiangGBChenLXChemical basis of interactions between engineered nanoparticles and biological systemsChem Rev2014114157740778124927254
- YokelRAPhysicochemical properties of engineered nanomaterials that influence their nervous system distribution and effectsNanomed Nanotechnol201612720812093
- GrahamUMYokelRADozierAKAnalytical high-resolution electron microscopy reveals organ-specific nanoceria bioprocessingToxicol Pathol2017461476129145781
- Semmler-BehnkeMKreylingWGLipkaJBiodistribution of 1.4- and 18-nm gold particles in ratsSmall20084122108211119031432
- KreylingWGHirnSMollerWAir-blood barrier translocation of tracheally instilled gold nanoparticles inversely depends on particle sizeACS Nano20148122223324364563
- BrownRPDelpMDLindstedtSLRhombergLRBelilesRPPhysiological parameter values for physiologically based pharmacokinetic modelsToxicol Ind Health19971344074849249929
- DaviesBMorrisTPhysiological parameters in laboratory animals and humansPharm Res1993107109310958378254
- TreuelLBrandholtSMaffrePWiegeleSShangLNienhausGUImpact of protein modification on the protein corona on nanoparticles and nanoparticle-cell interactionsACS Nano20148150351324377255
- CohenJMDeLoidGMDemokritouPA critical review of in vitro dosimetry for engineered nanomaterialsNanomedicine (Lond)201510193015303226419834
- SalvatiAAbergCdos SantosTExperimental and theoretical comparison of intracellular import of polymeric nanoparticles and small molecules: toward models of uptake kineticsNanomedicine20117681882621453790
- YoonMCampbellJLAndersenMEClewellHJQuantitative in vitro to in vivo extrapolation of cell-based toxicity assay resultsCrit Rev Toxicol201242863365222667820
- WohllebenWDriessenMDRaeschSInfluence of agglomeration and specific lung lining lipid/protein interaction on short-term inhalation toxicityNanotoxicology201610797098026984182
- WalczakAPFokkinkRPetersRBehaviour of silver nanoparticles and silver ions in an in vitro human gastrointestinal digestion modelNanotoxicology2013771198121022931191
- MarquesMRCLoebenbergRAlmukainziMSimulated biological fluids with possible application in dissolution testingDissolution Technol20111831528
- BruininkAWangJWickPEffect of particle agglomeration in nanotoxicologyArch Toxicol201589565967525618546
- ZhangWNanoparticle aggregation: principles and modelingAdv Exp Med Biol2014811194324683025
- WalkeyCDOlsenJBSongFProtein corona fingerprinting predicts the cellular interaction of gold and silver nanoparticlesACS Nano2014832439245524517450
- ChoiHSAshitateYLeeJHRapid translocation of nanoparticles from the lung airspaces to the bodyNat Biotechnol201028121300130321057497
- TobioMSanchezAVilaAThe role of PEG on the stability in digestive fluids and in vivo fate of PEG-PLA nanoparticles following oral administrationColloids Surf B Biointerfaces2000183–431532310915953