Abstract
Background
Melanin and manganese are both indispensable natural substances that play crucial roles in the human body. Melanin has been used as a multimodality imaging nanoplatform for biology science research because of its natural binding ability with metal ions (eg, 64Cu2+, Fe3+, and Gd3+). Because of its effects on T1 signal enhancement, Mn-based nanoparticles have been used in magnetic resonance (MR) quantitative cell tracking in vivo. Stem cell tracking in vivo is an essential technology used to characterize engrafted stem cells, including cellular viability, biodistribution, differentiation capacity, and long-term fate.
Methods
In the present study, manganese(II) ions chelated to melanin nanoparticles [MNP-Mn(II)] were synthesized. The characteristics, stem cell labeling efficiency, and cytotoxicity of the nanoparticles were evaluated. MR imaging of the labeled stem cells in vivo and in vitro were also further performed. In T1 relaxivity (r1), MNP-Mn(II) were significantly more abundant than Omniscan. Bone marrow-derived stem cells (BMSCs) can be labeled easily by coincubating with MNP-Mn(II), suggesting that MNP-Mn(II) had high biocompatibility.
Results
Cell Counting Kit-8 assays revealed that MNP-Mn(II) had almost no cytotoxicity when used to label BMSCs, even with a very high concentration (1,600 µg/mL). BMSCs labeled with MNP-Mn(II) could generate a hyperintense T1 signal both in vitro and in vivo, and the hyperintense T1 signal in vivo persisted for at least 28 days.
Conclusion
Taken together, our results showed that MNP-Mn(II) possessed many excellent properties for potential quantitative stem cell tracking in vivo.
Introduction
Stem cell transplantation has been used for the treatment of various diseases,Citation1–Citation5 owing to their advantageous properties, including multidifferentiation potential, self-renewal ability, the capacity to localize to the lesion area, and the capacity to act as a functional substitute for damaged cells.Citation6 However, the characteristics of engrafted stem cells, including cellular viability, biodistribution, differentiation capacity, and long-term fate, have not yet been determined.Citation6 Therefore, sequential visualization of engrafted stem cells in vivo is necessary to explore these mechanisms.Citation7
Currently, magnetic resonance imaging (MRI) is commonly used for noninvasive cell tracking in vivo. Recently, various types of nanoparticles have been utilized for cell labeling and cellular MRI to study stem cell transplantation, including Gd-loaded nanoparticles,Citation8,Citation9 iron oxide nanoparticles,Citation10 silica nanoparticles,Citation11,Citation12 quantum dots,Citation13 and upconversion nanoparticles.Citation14,Citation15 However, most of these particles are not ideal MR cell tracers, owing to inefficient cellular labeling, biotoxicity, or low relaxivity. For example, Gd(III)-based agents may produce nephrotoxicity,Citation16 and the dark signals produced by superparamagnetic iron oxide-based nanoparticles in T2-weighted images are difficult to distinguish from other tissues (such as the liver and spleen), physiological conditions (such as flow-void effects and air chambers), and diseases (such as hemorrhage and melanoma).Citation17,Citation18 Thus, many attempts to overcome such disadvantages have been made by searching for appropriate synthetic materials for nanoparticles to apply to cellular MRI.
Manganese is an essential element in humans, and is mainly distributed in the muscles, liver, kidneys, and brain in the form of manganese(II) ions. Manganese(II) can pass through calcium ion voltage-gated channels into the cell.Citation19 Hence, manganese(II) possesses much better biocompatibility than other paramagnetic metal ions,Citation20 particularly Gd(III) ions, which are widely applied as a clinical MR contrast agent.
Melanin is a ubiquitous pigment and an important chromophore in the human body. Melanin is produced by melanocytes, and is present in many human organs and tissues, including the skin, mucous membranes, retina, cerebral pia mater, and ovary.Citation21,Citation22 Melanin has many favorable properties, eg, good biocompatibility and metal ion chelation. Therefore, in recent years, increasing studies have explored the use of melanin in biological applications.Citation22–Citation24
Melanin nanoparticles have O-phenolic hydroxyl groups, which can easily chelate metal ions, such as 64Cu2+, Fe3+, Gd3+, and Mn2+.Citation24 Manganese(II) ions chelated to melanin nanoparticles [MNP-Mn(II)] are a novel type of nanoparticles used for stem cell MR tracking. These nanoparticles exhibit an ultrasmall size, minimal cytotoxicity, high relaxivity, and efficient and long-term cell labeling capacity. In this study, we report the development and characterization of these nanoparticles for stem cell labeling and cellular MR imaging of engrafted stem cells. All components of these nanoparticles were endogenous substances derived from humans. Our findings provide important insights into the potential applications of MNP-Mn(II) as novel cell MRI tracers in vivo.
Methods
Synthesis and characterization of MNP-Mn(II)
Details of the synthesis and characterization of MNP-Mn(II) complexes are provided in the Supplementary materials.
MRI of MNP-Mn(II) aqueous solution
Samples of MNP-Mn(II) and Omniscan (an MRI contrast agent commonly used in the clinic) aqueous solutions were imaged using a clinical 3.0T instrument (Trivo; Siemens, Munich, Germany) with a wrist surface coil (diameter: 11 cm). The samples of MNP-Mn(II) and Omniscan aqueous solutions were placed in polymerase chain reaction (PCR) plates at different Mn(II) and Gd(III) concentrations (0.1, 0.2, 0.4, 0.8, and 1.0 mM), and pure water was used as a negative control. The concentrations of Mn(II) and Gd(III) in aqueous solution were measured by inductively coupled plasma-atomic emission spectrometry. T1-weighted imaging (T1WI) was performed twice using different repetition times (300 and 100 ms) to measure the T1 value. Other T1WI parameters were as follows: spin-echo sequence, field of view (FOV): 90×60 mm2; slice thickness: 1.5 mm; spacing: 0.5 mm; base matrix resolution: 256×256; and effective echo time: 20 ms. The T1 relaxation efficient (r1) values of MNP-Mn(II) and Omniscan were obtained by calculating the ratio of 1/T1 [s-1] to the Mn(II) and Gd(III) concentrations (mM).
Ethics statement
All animal experiments was approved by the Institutional Animal Care and Use Committee of Shanxi Medical University (approval no 2016LL141) and complied with the US Guide for the Care and Use of Laboratory Animals, 8th Edition, 2011.Citation25
Bone marrow-derived stem cell (BMSC) labeling
BMSCs were harvested by primary culture, as described in our previous study.Citation26 Briefly, BMSCs were incubated in 25-cm2 tissue culture flasks and, after reaching 70%–80% confluence, the medium was replaced with fresh complete culture medium containing MNP-Mn(II) at a concentration of 800 µg/mL. The cells were subsequently cultured for 24 h at 37°C in a 5% CO2 incubator. The medium was then discarded, and the cells were carefully rinsed five times with phosphate-buffered saline (PBS) to remove the unlabeled MNP-Mn(II), followed by trypsinization. The pooled cells were obtained by centrifugation (1,000×g, 5 min) and then resuspended in 1 mL serum-free culture medium for future analysis.
Confocal fluorescence microscopy analysis
MNP-Mn(II) (5 mg) and rhodamine-B (0.2 mg) were mixed in 5 mL water and stirred for 1 h at 40°C using a magnetic stirrer. The chelator MNP-Mn(II)-rhodamine-B was obtained though intermolecular crosslinking and electric attraction. The obtained MNP-Mn(II)-rhodamine-B aqueous solution was washed several times with ultrapure water in an ultra-filtration centrifuge tube (Amicon Ultra, 30 kDa; Millipore, Billerica, MA, USA) by centrifugation (4,000–5,000×g, 15 min) to remove unchelated rhodamine-B.
BMSCs were incubated with MNP-Mn(II)-rhodamine-B (200 µg/mL) for 4 h at 37°C. The cells were then washed with PBS three times and fixed with 4% paraformaldehyde for 15 min at 4°C. After drying, the cell nuclei were stained with 4′,6-diamidino-2-phenylindole (DAPI). Finally, the fluorescence images were recorded and analyzed by confocal laser-scanning microscope (FV1000; Olympus, Tokyo, Japan).
Transmission electron microscopy (TEM)
TEM was used to visualize the intracellular distribution of MNP-Mn(II). For this, MNP-Mn(II)-labeled and unlabeled cells were resuspended and centrifuged at 1,500×g for 5 min, yielding cell pellets. After the supernatants were removed, cell pellets were fixed at 4°C with 2% glutaraldehyde for 1 h, and washed with PBS several times. The cells were then post-fixed with 1% OsO4 for 1 h, dehydrated in a graded series of ethanol solutions. The cells in ultrathin sections were obtained using an ultramicrotome (Leica EM UC-6; Leica Microsystems, Mannheim, Germany) and stained with uranyl acetate and lead citrate. Finally, the sections were visualized using a TEM (JEM-1011; JEOL).
In vitro cytotoxicity assessment
To assess the cytotoxicity of MNP-Mn(II), Cell Counting Kit-8 (CCK-8) assays were performed. Briefly, BMSCs were trypsinized and seeded on 96-well plates (5×10³ cells/well). Cells were cultured overnight, and the medium was replaced with fresh Dulbecco’s Modified Eagle’s Medium/F12 containing MNP-Mn(II) or MNPs at various concentrations (0, 25, 50, 100, 200, 400, 800, and 1,600 µg/mL), followed by incubation for 48 h at 37°C in a 5% CO2 incubator. Culture medium containing MNP-Mn(II) was then discarded, and the cells were subsequently washed three times with PBS. Fresh culture medium containing 10 µL CCK-8 reagent was added into the wells and incubated for 4 h at 37°C in a 5% CO2 incubator.
Finally, the absorbance of each well was measured at 450 nm and recorded using a microplate reader (Infinite M1000; TECAN, Morrisville, NC, USA). All samples were assayed in triplicate.
In vitro MRI
After incubation with various concentrations of MNP-Mn(II) (0, 50, 100, 200, 400, and 800 µg/mL) for 24 h, cells were centrifuged and fixed with 4% paraformaldehyde for 20 min at 4°C. The cells were then resuspended and transferred to 96-well PCR plates at a density of 1.5×10⁶ cells/well. T1-weighted imaging of the cells was performed using a clinical 3.0T MRI instrument (Trivo; Siemens) with a wrist surface coil (diameter: 11 cm). The detailed parameters were as follows: spin-echo sequence; FOV: 60×90 mm; matrix size: 180×256; slice thickness: 1.5 mm; spacing: 0.5 mm; TR: 500 ms; and TE: 20 ms.
In vivo MRI of engrafted BMSCs
A total of four male Sprague-Dawley rats (Animal Center of Shanxi Medical University, Taiyuan, China; SYXK2015-0001; 6 weeks of age, weighing 70–80 g each) were used in this study.
All rats were intraperitoneally administered 1% pentobarbital sodium (40 mg/kg) for anesthetization. Intramuscular injection of a 100-µL suspension containing 2×10⁶ BMSCs labeled with or without MNP-Mn(II) was then performed into the right hip. The injection positions were marked on the skin. MRI of the rats was carried out using a clinical 3.0T MRI instrument (Trivo; Siemens) with a wrist surface coil (diameter: 11 cm) on day 1 before injection and on days 1, 7, 10, 14, 21, and 28 after BMSC injection. The imaging parameters were the same as those of the above-mentioned in vitro MRI experiments.
The signal intensities (SIs) of the MNP-Mn(II)-labeled BMSC injection region and the adjacent soft tissue were measured, and the relative SIs were calculated to further evaluate the imaging capability of MNP-Mn(II)-labeled BMSCs in vivo. The area of the hyperintense signal generated by MNP-Mn(II)-labeled BMSCs was also measured at the same time.
Results and discussion
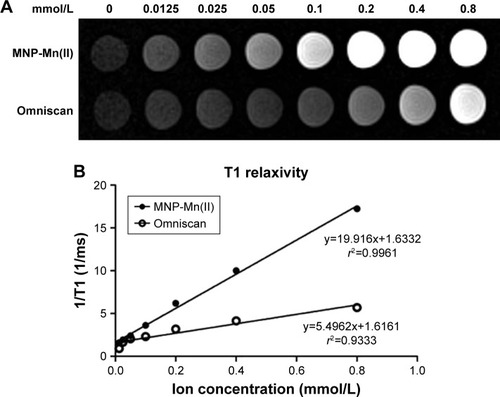
As shown in , MNP-Mn(II) nanoparticles exhibited many excellent properties, such as good water solubility, high stability, and ultrasmall and uniform particle size. Nonetheless, an MR-positive cell tracer must have high longitudinal relaxivity. To evaluate the T1-weighted imaging capability of MNP-Mn(II), we investigated the T1-weighted image SIs of MNP-Mn(II) and Omniscan aqueous solutions with various concentrations. As shown in , the SI of the MNP-Mn(II) aqueous solution was significantly higher than that of the Omniscan aqueous solution at the same molar concentration. Owing to the intrinsic paramagnetic properties of the Mn(II) ion, MNP-Mn(II) exhibited excellent T1 relaxation efficacy. The r1 values, which represented the longitudinal relaxation of MNP-Mn(II) and Omniscan, were calculated from the slopes of the ion concentration-dependent relaxation 1/T1. As shown in , T1 relaxivity was significantly higher for MNP-Mn(II) (r1 = 19.916/mmol/s) than for Omniscan (r1 = 5.4962/mmol/s) under the same testing conditions. These results further suggested that MNP-Mn(II) had the potential to be applied to MR cell tracking in vivo.
Figure 1 (A) T1-weighted MRI of MNP-Mn(II) and Omniscan aqueous solutions. (B) Plots of T1 relaxation rates (1/T1) for MNP-Mn(II) and Omniscan aqueous suspensions based on metal ion (ie, Mn2+, Gd3+) concentrations (mM). The slope of each regression represents the relaxivity (ie, r1).
Abbreviations: MNP-Mn(II), manganese (II) ions chelated to melanin nanoparticles; MRI, magnetic resonance imaging.
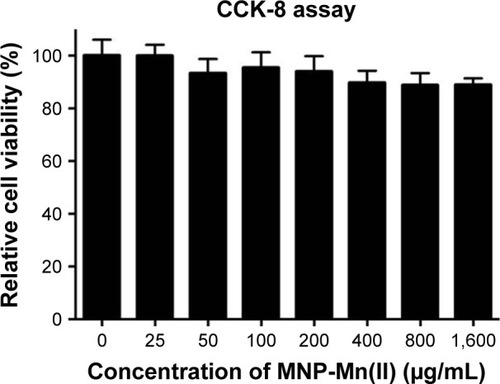
Excellent cell tracers must also show effective cellular labeling and low cytotoxicity.Citation27 Therefore, the cell labeling capability of MNP-Mn(II) was investigated using rhodamine staining and TEM, and cytotoxicity was evaluated with CCK-8 assays. Laser scanning microscope images () showed that many red fluorescent particles representing MNP-Mn(II)-rhodamine were present in the cytoplasm. TEM images () also showed that many black particles representing MNP-Mn(II) aggregated in the cytoplasm and lysosome of BMSCs, and there were no black particles in the cytoplasm or endosomes of unlabeled BMSCs. Fontana–Masson staining was further performed to evaluate the labeling rate of cells (). From these images, we found that almost all of the stem cells were successfully labeled with MNP-Mn(II) by co-incubation alone, without the need to use any transfection agents, demonstrating the excellent affinity of MNP-Mn(II) to the cells. As shown in , BMSCs labeled with 1,600 µg/mL MNP-Mn(II) exhibited very high cell viability. These results demonstrated that MNP-Mn(II) could be easily taken up and internalized by BMSCs without the aid of transfection agents, and that these nanoparticles had almost no cytotoxicity.
Figure 2 Confocal microscopy image of MNP-Mn(II)-rhodamine-B-labeled BMSCs. (A) Rhodamine (red) in the cytoplasm, (B) cell nuclei (stained by DAPI, blue), and (C) merged image; scale bars =25 µm.
Abbreviations: BMSCs, bone marrow-derived stem cells; DAPI, 4′,6-diamidino-2-phenylindole; MNP-Mn(II), manganese (II) ions chelated to melanin nanoparticles.

Figure 3 TEM images of MNP-Mn(II)-labeled BMSCs and unlabeled BMSCs; scale bars =2 µm. (A) Black particles representing the internalized MNP-Mn(II) were observed in the cytoplasm and endosomes of labeled BMSCs (enlarged in the upper right corner). (B) No black particles were observed in endosomes of unlabeled BMSCs.
Abbreviations: BMSCs, bone marrow-derived stem cells; MNP-Mn(II), manganese (II) ions chelated to melanin nanoparticles; TEM, transmission electron microscopy.
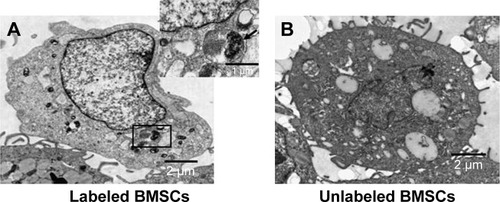
Figure 4 Cytotoxicity assessment of BMSCs labeled with MNP-Mn(II) at various concentrations (0, 25, 50, 100, 200, 400, 800, and 1,600 µg/mL) was performed using CCK-8 assays. The relative cell viability was estimated by measuring the optical density of each well at 450 nm.
Abbreviations: BMSCs, bone marrow-derived stem cells; CCK-8, Cell Counting Kit-8; MNP-Mn(II), manganese (II) ions chelated to melanin nanoparticles.
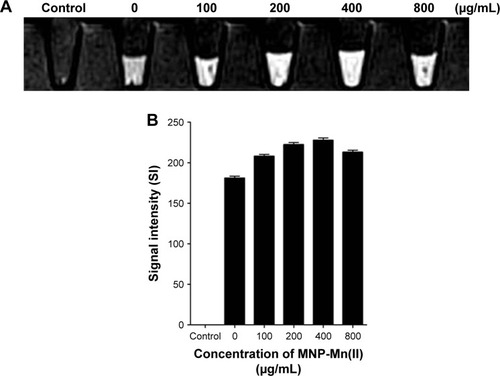
Based on these properties of MNP-Mn(II), we further assessed the in vitro and in vivo MRI of BMSCs labeled with MNP-Mn(II). As shown in , the cells were labeled with 0, 100, 200, 400, or 800 µg/mL MNP-Mn(II), and we found that cells labeled with 400 µg/mL exhibited the highest T1 SI at all labeling concentrations. However, the T1 SI at 800 µg/mL was lower than that at 400 µg/mL, potentially because the high concentration of MNP-Mn(II) in the cell may have shortened the transverse relaxation time. Thus, the peak of the signal could not be detected using the MR equipment, and the SI of the T1 images decreased.Citation28 This phenomenon was also observed for other paramagnetic contrast agents.Citation29
Figure 5 (A) T1-weighted images of BMSCs labeled with MNP-Mn(II) at various concentrations (0, 100, 200, 400, and 800 µg/mL) in vitro. PBS was used as the control group. (B) MRI signal intensity of BMSCs labeled with MNP-Mn(II) at various concentrations (0, 100, 200, 400, and 800 µg/mL).
Abbreviations: BMSCs, bone marrow-derived stem cells; MNP-Mn(II), manganese (II) ions chelated to melanin nanoparticles; MRI, magnetic resonance imaging; PBS, phosphate-buffered saline.
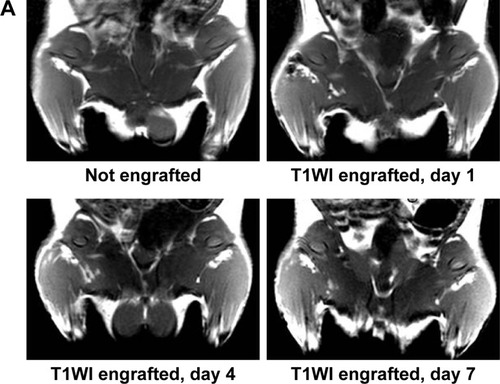
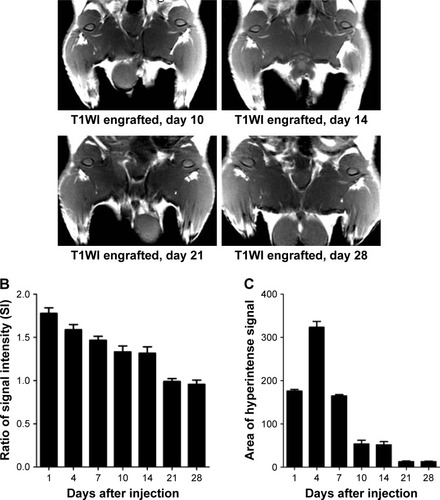
To further assess the capability of BMSCs labeled with MNP-Mn(II) for in vivo MRI, labeled BMSCs were intramuscularly injected into the right hips of rats. As shown in , a hyperintense T1 signal generated by MNP-Mn(II)-labeled BMSCs was observed in the right thigh after injection, and was maintained for at least 28 days; no hyperintense T1 signal was observed in the right thigh before injection. As shown in , on day 1 after injection, the relative SI of the hyperintense T1 signal region was the highest at all time points, and the relative SI decreased gradually over time. On day 28 after injection, the SI was maintained at a relatively stable level, sufficient to allow for monitoring of engrafted cells. In addition, the area of the hyperintense T1 signal increased gradually within 4 days after injection. After reaching a maximum on day 4 after injection, the area decreased gradually over time. These results supported the suitability of MNP-Mn(II) as novel cell MR tracers for use in the long-term monitoring of the fate of engrafted BMSCs in vivo.
Figure 6 (A) T1WIs of rats before MNP-Mn(II)-labeled BMSCs were injected into the right hip. T1WIs of rats after MNP-Mn(II)-labeled BMSCs were injected into the right hip on days 1, 4, 7, 14, 21, and 28. Hyperintense T1 signals in the right hip represented the presence of engrafted MNP-Mn(II)-labeled BMSCs in vivo. (B) The relative signal intensity of the MNP-Mn(II)-labeled BMSC injection region and the adjacent soft tissue over time. (C) The area of time-dependent hyperintense signals generated by MNP-Mn(II)-labeled BMSCs.
Abbreviations: BMSCs, bone marrow-derived stem cells; MNP-Mn(II), manganese (II) ions chelated to melanin nanoparticles; MRI, magnetic resonance imaging; PBS, phosphate-buffered saline; WI, weighted image.
Compared with other positive MR cell tracers, such as gadolinium-based MR contrast agents, the main advantage of the novel MNP-Mn(II) is their high level of biosafety; the main components (melanin and manganese) are endogenous substances found in the human body. Hence, MNP-Mn(II) have almost no cytotoxicity in labeled BMSCs, even when used at a very high concentration. Additionally, MNP-Mn(II) can be easily taken up and internalized by BMSCs only by co-incubation without any transfection agents. In addition, BMSCs labeled with MNP-Mn(II) can generate a brighter signal in T1-weighted images both in vitro and in vivo, owing to the higher T1 relaxivity of MNP-Mn(II), and the brighter signal can also be maintained for a long duration.
Conclusion
In summary, our findings demonstrated that MNP-Mn(II) had potential applications as MR stem cell tracers in vivo, owing to their excellent properties. We believe that these novel nanoparticles will be useful in studies of engrafted stem cells. In future studies, we will aim to further improve the nanostructures of the novel nanoparticles to achieve stem cell-based multimodal imaging and treatment integration, by incorporating other functional groups, such as 64Cu2+, Fe3+, and sorafenib, into the nanoparticles.Citation23,Citation24
Acknowledgments
This work was financially supported by the National Natural Science Foundation of China (grant numbers 81371628, 81571747, and 81771907), Overseas Students Science and Technology Projects, Shanxi Scholarship Council of China (number 2015057), Key Research and Development Project of Shanxi Province (numbers 2016021 and 201703D321015-3), Science and Technology Innovation Team Project (number 201705D131026), Scientific and Technological Achievements Transformation Project of Shanxi Province (number 201704D131006), and Shanxi Province Science Foundation for Youths (number 201701D221257).
Supplementary materials
Synthesis of water-dispersible melanin nanoparticles (MNPs)
Water-dispersible MNPs were synthesized according to a previously described procedure.Citation1 Briefly, 20 mg melanin (Sigma-Aldrich, St Louis, MO, USA) was dissolved in 4 mL of 0.1 M NaOH (Sigma-Aldrich) using an ultrasonic bath. HCl (37 wt%; Sigma-Aldrich) was dripped gradually to adjust the pH to 7.0–8.0, and an ultrasonic processor was used to decentralize MNPs. The obtained MNPs aqueous solution was transferred to an ultrafiltration centrifuge tube (Millipore Amicon Ultra, 30 kDa, EMD Millipore, Billerica, MA, USA) and then purified by centrifugation (4,000–5,000×g, 30 min) and washed with deionized water several times until the filtered water became clear. About 1 mL of MNP aqueous solution was left in the tube and then lyophilized for 24 h using a vacuum freeze dryer. Ultimately, ~14 mg of black solid water-dispersible MNPs was obtained.
Surface modification of MNPs
The surface of MNPs was further modified by polyethylene glycol (PEG, NH2-PEG5000-NH2, 5 kDa; Laysan Bio, Arab, AL, USA). The previously lyophilized MNPs were redissolved in alkaline solution, and the pH was adjusted to 9.5 by adding 0.1 M NaOH aqueous solution dropwise. Approximately 70 mg PEG was dissolved in ~8 mL ultrapure water in an ultrasonic bath, and the pH was also adjusted to 9.5 by adding 0.1 M NaOH aqueous solution dropwise. Under the protection of nitrogen, the PEG and MNP aqueous solutions were mixed together and stirred for 24 h at room temperature using a magnetic stirrer. The solution was then transferred to an ultrafiltration centrifuge tube and washed five times with deionized water by centrifugation (4,000–5,000×g, 15 min) to remove the free PEG. The pH of the final PEG–MNP aqueous solution was nearly 7.0.
Synthesis of Mn2+-PEG-MNPs
In total, 4 mL of 2.5 mg/mL MNP aqueous solution was mixed with 100 µL of 100 mg/mL MnCl2 aqueous solution and then stirred gently at 40°C for 2 h. To ensure that the MNPs were fully chelated with Mn2+ ions, moderately excessive Mn2+ ions were required. The molar ratio of MNPs and Mn2+ ions in the resulting chelate was ~1:200. The obtained chelation products were then purified using a PD-10 column (GE Healthcare, Chicago, IL, USA) to removed free Mn2+ and Cl−.
Characterization of Mn2+-PEG-MNPs
The morphology of Mn2+-PEG-MNPs was observed using a transmission electron microscope (TEM; JEM-1011; JEOL, Tokyo, Japan). The hydrodynamic diameters were measured by dynamic light scattering (DLS; Zetasizer Nano ZS90; Malvern Instruments, UK). TEM images () and sizes distribution of DLS () showed mono-dispersed spherical nanoparticles of ~5 nm (approximate range = 3–7 nm).
The Mn2+ ion concentration in 10 mL of 0.02 mg/mL Mn2+-PEG-MNP aqueous solution was measured by inductively coupled plasma mass spectrometry (ICP-MS). The ICP-MS results revealed that the Mn2+ ion concentration was about 1.74 mg/L, and the quantity of Mn2+ ions chelated to a single MNP was about 69.5.
The stability of Mn2+ ion-chelated MNPs was also analyzed in phosphate-buffered saline (PBS; pH = 7.4). As shown in , only about 3% Mn2+ ions were released from Mn2+-PEG-MNPs, and the quantity of released Mn2+ ions did not increase further during subsequent incubation times, even at 48 h. These results indicated that Mn2+-PEG-MNPs had high stability.
Fontana–Masson staining
Fontana–Masson staining (Solarbio, G2032) was performed to identify the MNP-Mn2+ labeling rate of bone marrow-derived stem cells (BMSCs). After labeling with MNP-Mn2+, the BMSCs were fixed with paraformaldehyde for 15 min at room temperature, washed three times with PBS, and then incubated in ammoniacal silver solution for 35 min at 56°C in a darkroom. Next, samples were rinsed five times with deionized water, soaked in 5% sodium thiosulfate solution for 5 min at room temperature, and then rinsed again with running pure water for 3 min. Finally, samples were counterstained with neutral red staining solution for 5 min at room temperature in a darkroom. The labeled BMSCs were observed using a phase-contrast microscope (E100; Nikon, Tokyo, Japan).
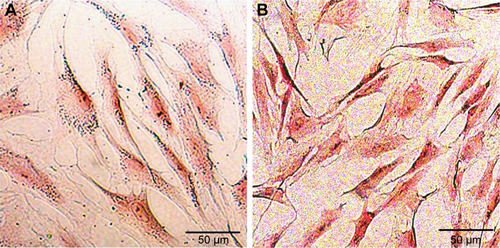
Black particles representing Mn2+-PEG-MNPs were observed in the cytoplasm of labeled BMSCs, while no black particles were observed in the cytoplasm of unlabeled BMSCs. Additionally, the Mn2+-PEG-MNP labeling rate of the BMSCs was nearly 100% ().
Figure S1 Characterization of the physical properties of Mn2+-PEG-MNPs. (A) From left to right: 2 mg/mL PEG-MNPs and 2 mg/mL Mn2+-PEG-MNPs. (B) TEM image of Mn2+-PEG-MNPs (scale bar =50 nm). (C) TEM image of MNPs (scale bar =50 nm). (D) Particle-size distribution of Mn2+-PEG-MNPs. (E) Stability analysis of Mn2+-PEG-MNPs in PBS (pH =7.4).
Abbreviations: DLS, dynamic light scattering; h, hours; MNPs, melanin nanoparticles; PBS, phosphate-buffered saline; PEG, polyethylene glycol; TEM, transmission electron microscope.
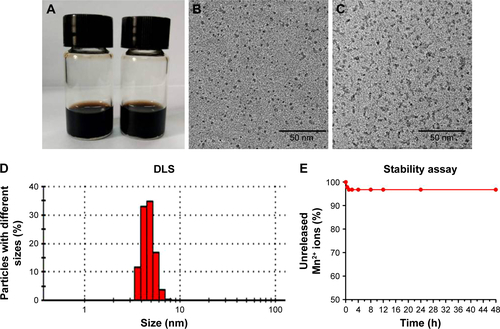
Figure S2 Fontana–Masson staining of Mn2+-PEG-MNP-labeled and unlabeled BMSCs. (A) Black particles representing Mn2+-PEG-MNPs were observed in the cytoplasm of labeled BMSCs. (B) Black particles were not observed in the cytoplasm of labeled BMSCs. Magnification =200×. Scale bars =50 µm.
Abbreviations: BMSCs, bone marrow-derived stem cells; MNPs, melanin nanoparticles; PEG, polyethylene glycol.
Reference
- FanQChengKHuXMaXZhangRYangMTransferring biomarker into molecular probe: melanin nanoparticle as a naturally active platform for multimodality imagingJ Am Chem Soc201413643151851519425292385
Disclosure
The authors report no conflicts of interest in this work.
References
- NeussSSchneiderRKTietzeLKnuchelRJahnen-DechentWSecretion of fibrinolytic enzymes facilitates human mesenchymal stem cell invasion into fibrin clotsCells Tissues Organs20101911364619390164
- Talavera-AdameDWuGHeYNgTTGuptaAKurtovicSEndothelial cells in co-culture enhance embryonic stem cell differentiation to pancreatic progenitors and insulin-producing cells through BMP signalingStem Cell Rev20117353254321298405
- MaijenburgMWGilissenCMeliefSMKleijerMWeijerKTen BrinkeANuclear receptors Nur77 and Nurr1 modulate mesenchymal stromal cell migrationStem Cells Dev201221222823821480782
- BarryFPMurphyJMMesenchymal stem cells: clinical applications and biological characterizationInt J Biochem Cell Biol200436456858415010324
- ShenYShaoYHeHTanYTianXXieFGadolinium(3+)-doped mesoporous silica nanoparticles as a potential magnetic resonance tracer for monitoring the migration of stem cells in vivoInt J Nanomedicine2013811912723319863
- CenPChenJHuCFanLWangJLiLNoninvasive in-vivo tracing and imaging of transplanted stem cells for liver regenerationStem Cell Res Ther20167114327664081
- ShichinoheHKurodaSLeeJBNishimuraGYanoSSekiTIn vivo tracking of bone marrow stromal cells transplanted into mice cerebral infarct by fluorescence optical imagingBrain Res Brain Res Protoc200413316617515296854
- TsengCLShihILStobinskiLLinFHGadolinium hexanedione nanoparticles for stem cell labeling and tracking via magnetic resonance imagingBiomaterials201031205427543520400176
- KimKSParkWNaKGadolinium-chelate nanoparticle entrapped human mesenchymal stem cell via photochemical internalization for cancer diagnosisBiomaterials201536909725301637
- WangJXieJZhouXChengZGuNTengGFerritin enhances SPIO tracking of C6 rat glioma cells by MRIMol Imaging Biol2011131879320440566
- JokerstJVKhademiCGambhirSSIntracellular aggregation of multimodal silica nanoparticles for ultrasound-guided stem cell implantationSci Transl Med20135177177ra35
- KimTMominEChoiJYuanKZaidiHKimJMesoporous silica-coated hollow manganese oxide nanoparticles as positive T1 contrast agents for labeling and MRI tracking of adipose-derived mesenchymal stem cellsJ Am Chem Soc201113392955296121314118
- GaoJChenKXieRXieJLeeSChengZUltrasmall near-infrared non-cadmium quantum dots for in vivo tumor imagingSmall20106225626119911392
- HuXZhuJLiXZhangXMengQYuanLDextran-coated fluorapatite crystals doped with Yb3+/Ho3+ for labeling and tracking chondrogenic differentiation of bone marrow mesenchymal stem cells in vitro and in vivoBiomaterials20155244145125818450
- ChengLWangCMaXWangQChengYWangHMultifunctional upconversion nanoparticles for dual-modal imaging-guided stem cell therapy under remote magnetic controlAdv Funct Mater2013233272280
- NaHBLeeJHAnKParkYIParkMLeeISDevelopment of a T1 contrast agent for magnetic resonance imaging using MnO nanoparticlesAngew Chem Int Ed Engl200746285397540117357103
- TranLAKrishnamurthyRMuthupillaiRCabreira-Hansen MdaGWillersonJTPerinECGadonanotubes as magnetic nanolabels for stem cell detectionBiomaterials201031369482949120965562
- GengKYangZXHuangDYiMJiaYYanGTracking of mesenchymal stem cells labeled with gadolinium diethylenetriamine pentaacetic acid by 7T magnetic resonance imaging in a model of cerebral ischemiaMol Med Rep201511295496025352164
- LeeJHKoretskyAPManganese enhanced magnetic resonance imagingCurr Pharm Biotechnol20045652953715579042
- TanMYeZJeongEKWuXParkerDLLuZRSynthesis and evaluation of nanoglobular macrocyclic Mn(II) chelate conjugates as non-gadolinium(III) MRI contrast agentsBioconj Chem2011225931937
- RileyPAMelaninInt J Biochem Cell Biol19972911123512399451820
- DongHLiuZZhongHYangHZhouYHouYMelanin-associated synthesis of SERS-active nanostructures and the application for monitoring of intracellular melanogenesisNanomaterials (Basel)20177370
- ZhangRFanQYangMChengKLuXZhangLEngineering melanin nanoparticles as an efficient drug-delivery system for imaging-guided chemotherapyAdv Mater201527345063506926222210
- FanQChengKHuXMaXZhangRYangMTransferring biomarker into molecular probe: melanin nanoparticle as a naturally active platform for multimodality imagingJ Am Chem Soc201413643151851519425292385
- National Research CouncilGuide for the care and use of laboratory animals8th edWashington, DCNational Academies Press2011
- ZhangRPWangLJHeSXieJLiJDEffects of magnetically guided, SPIO-labeled, and neurotrophin-3 gene-modified bone mesenchymal stem cells in a rat model of spinal cord injuryStem Cells Int20162016201847426649047
- WangJJokerstJVStem cell imaging: tools to improve cell delivery and viabilityStem Cells Int20162016924065226880997
- ReimerPParizelPMMeaneyJFMStichnothFAClinical MR imaging: A practical approach3rd edSecaucus, NJSpringer2010
- CrichSGBianconeLCantaluppiVDuòDEspositoGRussoSImproved route for the visualization of stem cells labeled with a Gd-/Eu-chelate as dual (MRI and fluorescence) agentMagn Reson Med200451593894415122675
