
Abstract
Background
Core–shell-structured nanoparticles (NPs) have attracted much scientific attention due to their promising potential in biomedical fields in recent years. However, their underlying mechanisms of action and potential adverse effects following administration remain unknown.
Methods
In the present study, a 1H nuclear magnetic resonance-based metabonomic strategy was applied to investigate the metabolic consequences in rats following the intravenous administration of parent NPs of core–shell-structured nanoparticles, Fe3O4@SiO2-NH2 (Fe@Si) NPs.
Results
Alterations reflected in plasma and urinary metabonomes indicated that Fe@Si NPs induced metabolic perturbation in choline, ketone-body, and amino-acid metabolism besides the common metabolic disorders in tricarboxylic acid cycle, lipids, and glycogen metabolism often induced by the exogenous agents. Additionally, intestinal flora metabolism and the urea cycle were also influenced by Fe@Si NP exposure. Time-dependent biological effects revealed obvious metabolic regression, dose-dependent biological effects implied different biochemical mechanisms between low- and high-dose Fe@Si NPs, and size-dependent biological effects provided potential windows for size optimization.
Conclusion
Nuclear magnetic resonance-based metabonomic analysis helps in understanding the biological mechanisms of Fe@Si NPs, provides an identifiable ground for the selection of view windows, and further serves the clinical translation of Fe@Si NP-derived and -modified bioprobes or bioagents.
Introduction
In the past decade, core–shell-structured nanoparticles (NPs) have been attracting much interest, due to their promising potential in magnetic resonance imaging,Citation1 luminescence analysis and imaging,Citation2,Citation3 cell labeling,Citation4 drug delivery,Citation5 and bioseparation.Citation6 They are usually composed of a magnetically responsive core (iron oxide NPs) and a nonmagnetic shell (silica). The magnetic core provides many unique advantages, including extended surface area, ease of synthesis and modification, high magnetic superparamagnetic properties, and superior adsorption performance over bacteria or viruses.Citation7 Silica shells with high chemical inertness can not only improve the chemical stability of NPs but also act as a support for fluorescent probes to develop nontoxic, biocompatible, and recoverable fluorescence nanoprobesCitation5 in many biological applications. Moreover, the surface of silica coating is easily modified with various active groups, such as amino and thio groups, which have mostly been developed for biomedical application. These core–shell-structured NPs have been functionally modified by various specific chemical and biomedical ligands,Citation8,Citation9 such as antibodies, aptamers, bioproteins, and carbohydrates, to expand their application scope as multifunctional nanoagents or nanodrugs.
As the use of core–shell-structured NPs increases, especially in biomedical fields, their biological response and hazard identification become more and more important. Because these NPs are usually intravenously administered, a direct metabolic response or adverse effect will be induced in biological fluids and then organs or tissue. Changes in physicochemical properties of the NPs, such as core size, shell thickness, shape, and surface reactivity, will cause variations in biological responses. However, knowledge of the adverse effects and biological effects of these core–shell-structured NPs remains largely unclear. It is important to understand how these NPs interact with living systems from the moment of first contact and the onset of interactions induced by their presence.Citation10 However, the mechanisms of NP activity are usually hard to measure by conventional methods. Metabonomics provides a feasible tool to get possible mechanistic insight into nanotoxicity, which can identify biological variations induced by NPs at the metabolite level and more precisely mirror the phenotype of the living system. Therefore, metabonomics has been applied to reveal possible toxic mechanisms and biomarker identification of some NP exposure;Citation11 however, few studies have applied this method in studying the effects of core–shell-structured NP exposure. Schoonen et al clearly demonstrated that metabonomics exhibits increased sensitivity in recognizing early events of toxicity compared with histopathology and clinical chemistry.Citation12 Therefore, investigation of in vivo metabolic changes induced by NPs may provide a detailed description of corresponding bioresponses. In this study, nuclear magnetic resonance (NMR)-based metabonomic strategy coupled with pattern recognition was applied to evaluate the possible molecular events of core–shell-structured Fe3O4@SiO2-NH2 (Fe@Si) NPs in rats using an intravenous model.
Materials and methods
Core–shell-structured Fe3O4@SiO2-NH2 nanoparticles
Amino-functionalized core–shell-structured magnetic Fe3O4@SiO2-NH2 (Fe@Si) NPs were synthesized and characterized by a sol–gel method from hydrophilic Fe3O4 NPs and decoration with amino groups by reaction with 3-aminopropyltriethoxysilane according to de la Rosa-Romo et alCitation3 with minor modification. NPs of three sizes were composed of an iron oxide core with an amino-modified silica shell. The diameter of iron oxide core varied from 2.3 to 4.0 nm, and the corresponding amino-functionalized NPs were approximately 10, 20, and 40 nm. Transmission electron microscopy was used for the characterization of the synthesized Fe@Si NPs, and the corresponding images of Fe@Si NPs of different diameters are shown in Figure S1. NPs were freshly dispersed by ultrasound in saline solution before use.
Animal handling and sample collection
This experimental protocol was in accordance with the principles of the National Institutes of Health Guide for the Care and Use of Laboratory Animals and approved by the ethical and research committee of Xiamen University (SYXK 2013-0006). Experiments were performed at the specific pathogen free (SPF) laboratory of Xiamen University Laboratory Animal Center. A total of 65 male Sprague Dawley rats (8 weeks old, weighing 258±10 g) were obtained from the SPF laboratory. The experimental environment was set at a regulated temperature (21°C–26°C) with 45%–70% humidity and a 12/12-hour light/dark cycle. Rats were allowed free access to food and tap water. These 65 rats were randomly assigned to five groups (n=13 each group) after a 2-week acclimatization for Fe@Si NP intravenous administration: control group, low-dose 10 nm Fe@Si NP-exposure group (10L), low-dose 20 nm Fe@Si NP-exposure group (20L), high-dose 20 nm Fe@Si NP-exposure group (20H), and low-dose 40 nm Fe@Si NP-exposure group (40L). Low-dose and high-dose intravenous injections were administered to rats at a dosage of 1 mg Fe/kg and 5 mg Fe/kg body weight, respectively, while the maximum injection volume was no more than 1 mL per rat. Selection of doses was determined by both imaging efficiency and clinical dose of ultrasmall superparamagnetic iron oxide.Citation13 Control group rats were administered saline only. Each rat was housed individually in a metabolic cage to separate urine from fecal material.
Urine samples were collected at 6, 24, and 48 hours postdose in plastic tubes (5 mL) containing a solution of 0.1 g/mL sodium azide (20 μL) and embedded in an ice bath for 2 hours. After a 12-hour fast, five rats from each group were killed for whole blood under isopentane anesthesia at 6 hours postdose, and the remaining rats killed at 48 hours postdose. Whole blood for NMR spectroscopic analysis was withdrawn into a heparinized tube and immediately stored on ice prior to being centrifuged at 3,000 g for 10 minutes. Plasma was then carefully removed, while cells and buffy coat were discarded. The plasma and urine samples obtained were snap-frozen in liquid nitrogen and stored at −80°C until further analyses.
Sample preparation and 1HNMRspectroscopic analysis
Urine samples (500 μL) were mixed with 50 μL 1.5 M of deuterated phosphate buffer (NaH2PO4 and K2HPO4, including 0.1% sodium 3-[trimethylsilyl]propionate-2,2,3,3-d4 [TSP] pH 7.47). The urine–buffer mixture was centrifuged at 10,000 g at 4°C for 10 minutes, and the supernatant (500 μL) of urine was then transferred into a 5 mm NMR tube for NMR analysis. Plasma samples were prepared by mixing 200 μL plasma with 400 μL 60 mM deuterated phosphate buffer (pH 7.4) in 0.9% saline solution. After centrifugation at 10,000 g at 4°C for 10 minutes, 500 μL plasma–buffer mixture was transferred into a 5 mm NMR tube for NMR analysis.
Urine or plasma samples were randomly analyzed using 1H NMR spectroscopy. All spectra were recorded at 298 K using a Varian spectrometer operating at 499.74 MHz. 1H NMR spectra of plasma samples were acquired using a water-suppressed Carr–Purcell–Meiboom–Gill spin-echo pulse sequence (relaxation dispersion–90°–[τ–180°–τ]n–acquisition). Carr–Purcell–Meiboom–Gill spin-echo spectra were measured using spin-echo loop time (2nτ) of 70 ms with a relaxation delay of 1 second. Urine samples were acquired using the standard NOESYPR1D pulse sequence (relaxation dispersion–90°–t1–90°–tm–90°–acquisition), and water suppression was achieved with selective irradiation on water resonance during a relaxation delay of 1.4 seconds and the mixing time of 100 ms. For each sample, 64 free-induction decays were collected in 20,000 (for plasma samples) or 26,000 (for urine samples) data points over a spectral width of 10,000 Hz with an acquisition time of 2 seconds (for plasma samples) or 2.6 s (for urine samples).
NMR spectral processing and statistical analysis
All data sets were zero-filled to 64,000 points and processed with 1 Hz exponential line broadening before Fourier transformation. The acquired NMR spectra were phased and baseline-corrected manually using MestReNova (version 9.0; Mestrelab Research, Santiago de Compostela, Spain), and then calibrated to TSP at δ0 for urine samples and internal lactate CH3 resonance at δ1.33 for plasma samples. Metabolites in 1H NMR spectra were identified by comparison with previous researchCitation14 and confirmed with the Human Metabolome Database (http://www.hmdb.ca). Each 1H NMR spectrum was segmented into regions of 0.005 ppm (urine samples) or 0.002 ppm (plasma samples). Segments of δ5.20–δ4.28 in plasma spectra (δ8.50–δ0.50) and δ6.00–δ5.50 and δ5.35–δ4.34 in urine spectra (δ10.0–δ0.50) were removed to exclude the urea signal and the uncertainty of the residual water signal. Integrated data were then normalized to the total sum of the spectrum, which made the data sets directly comparable with each other.
All univariate statistical tests were two-sided, and significance was set at P<0.05. Multivariate statistical analysis can take internal relationships and mutual influence among variables into account; therefore, the use of such was more reasonable than univariate statistical analysis with respect to the data source. The processed NMR data sets were analyzed by employing principal-component analysis (PCA), partial least squares discriminant analysis (PLS-DA) and orthogonal projection to latent structures with DA (OPLS-DA) via SIMCA 14.0 (Sartorius Stedim Biotech, Malmö, Sweden) to understand metabolic changes in Fe@Si NP exposure. PCA reduced the complexity of the metabonomic data matrix without additional information and provided visual performance of the original cluster for each sample group. In contrast, OPLS-DA linked the classified information and NMR data set to determine variance among the groups. Loading volcano plots of OPLS-DA with Pareto scaling were employed to identify possible significant metabolite variations between pair-comparison groups. Relative concentrations of metabolites were also compared and statistically analyzed with analysis of variance for more reliable screening of characteristic metabolites. The volcano coefficient plots were generated using MatLab (version 9.0; MathWorks, Natick, MA, USA) with a program developed in house, where a hot color (eg, red) corresponds to metabolites with significance in discriminating between groups, while a cool color (eg, blue) means no significance.
Validity of the model was tested using cross-validation, and the cross-validation parameters R2 and Q2 were calculated to evaluate the robustness and predictability of the OPLS-DA models. An additional validation using a permutation test (permutation number 200) was also conducted to evaluate the validity of the OPLS-DA models. The R2 in the permuted plot describes how well the data fitted the derived model, whereas Q2 describes the predictive ability of the derived model and provides a measure of model quality. If the maximum value of Q2 from the permutation test was ≤Q2 of the real model, the model was regarded as predictable. Similarly, the R2 value and the difference between R2 and Q2 were used to evaluate the possibility of overfitted models.
Identification of discriminatory metabolites and metabolic network analysis
A triple standard was used to identify discriminatory metabolites between pair-comparison groups: correlation coefficients and variable importance in projection (VIP) values derived from OPLS-DA and P-values via univariate statistical analysis. Thresholds of correlation coefficients, VIP values, and P-values for the univariate statistical analysis were set as r>0.75 (for plasma) or 0.70 (for urine) (based on P=0.05), at the top 10% of all VIP scores, and P<0.05, respectively. When at least two of the three standards were met, the corresponding metabolites were identified and selected as the discriminatory ones. Based on the discriminatory metabolites, the integrated metabolic networks were able to be derived via Kyoto Encyclopedia of Genes and Genomes (KEGG) to reveal the disturbed metabolic pathways of Fe@Si NPs.
Results and discussion
Plasma and urine are two of the most common diagnostic biofluids used as study objects of metabolic and pathologic mechanisms. Plasma contains almost all the low-weight molecules, such as glucose, amino acids, and organic acids, and a few high-weight compounds, such as fatty acids and proteins, in whole blood. Due to the characteristics of high reproducibility of plasma under similar physiological conditions, its variations in metabolite concentrations could be the reflection of metabolic and disease states. As the by-products of metabolism through a process of filtration, reabsorption, and tubular secretion, urine can offer significant biological information for organism metabolism after a series of biochemical processes in the body.
1H NMR spectral analysis of biological fluids
demonstrates some typical 1H NMR spectra of plasma and urine obtained from the rats at 6 hours postexposure with different doses and sizes of Fe@Si NPs. These NMR spectra of biological fluids provided metabolic information for the animals, eg, end products of glycolysis, such as lactate and acetate, and intermediates of the tricarboxylic acid (TCA) cycle, such as succinate, citrate, and α-ketoglutarate, were displayed in the NMR spectra of plasma and urine, and amino acids, such as leucine, alanine, glycine, and valine, were detected in plasma, while some organic acids, such as fumarate, methylmalonate, and phenylacetylglycine, and some waste metabolites, such as formate, hippurate, allantoin, and urea, were detected in urine.
Figure 1 Representative 1H nuclear magnetic resonance spectra of rat plasma (A) and urine (B) obtained from groups C6, 10L6, 20L6, 20H6 and 40L6.
Notes: C, L, and H represent the control and low- and high-dose groups, respectively, 6 represents 6 hours posttreatment, and 10, 20, and 40 represent Fe@Si NPs of 10, 20 and 40 nm, respectively. The spectral regions in the dashed boxes were magnified 20 times (for plasma) and five times (for urine) for the purpose of clarity.
Abbreviations: Fe@Si, Fe3O4@SiO2-NH2; NPs, nanoparticles; AB, aminobutyrate; AA, acetoacetate; Ab, anabasine; Ace, acetate; Ach, acetylcholine; Aco, aconitate; Act, acetone; AD, acetamide; AH, aminohippurate; Ala, alanine; All, allantoin; Arg, arginine; Asn, asparagine; Ben, benzoate; Bet, betaine; Bu, butyrate; Ch, choline; Ci, citrate; Cn, creatinine; Cr, creatine; DG, deoxyguanosine; DMA, dimethylamine; DMG, dimethylglycine; DU, deoxyuridine; EA, ethanolamine; Eth, ethanol; For, formate; Fum, fumarate; G, glycerol; GA, guanidinoacetate; Glc, glucose; Gln, glutamine; Glu, glutamate; Gly, glycine; GPC, glycerolphosphocholine; HB, hydroxybutyrate; HG, homogentisate; HIB, hydroxyisobutyrate; Hip, hippurate; HIV, hydroxyisovalerate; IB, isobutyrate; Ile, isoleucine; IP, isopropanol; IV, isovalerate; KG, ketoglutarate; KIV, ketoisovalerate; L, lipid; Lac, lactate; LDL, low-density lipoprotein; Leu, leucine; Lys, lysine; MA, methylamine; Mal, malonate; MG, methylguanidine; MH, methylhistidine; m-HPA, meta-hydroxyphenylacetate; m-I, myo-inositol; Met, methionine; MM, methylmalonate; Mol, methanol; NA, nicotinamide; NAD, nicotinamide adenine dinucleotide; NAG, N-acetylglutamate; NAS, N-acetyl glycoprotein signal; N-MH, N-methylnicotinamide; NP, neopterin; o-HPA, ortho-hydroxyphenylacetate; PA, picolinate; PAG, phenylacetylglycine; Pan, pantothenate; PAP, adenosine 3′,5′-diphosphate; PC, phosphocholine; Phe, phenylalanine; p-HPA, para-hydroxyphenylacetate; Prop, propionate; Py, pyruvate; Ser, serine; Suc, succinate; Aad, 2-aminoadipate; Tau, taurine; TGL, trigonelline; Thr, threonine; TMAO, trimethylamine N-oxide; Trp, tryptophan; Tyr, tyrosine; UC, urocanate; Val, valine; VLDL, very-low-density lipoprotein.
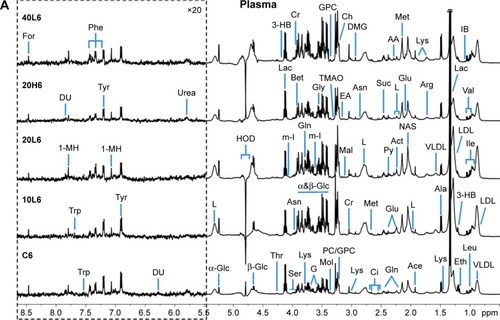

The height of NMR peaks represents the concentration of different metabolites; therefore, we were able roughly to observe the variability in metabolites between Fe@Si NP-treated groups and the controls. However, no more detailed information could be obtained via visual comparison only, due to the large sample and the complexity of metabolite composition. Therefore, multivariate statistical analysis was applied to analyze and identify precisely the biological effects of Fe@Si NPs.
Metabonomic responses of plasma following Fe@Si NP administration
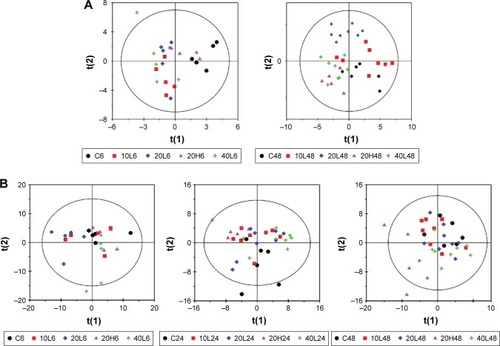
Blood provided the functionalizing medium of Fe@Si NPs, and its metabonomic variations were closely related to the transport and absorption of Fe@Si NPs. PCA was performed on NMR data of plasma to get overall metabolic trends in response to Fe@Si NP administration and identify possible outliers in plasma metabonomes. Plasma metabonomes displayed a trend of separation between control groups and Fe@Si NP-treated groups at both 6 and 48 hours postdose, though there was some overlap (data not shown), and PLS-DA highlighted these distinctions (). After 6 hours’ Fe@Si NP exposure, a certain distinction between dosed groups and control group could be observed, while low-dose groups overlapped with one another (), implying that obvious biological effects were induced in plasma metabonomes following Fe@Si NP administration, but no obvious size effects presented in a shorter time. After 48 hours’ Fe@Si NP exposure, 10L and 40L groups showed metabolic regression to some extent, though not complete, while significant distinction between controls and the 20L group could still be observed (), which may reflect the longer half-life of 20 nm Fe@Si NPs than other sizes. It is obvious that the metabonomic responses of Fe@Si NPs resulted from their transport and distribution in the body, and thus it is possible to provide a favorable viewing window in multimodal imaging by optimizing the size of Fe@Si NPs. Unexpectedly, high-dose Fe@Si NPs did not induce obvious metabolic variations during the entire observation period (), which may imply different metabolic mechanisms of Fe@Si NPs between high and low doses.
Figure 2 Partial least squares-discriminant analysis plots based on 1H nuclear magnetic resonance data.
Notes: (A) Plasma and (B) urine samples obtained from different groups. C, L, and H represent the control and low- and high-dose groups, respectively, 6, 24, and 48 represent 6, 24, and 48 hours posttreatment, respectively, and 10, 20, and 40 represent Fe@Si NPs of 10, 20, and 40 nm, respectively.
Abbreviations: Fe@Si, Fe3O4@SiO2-NH2; NPs, nanoparticles.
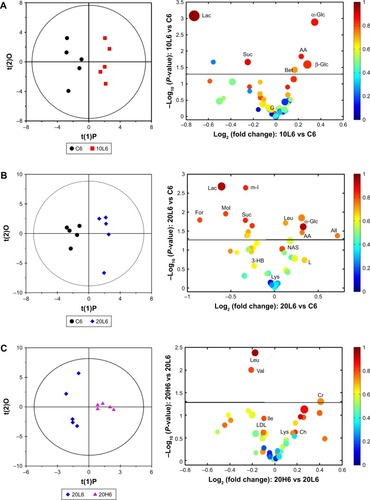
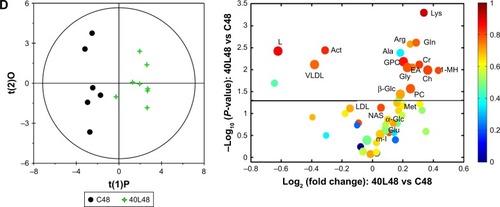
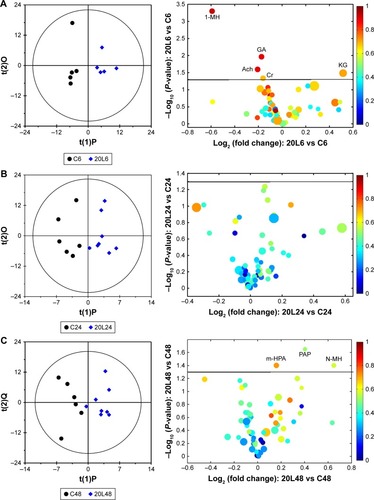
To get an insight into the detailed metabolic responses to Fe@Si NP exposure in serum metabonomes, OPLS-DA was performed on pairwise NMR data obtained from different groups. Pair comparisons of the 10L, 20L, and 40L groups and corresponding controls were selected in order to gauge the size effects of Fe@Si NPs. It was easy to find that changes in metabolites varied in different groups, in which 20 nm Fe@Si NPs induced more obvious metabolic effects than 10 or 40 nm Fe@Si NP ( and S2A). Generally speaking, administration of Fe@Si NPs led to the elevation of 3-hydroxybutyrate (3-HB), acetoacetate, allantoin, betaine, glucose, leucine, lipid, N-acetyl glycoprotein, and very-low-density lipoprotein (VLDL) accompanied by level decreases in citrate, deoxyuridine, formate, glycerol, lactate, lysine, methanol, myo-inositol, succinate, and tyrosine 6 hours postdose (Table S1). It was notable that decreased lactate and increased acetoacetate were observed among all Fe@Si NP-treated groups. At 48 hours postdose, Fe@Si NPs generally led to increased levels of 1-methylhistidine, acetate, alanine, allantoin, arginine, choline, creatine, ethanolamine, glucose, glutamate, glutamine, glycerolphosphocholine, glycine, lysine, methionine, myo-inositol, N-acetyl glycoprotein, phosphocholine, and serine and decreased levels of acetone, citrate, lactate, lipid, pyruvate, and VLDL (Table S1). According to the volcano plots ( and S2) and detailed metabolic information (Table S1), a size effect was demonstrated in the plasma metabonomes, where 40 nm Fe@Si NPs () induced more significant metabolic responses than 10 or 20 nm Fe@ Si NPs (Figure S2B and C).
Figure 3 OPLS-DA scores and corresponding volcano plots from the plasma.
Notes: Orthogonal projection to latent structures with discriminant analysis (left panels) and corresponding volcano plots (right panels) derived from 1H nuclear magnetic resonance data of the plasma obtained from the different pairwise groups: C6-10L6 (A), C6-20L6 (B), 20L6-20H6 (C), and C48-40L48 (D). C, L, and H represent the control and low- and high-dose groups, respectively, 6 and 48 represent 6 and 48 hours posttreatment, respectively, and 10, 20, and 40 represent Fe@Si NPs of 10, 20 and 40 nm, respectively. Marked circles in color volcano plots represent metabolites with statistically significant differences.
Abbreviations: OPLS-DA, orthogonal projection to latent structures with discriminant analysis; Fe@Si, Fe3O4@SiO2-NH2; NPs, nanoparticles; AA, acetoacetate; Act, acetone; Ala, alanine; All, allantoin; Arg, arginine; Bet, betaine; Ch, choline; Cr, creatine; EA, ethanolamine; For, formate; G, glycerol; Glc, glucose; Gln, glutamine; Glu, glutamate; Gly, glycine; GPC, glycerolphosphocholine; HB, hydroxybutyrate; Ile, isoleucine; L, lipid; Lac, lactate; LDL, low-density lipoprotein; Leu, leucine; Lys, lysine; MH, methylhistidine; m-I, myo-inositol; Met, methionine; Mol, methanol; NAS, N-acetyl glycoprotein signal; PC, phosphocholine; Suc, succinate; Val, valine; VLDL, very-low-density lipoprotein.
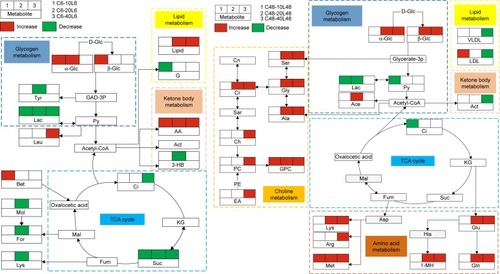
Based on the characteristic metabolites induced by Fe@Si NPs, an integrated metabolic reaction pathway was derived via KEGG. As depicted in the metabolic network (), sequential chemical reactions and conversions of substrates and products reflected the abnormal anabolic and catabolic processes induced by Fe@Si NPs. In our study, Fe@Si NPs primarily caused disturbances in glycogen metabolism, TCA cycle, lipid metabolism, and ketone-body metabolism, and the abnormal choline metabolism and amino acid metabolism were also subsequently involved at 48 hours postdose ().
Figure 4 Metabolic networks induced by Fe@Si NPs in rat plasma at 6 hours (left panel) and 48 hours (right panel) postdose.
Notes: C and L represent the control and low-dose groups, respectively. Decreased and increased levels and no significant change in characteristic metabolites against corresponding controls are represented by green, red, and blank boxes, respectively. Different background colors for pathways indicate different biochemical pathways.
Abbreviations: Fe@Si, Fe3O4@SiO2-NH2; NPs, nanoparticles; AB, aminobutyrate; AA, acetoacetate; Ab, anabasine; Ace, acetate; Ach, acetylcholine; Aco, aconitate; Act, acetone; AD, acetamide; AH, aminohippurate; Ala, alanine; All, allantoin; Arg, arginine; Asn, asparagine; Ben, benzoate; Bet, betaine; Bu, butyrate; Ch, choline; Ci, citrate; Cn, creatinine; Cr, creatine; DG, deoxyguanosine; DMA, dimethylamine; DMG, dimethylglycine; DU, deoxyuridine; EA, ethanolamine; Eth, ethanol; For, formate; Fum, fumarate; G, glycerol; GA, guanidinoacetate; Glc, glucose; Gln, glutamine; Glu, glutamate; Gly, glycine; GPC, glycerolphosphocholine; HB, hydroxybutyrate; HG, homogentisate; HIB, hydroxyisobutyrate; Hip, hippurate; HIV, hydroxyisovalerate; IB, isobutyrate; Ile, isoleucine; IP, isopropanol; IV, isovalerate; KG, ketoglutarate; KIV, ketoisovalerate; L, lipid; Lac, lactate; LDL, low-density lipoprotein; Leu, leucine; Lys, lysine; MA, methylamine; Mal, malonate; MG, methylguanidine; MH, methylhistidine; m-HPA, meta-hydroxyphenylacetate; m-I, myo-inositol; Met, methionine; MM, methylmalonate; Mol, methanol; NA, nicotinamide; NAD, nicotinamide adenine dinucleotide; NAG, N-acetylglutamate; NAS, N-acetyl glycoprotein signal; N-MH, N-methylnicotinamide; NP, neopterin; o-HPA, ortho-hydroxyphenylacetate; PA, picolinate; PAG, phenylacetylglycine; Pan, pantothenate; PAP, adenosine 3′,5′-diphosphate; PC, phosphocholine; Phe, phenylalanine; p-HPA, para-hydroxyphenylacetate; Prop, propionate; Py, pyruvate; Ser, serine; Suc, succinate; Tau, taurine; TGL, trigonelline; Thr, threonine; TMAO, trimethylamine N-oxide; Trp, tryptophan; Tyr, tyrosine; UC, urocanate; Val, valine; VLDL, very-low-density lipoprotein.
Glycogen metabolism
Glycogen functions as both a reserve of energy and a structural building block in organisms from bacteria to humans, participating a variety of activities in cells. High levels of glucose indicate mitochondrial dysfunction, which probably result in alternative pathways. Lactate is the intermediate product produced during the anaerobic metabolism of glucose in the body, and lower levels of lactate indicate that the activity of mitochondrial enzymes was weakened in plasma by the existence of Fe@Si NPs, which conforms to the mechanism of responses to nanomaterial exposure.Citation15
TCA cycle
As the key metabolic pathway that connects carbohydrate, fat, and protein metabolism, the changes in the TCA cycle suggested disturbed metabolic pathways of three major nutrients. An altered TCA cycle is a common proinflammatory metabolic response in NP exposure.Citation16 Citrate and succinate are important excretions of TCA intermediates, and especially succinate is the most effective substrate following oxygen consumption.Citation15 Therefore, their decreased levels can possibly be attributed to the proinflammatory stimulation of Fe@Si NPs, which was confirmed by increased inflammatory cells and focal hepatic inflammation in the liver of Fe@Si NP-treated rats (Figure S3).
Lipid metabolism
Lipid metabolism is the breakdown or storage of fats for energy; these fats are obtained from consuming food, and they are synthesized in an animal’s liver. Low-density lipoprotein (LDL) is the lipoprotein particle that can help transport to body cells, and VLDL is the main road for transporting triglycerides and unsaturated fats, and their abnormal levels implied disturbance in energy metabolism and disorder in breaking down or synthesizing fats. In silver NP-induced hepatic damage, dosed mice have been found to switch from glycogenolysis and lipid storage at 6 hours posttreatment to glycogenesis and lipolysis at 48 hours posttreatment,Citation17 and the metabolic responses in glycogen metabolism and lipid metabolism in our study revealed a similar hepatic disturbance of Fe@Si NPs with silver NPs.
Ketone-body metabolism
Under normal physiological conditions, ketone bodies are the only energy vectors from the liver to the brain when glucose supply is low.Citation18 As we all know, acetyl-CoA derived from glycolysis and lipid β-oxidation will produce ketone bodies – acetoacetate, acetone, and 3-HB – that exceed the capacity of the Krebs cycle. Ketone bodies can usually also be reconverted to acetyl-CoA to produce energy when transported from liver to other tissues. Therefore, changes in 3-hydroxybutyrate, acetone, and acetoacetate can confer a general energy-metabolism decrease in the TCA cycle. On the other hand, leucine can also be broken down to yield acetoacetate, and thus the elevation of acetoacetate levels in our study may have contributed to the maintenance of pH-buffering capacity and caused enzymatic metabolic disorders.Citation19
Choline metabolism
Abnormal choline metabolism is emerging as a metabolic hallmark that is associated with oncogenesis and tumor progression. Following transformation, the modulation of enzymes that control anabolic and catabolic pathways causes increased levels of choline-containing precursors and breakdown products of membrane phospholipids.Citation20 Creatine is manufactured in the liver and kidneys and transported in blood to muscles, and creatine is the material that keeps all our cells supplied with energy through a very effective mechanism. An increase in plasma creatine can be related to the dysfunction or lack of reabsorption of creatine.
It is known that phosphocholine and choline are breakdown products of phosphatidylcholine, which is a major membrane constituent. The increased levels of choline, phosphocholine, and glycerolphosphocholine together with the drop in plasma lipids and lipoproteins at 48 hours postdose implied a disruption in membrane fluidity caused by Fe@Si NPs.Citation21 A previous study also showed enhanced membrane permeability and loss of membrane integrity due to NP exposure.Citation22 Ethanolamine is the second-most abundant head group for phospholipids, substances found in biological membranes. The higher concentrations level of ethanolamine found in the 40L groups at 48 hours postdose can also be related to destruction of the cell membrane.
Amino-acid metabolism
Metabolism of amino acids hydrolyzed by protein includes two aspects: on the one hand, amino acids are used to synthesize the body’s own unique proteins, peptides, and other nitrogenous substances; on the other hand, they can be decomposed into α-keto acids, amines, and carbon dioxide by deamination, transamination, combined deamination or decarboxylation. The elevation of amino acids in plasma may mean that Fe@Si NPs impaired enzymes related to the catabolism of amino acids and there existed obstacles for reabsorbing such amino acids, and hence aminoaciduria possibly occurred.
Significantly elevated levels of amino acids were also likely due to stress hormones produced by Fe@Si NP exposure.Citation23 Serine helps to produce immunoglobulins and antibodies for a strong immune system, and also aids in the absorption of creatine. The increased serine and glycine levels in plasma were indicative of the disturbance of the immune system induced by Fe@Si NP exposure. 1-Methylhistidine is a major metabolite related to anti-inflammatory factors that differentially affect the functions of activated macrophages, and the higher 1-methylhistidine concentration was a response to the proinflammatory effect caused by Fe@Si NPs. Methionine is the only essential amino acid containing sulfur and is also a very important antioxidant.
Metabonomic responses in urine following Fe@Si NP administration
As the end product from excretory systems, metabonomic variations in urine provide detailed biological information on the secretion and metabolic responses of Fe@Si NPs. According to the PLS-DA plots (), no obvious metabolic difference was observed in any of the dosed groups except group 20L6 compared with the control group at 6 hours postdose, but almost all the dosed groups except 20L24 demonstrated significant differences compared with the control group at 24 hours postdose, and only 20H48 demonstrated remarkable metabolic differences compared with the control group. Further, OPLS-DA on pairwise NMR data also confirmed the detailed excretory information from urinary metabonomes ( and S4 and Table S2).
Figure 5 OPLS-DA scores and corresponding volcano plots from the urine.
Notes: Orthogonal projection to latent structures with discriminant analysis (left panels) and corresponding volcano plots (right panels) derived from 1H nuclear magnetic resonance data of urine obtained from pairwise groups: C6-20L6 (A), C24-20L24 (B), C48-20L48 (C) and 20L6-20H6 (D). C, L, and H represent the control and low- and high-dose groups, respectively, 6, 24, and 48 represent 6, 24, and 48 hours posttreatment, respectively, 20 represents Fe@Si NPs of 20 nm. Marked circles in color volcano plots represent metabolites with statistically significant differences.
Abbreviations: OPLS-DA, orthogonal projection to latent structures with discriminant analysis; Fe@Si, Fe3O4@SiO2-NH2; NPs, nanoparticles; AB, aminobutyrate; AA, acetoacetate; Ab, anabasine; Ace, acetate; Ach, acetylcholine; Aco, aconitate; Act, acetone; AD, acetamide; AH, aminohippurate; Ala, alanine; All, allantoin; Arg, arginine; Asn, asparagine; Ben, benzoate; Bet, betaine; Bu, butyrate; Ch, choline; Ci, citrate; Cn, creatinine; Cr, creatine; DG, deoxyguanosine; DMA, dimethylamine; DMG, dimethylglycine; DU, deoxyuridine; EA, ethanolamine; Eth, ethanol; For, formate; Fum, fumarate; G, glycerol; GA, guanidinoacetate; Glc, glucose; Gln, glutamine; Glu, glutamate; Gly, glycine; GPC, glycerolphosphocholine; HB, hydroxybutyrate; HG, homogentisate; HIB, hydroxyisobutyrate; Hip, hippurate; HIV, hydroxyisovalerate; IB, isobutyrate; Ile, isoleucine; IP, isopropanol; IV, isovalerate; KG, ketoglutarate; KIV, ketoisovalerate; L, lipid; Lac, lactate; LDL, low-density lipoprotein; Leu, leucine; Lys, lysine; MA, methylamine; Mal, malonate; MG, methylguanidine; MH, methylhistidine; m-HPA, meta-hydroxyphenylacetate; m-I, myo-inositol; Met, methionine; MM, methylmalonate; Mol, methanol; NA, nicotinamide; NAD, nicotinamide adenine dinucleotide; NAG, N-acetylglutamate; NAS, N-acetyl glycoprotein signal; N-MH, N-methylnicotinamide; NP, neopterin; o-HPA, ortho-hydroxyphenylacetate; PA, picolinate; PAG, phenylacetylglycine; Pan, pantothenate; PAP, adenosine 3′,5′-diphosphate; PC, phosphocholine; Phe, phenylalanine; p-HPA, para-hydroxyphenylacetate; Prop, propionate; Py, pyruvate; Ser, serine; Suc, succinate; Tau, taurine; TGL, trigonelline; Thr, threonine; TMAO, trimethylamine N-oxide; Trp, tryptophan; Tyr, tyrosine; UC, urocanate; Val, valine; VLDL, very-low-density lipoprotein.
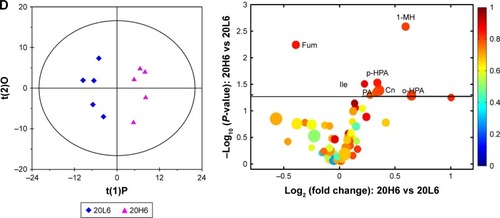
The 10L, 20L, and 40L groups were selected to understand the size effect of Fe@Si NPs; however, the OPLS-DA results showed that 20 nm Fe@Si NPs induced more obvious excretory responses. At 6 hours postdose, administration of 20 nm Fe@Si NPs led to elevations in citrate, hippurate, and α-ketoglutarate accompanied by level decreases in 1-methylhistidine, 2-HB, acetylcholine, alanine, creatine, creatinine, ethanolamine, guanidinoacetate, lactate, N-acetylglutamate (NAG), and phenylacetylglycine (PAG) ( and Table S2), while only increased methylamine level was observed in the 10L6 group (Figure S4A), and only increased levels of citrate and propionate and decreased levels of betaine, creatine, NAG, and PAG were observed in the 40L6 group (Figure S4B). As for 24 hours postdose, few metabolites had changed, including increased concentrations of alanine, hippurate, and NAG and decreased concentrations of betaine, citrate, creatinine, methylamine, and PAG compared with controls (Table S2B). Also, only elevation in 3-hydorxyisovalerate, hippurate, meta- and ortho-hydroxyphenylacetate, methylmalonate, and PAG was observed in the Fe@Si NP-exposure groups at 48 hours postdose (Table S2).
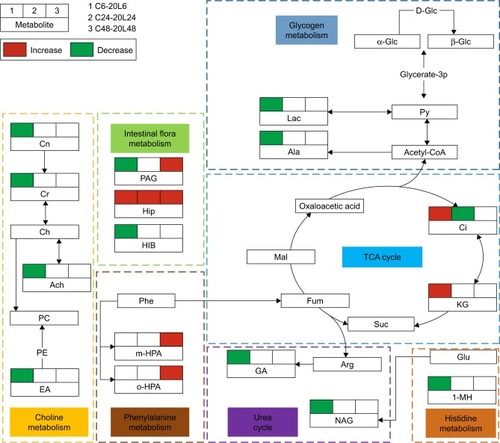
In order to understand the excretory fate of Fe@Si NPs and their secretory responses, the metabolic networks involved in rat urinary metabonomes following low-dose 20 nm Fe@Si NP exposure were derived via KEGG based on characteristic metabolites against corresponding controls (). The disturbed metabolic processes were involved in the TCA cycle, glycogen metabolism, urea cycle, intestinal flora metabolism, choline metabolism, and phenylalanine and histidine metabolism.
Figure 6 Metabolic networks involved in rat urinary metabonomes following low-dose 20 nm Fe@Si NP exposure.
Notes: C and L represent the control and low-dose groups, respectively. Decreased and increased levels and no significant change in characteristic metabolites against the corresponding controls are represented by green, red, and blank boxes, respectively. Different background colors for pathways indicate different biochemical pathways.
Abbreviations: Fe@Si, Fe3O4@SiO2-NH2; NP, nanoparticle; AB, aminobutyrate; AA, acetoacetate; Ab, anabasine; Ace, acetate; Ach, acetylcholine; Aco, aconitate; Act, acetone; AD, acetamide; AH, aminohippurate; Ala, alanine; All, allantoin; Arg, arginine; Asn, asparagine; Ben, benzoate; Bet, betaine; Bu, butyrate; Ch, choline; Ci, citrate; Cn, creatinine; Cr, creatine; DG, deoxyguanosine; DMA, dimethylamine; DMG, dimethylglycine; DU, deoxyuridine; EA, ethanolamine; Eth, ethanol; For, formate; Fum, fumarate; G, glycerol; GA, guanidinoacetate; Glc, glucose; Gln, glutamine; Glu, glutamate; Gly, glycine; GPC, glycerolphosphocholine; HB, hydroxybutyrate; HG, homogentisate; HIB, hydroxyisobutyrate; Hip, hippurate; HIV, hydroxyisovalerate; IB, isobutyrate; Ile, isoleucine; IP, isopropanol; IV, isovalerate; KG, ketoglutarate; KIV, ketoisovalerate; L, lipid; Lac, lactate; LDL, low-density lipoprotein; Leu, leucine; Lys, lysine; MA, methylamine; Mal, malonate; MG, methylguanidine; MH, methylhistidine; m-HPA, meta-hydroxyphenylacetate; m-I, myo-inositol; Met, methionine; MM, methylmalonate; Mol, methanol; NA, nicotinamide; NAD, nicotinamide adenine dinucleotide; NAG, N-acetylglutamate; NAS, N-acetyl glycoprotein signal; N-MH, N-methylnicotinamide; NP, neopterin; o-HPA, ortho-hydroxyphenylacetate; PA, picolinate; PAG, phenylacetylglycine; Pan, pantothenate; PAP, adenosine 3′,5′-diphosphate; PC, phosphocholine; Phe, phenylalanine; p-HPA, para-HPA; Prop, propionate; Py, pyruvate; Ser, serine; Suc, succinate; Tau, taurine; TGL, trigonelline; Thr, threonine; TMAO, trimethylamine N-oxide; Trp, tryptophan; Tyr, tyrosine; UC, urocanate; Val, valine; VLDL, very-low-density lipoprotein.
TCA cycle and glycogen metabolism
The altered TCA cycle and glycogen metabolism induced by Fe@Si NPs were also shown in urinary metabonomes. The urinary excretion of citrate is independent of plasma citrate concentration, but decreases during renal tubular acidosis. Changed citrate and α-ketoglutarate levels were observed in the 6-hour and 24-hour postdose groups, but there was no significant metabolic effect on TCA intermediates following the administration of Fe@Si NPs at 48 hours postdose, reflecting recovery to some extent.
Urea cycle
The urea cycle, primarily in the liver and to a lesser extent the kidney, converts highly toxic ammonia to urea for excretion. It is dependent on and regulated by the presence of NAG. Decreased NAG will influence the biochemical process of producing urea from ammonia, thus leading to accumulation of ammonia in blood. As a product of the urea cycle, guanidinoacetate is mainly formed in the kidneys from such amino acids as arginine and glycine. Its decrease also implies urea-cycle disorders.
Intestinal flora metabolism
Hippurate is a normal component of urine and typically related to intestinal flora metabolism. PAG is one of the acylglycines, which are normally minor metabolites of fatty acids. In one study, increased levels of urinary PAG associated with mitochondrial toxicity in a model of drug-induced phospholipidosis and PAG:hippuric acid ratio in urine and plasma were regarded as potential markers of phospholipidosis.Citation24 Urinary PAG and hippurate show increased levels after Fe@Si NP treatment, while precursors of PAG and hippurate are produced by gut bacteria. It has been reported that urinary levels of hippurate and PAG alter when animals are exposed to drugs or foods that possess antimicrobial activity.Citation25 As a short-chain fatty acid, 2-hydroxyisobutyrate is thought to be related to the activity of gut microorganisms. Therefore, a change in these metabolites may be indicative of a drug effect on gut microflora or drug-induced toxicity.Citation26
Choline metabolism
Creatinine is a chemical waste product in the blood that passes through the kidneys to be filtered and eliminated in urine, and the decreased levels of creatinine reflected the impact on kidney function after Fe@Si NP exposure. Increased levels of creatine in plasma and decreased urinary creatine and creatinine also supported the notion that Fe@Si NPs affected the energy metabolism and oxidative stress.
Phenylalanine and histidine metabolism
In urinary concentration, more diverse changes in amino acids were found. Amino acids are closely related to critical biological functions, including protein synthesis and glycogenesis. The alterations in 1-methylhistidine and meta- and ortho-hydroxyphenylacetate might have been an indication of increased antioxidant activities.
Difference in biological effects of Fe@Si NPs at high- and low-dose exposure
As demonstrated (), no expected dose response was observed during the experiment. The high-dose Fe@Si NPs took biological action on rats with slow effect initiation but prolonged duration compared with the low dose, which may have resulted in the increased abnormal toxicity. In consideration of differences in dosage, we think the differences in toxicological mechanisms caused the distinction in metabolic responses between low- and high-dose groups.
Basically, the metabolic differences corresponding to dose responses in rat plasma were shown as increased levels of choline, lysine, and methionine and decreased levels of isoleucine, leucine, valine and LDL in the 20H6 group ( and Table S1), and increased levels of citrate, glutamate, lysine, lactate, and pyruvate and decreased levels of 3-HB, lipid, and VLDL in the 20H48 group (Figure S2D and Table S1). The urinary metabonomes demonstrated more obvious metabolic differences at 6 hours posttreatment (elevated 1-methylhistidine, acetoacetate, choline, creatine, ethanolamine, guanidinoacetate, isoleucine, lactate, methylmalonate, ortho-hydroxyphenylacetate (HPA), para-HPA, PAG, and picolinate and reduced 2-hydroxyisobutyrate, 3-HB, ethanol, fumarate, hippurate, NAG, and α-ketoglutarate in the high-dose group were observed compared with the low-dose group) than at 24 hours (only elevated benzoate, isoleucine, PAG, and picolinate and reduced ortho-HPA and succinate were observed in the high-dose group) and 48 hours (only elevated 3-HB, acetate, isoleucine, isopropanol, valine, and PAG were observed in the high-dose group) posttreatment.
According to analysis of metabolic pathways (Table S3), differences in biological mechanisms of Fe@Si NPs between high- and low-doses were primarily involved in central carbon metabolism, biosynthesis and metabolism of amino acids, carboxylic acid metabolism, and ABC transporters. It is undoubtable that the increased toxicity of the high-dose Fe@Si NPs contributed to the differences in biological effects. It is obvious that biosynthesis and metabolism of amino acids and carboxylic acid metabolism were a natural result of oxidative stress from high-dose Fe@Si NPs. In silica NP-induced potential hepatotoxicity, similar metabolic changes, such as elevated levels of lactate, creatine, and choline and the reduced levels of lipid, have also been observed in rat serum.Citation27 Central carbon metabolism has been adopted in the clinic for monitoring disease progression and therapy response, and a recent study suggests that altered metabolic behavior in the central metabolism is related to tumor recurrence and therapy resistance.Citation28 The high-dose Fe@Si NP-induced altered central carbon metabolism in our study may indicate the toxicological effects and drug resistance of high-dose Fe@Si NPs. ABC transporters can facilitate the transport of various endogenous and exogenous substances to the body, and their abnormality implied possible chemoresistanceCitation29 and limited absorption and transportationCitation30 of Fe@Si NPs.
Conclusion
In this study, time-, dose-, and size-dependent biological effects of core–shell-structured Fe@Si NPs were investigated using NMR-based metabonomic techniques in an intravenous rat model. Exposure to Fe@Si NPs not only induced metabolic disorders in the TCA cycle and lipid and glycogen metabolism often induced by common exogenous agents but also caused metabolic perturbations in choline, ketone-body, and amino-acid metabolism. Abnormal intestinal flora metabolism and urea cycle were also observed in excretory processes. The 20 nm Fe@Si NPs induced more obvious lasting biological responses than 10 or 40 nm Fe@ Si NPs, which implies that it is possible to provide a favorable viewing window in multimodal imaging by optimizing the size of Fe@Si NPs. Although no obvious time response was observed, metabolic recovery was observed from urinary metabonomes. High-dose Fe@Si NPs induced a different biological response in rats from low-dose Fe@Si NPs, which may be attributed to increased toxicity. The different metabolic mechanisms of Fe@Si NPs between high and low doses were primarily involved in central carbon metabolism and biosynthesis and metabolism of amino acids, carboxylic acid, and ABC transporters. Our results help to understand the biological mechanisms of Fe@Si NPs and provide an identifiable ground for the selection of a viewing window and size optimization, and further serve the clinical translation of Fe@Si NP-derived and -modified bioprobes or bioagents.
Acknowledgments
This work was financially supported by the National Natural Science Foundation of China (31671920 and 11675135).
Disclosure
The authors report no conflicts of interest in this work.
References
- KostivUPatsulaVSloufMPhysico-chemical characteristics, biocompatibility, and MRI applicability of novel monodisperse PEG-modified magnetic Fe3O4&SiO2 core–shell nanoparticlesRSC Adv2017787868797
- RunowskiMLisSSynthesis, surface modification/decoration of luminescent–magnetic core/shell nanomaterials, based on the lanthanide doped fluorides (Fe3O4/SiO2/NH2/PAA/LnF3)J Lumin2016141388397
- de la Rosa-RomoLMOropeza-GuzmánMTOlivas-SarabiaAPina-LuisGFlavone functionalized magnetic nanoparticles: a new fluorescent sensor for Cu2+ ions with nanomolar detection limitSens Actuators B Chem2016233459468
- LouLYuKZhangZFunctionalized magnetic-fluorescent hybrid nanoparticles for cell labellingNanoscale201132315232321503355
- JiangWWuJShenYWTianRBZhouSASynthesis and characterization of doxorubicin loaded ph-sensitive magnetic core-shell nanocomposites for targeted drug delivery applicationsNano2016111650127
- LiuFNiuFGPengNSuYJYangYJSynthesis, characterization, and application of Fe3O4@SiO2-NH2 nanoparticlesRSC Adv201551812818136
- ZhanSYangYShenZEfficient removal of pathogenic bacteria and viruses by multifunctional amine-modified magnetic nanoparticlesJ Hazard Mater201427411512324769848
- Torres-ChavollaEAlociljaECAptasensors for detection of microbial and viral pathogensBiosens Bioelectron2009243175318219117748
- ZhengMRenGLiuHGAn engineered knottin peptide labeled with 18F for PET imaging of integrin expressionBioconjugate Chemistry2009202342234719908826
- MbehDAFrançaRMerhiYIn vitro biocompatibility assessment of functionalized magnetite nanoparticles: biological and cytotoxicological effectsJ Biomed Mater Res A20121001637164622447386
- FengJLiuHBhakooKKLuLChenZA metabonomic analysis of organ specific response to USPIO administrationBiomaterials2011326558656921641028
- SchoonenWGKloksCPPloemenJPSensitivity of 1H NMR analysis of rat urine in relation to toxicometabonomics – part I: dose-dependent toxic effects of bromobenzene and paracetamolToxicol Sci20079827128517420223
- KooiMECappendijkVCCleutjensKBAccumulation of ultrasmall superparamagnetic particles of iron oxide in human atherosclerotic plaques can be detected by in vivo magnetic resonance imagingCirculation20031072453245812719280
- FengJLiuHZhangLBhakooKLuLAn insight into the metabolic responses of ultra-small superparamagnetic particles of iron oxide using metabonomic analysis of biofluidsNanotechnology20102139510120820093
- TangMZhangTXueYDose dependent in vivo metabolic characteristics of titanium dioxide nanoparticlesJ Nanosci Nanotechnol2010108575858321121368
- SaboranoRWongpinyochitTTottenJDJohnstonBFSeibFPDuarteIFMetabolic reprogramming of macrophages exposed to silk, poly(lactic-co-glycolic acid), and silica nanoparticlesAdv Healthc Mater20176201601240
- JarakICarrolaJBarrosASMetabolism modulation in different organs by silver nanoparticles: an NMR metabolomics study of a mouse modelToxicol Sci201715942243528962526
- BerryGTFukaoTMitchellGANeonatal hypoglycaemia in severe succinyl-CoA:3-oxoacid CoA-transferase deficiencyJ Inherit Metab Dis20012458759511757586
- KalaposMPOn the mammalian acetone metabolism: from chemistry to clinical implicationsBiochim Biophys Acta2003162112213912726989
- GlundeKBhujwallaZMRonenSMCholine metabolism in malignant transformationNat Rev Cancer20111183584822089420
- WeiLLiaoPWuHToxicological effects of cinnabar in rats by NMR-based metabolic profiling of urine and serumToxicol Appl Pharmacol200822741742918164359
- GogniatGThyssenMDenisMPulgarinCDukanSThe bactericidal effect of TiO2 photocatalysis involves adsorption onto catalyst and the loss of membrane integrityFEMS Microbiol Lett2006258182416630249
- ZhangLWangLHuYSelective metabolic effects of gold nanorods on normal and cancer cells and their application in anticancer drug screeningBiomaterials2013347117712623787109
- DelaneyJNevilleWASwainAMilesALeonardMSWaterfieldCJPhenylacetylglycine, a putative biomarker of phospholipidosis: its origins and relevance to phospholipid accumulation using amiodarone treated rats as a modelBiomarkers2004927129015764292
- WatersNWaterfieldCFarrantRHolmesENicholsonJKIntegrated metabonomic analysis of bromobenzene-induced hepatotoxicity: novel induction of 5-oxoprolinosisJ Proteome Res200651448145916739996
- NichollsAWMortishire-SmithRJNicholsonJKNMR spectroscopic-based metabonomic studies of urinary metabolite variation in acclimatizing germ-free ratsChem Res Toxicol2003161395140414615964
- LuXYTianYZhaoQQJinTTXiaoSFanXHIntegrated metabonomics analysis of the size-response relationship of silica nanoparticles-induced toxicity in miceNanotechnology20112205510121178262
- WongTLCheNMaSReprogramming of central carbon metabolism in cancer stem cellsBiochim Biophys Acta201718631728173828502706
- SantistebanMABC transporters as molecular effectors of pancreatic oncogenic pathways: the Hedgehog-GLI modelJ Gastrointest Cancer20104115315820333482
- AnnaertPPTurncliffRZBoothCLThakkerDRBrouwerKLP-glycoprotein-mediated in vitro biliary excretion in sandwich-cultured rat hepatocytesDrug Metab Dispos2001291277128311560870