
Abstract
Introduction
Pancreatic cancer (PC) has a poor prognosis with high mortality, due to the lack of effective early diagnostic and prognostic tools.
Materials and methods
In order to target and diagnose PC, we developed a dual-modal imaging probe using Glypican-1 (GPC-1) antibody conjugated with Gd–Au nanoclusters (NCs; Gd-Au-NC-GPC-1). GPC-1 is a type of cell surface heparan sulfate proteoglycan, which is often highly expressed in PC. The probe was successfully prepared with a hydrodynamic diameter ranging from 13.5 to 24.4 nm.
Results
Spectral characteristics showed absorption at 280 nm and prominent emission at 650 nm. Confocal microscopic imaging showed effective detection of GPC-1 highly expressed PC cells by Gd-Au-NC-GPC-1, which was consistent with flow cytometry results. In vitro relaxivity characterization demonstrated that the r1 value of the probe was 17.722 s−1 mM−1 Gd, which was almost 4 times higher compared with that of Gd-diethylenetriaminepentacetate (DTPA; r1 value =4.6 s−1 mM−1 Gd). Gd-Au-NC-GPC-1 exhibited similar magnetic resonance (MR) signals when compared to Gd-DTPA even at lower Gd concentrations. Much higher MR signals were registered in PC cells (COLO-357) compared with normal cells (293T). Furthermore, Gd-Au-NC-GPC-1 could effectively detect PC cells in vivo by dual-modal fluorescence imaging/magnetic resonance imaging (FI/MRI) at 30 minutes postinjection. In addition, Gd-Au-NC-GPC-1 did not show significant biotoxicity to normal cells at tested concentrations both in vitro and in vivo.
Conclusion
Gd-Au-NC-GPC-1 has demonstrated to be a promising dual-modal FI/MRI contrast agent for targeted diagnosis of PC.
Introduction
Pancreatic cancer (PC) is considered to be one of the deadliest diseases. Its 5-year survival rate is <5%.Citation1,Citation2 For most PC patients, the tumor lesions are not detected at an early stage, which explains the high mortality rate. Most PC patients do not show any significant symptoms until the cancer has already metastasized; consequently, surgical therapy is no longer effective.Citation3 Hence, there is an urgent need to develop clinical diagnostic tools for early detection and diagnosis, which could significantly improve prognosis and survival.Citation4–Citation6
For PC diagnosis, it is critical to discern specific biomarkers that are highly tumor-specific.Citation7 One of these biomarkers, carbohydrate antigen 19-9 (CA19-9), has been used in the clinic to screen PC patients. However, CA19-9 lacks specificity and sensitivity, making it unable to distinguish malignant tissues from benign tissues.Citation8–Citation10 In 2015, Melo et al reported a potential biomarker for PC, Glypican-1 (GPC-1).Citation11 As a heparan sulfate proteoglycan on cell membrane, GPC-1 promotes tumor growth and invasion.Citation12,Citation13 The expression of GPC-1 is higher in human PC compared with normal pancreatic or benign lesions, making it an ideal biomarker for PC detection.Citation12
In recent years, multimodal molecular imaging has attracted researchers’ attention for medical diagnosis. Using a combination of imaging systems, it is possible to monitor tumor biological behavior in real time and to analyze malignant tissue at the cellular and subcellular level. Currently, in both clinical and preclinical settings, positron emission tomography and single-photon emission computed tomography are considered the common approaches for functional imaging, while magnetic resonance imaging (MRI) and computed tomography are used for structural imaging. In addition, optical tools, including fluorescence imaging (FI) and bioluminescence imaging, have become popular because of their low cost.Citation14–Citation17
A variety of multimodal nanoprobes have been synthesized for molecular imaging in medical research.Citation18–Citation22 Among them, dual-modal fluorescence imaging/magnetic resonance imaging (FI/MRI) agents exhibit impressive advantages and have attracted many researchers’ attention for years. Both FI and MRI are noninvasive and nonradioactive, and so these two imaging methods are safe.Citation23 FI, operating at wavelengths >600 nm, offers high detection sensitivity (including low background and autofluorescence detection), but it is limited for spatial resolution.Citation23,Citation24 In contrast, MRI does not have the shortcomings of shallow tissue penetration or poor image quality. It has high anatomical resolution, but lacks sensitivity.Citation25–Citation27 Dual-modal FI/MRI integrates the advantages of both FI and MRI. Dual-modal FI/MRI agents exhibit desirable resolution, sensitivity, and penetration depth. These characteristics make dual-modal FI/MRI agents well suited to obtain precise information of tumor sites, in the clinic.
Herein, we report a dual-modal FI/MRI probe, Gd–Au nanoclusters (NCs) conjugated with GPC-1 antibody (Gd-Au-NC-GPC-1), for detecting PC cells. Gd-Au-NC-GPC-1 shows dual-modal imaging with intense red fluorescent emission and strong T1 effect. In addition, conjugation with GPC-1 antibody enables the functional imaging probe to target high-GPC-1-expressing PC cells both in vitro and in vivo.
Materials and methods
Reagents
All reagents were commercially available. Ultrapure water was obtained by Millipore machines (Billerica, MA, USA). The following are the manufacturer details of the reagents: Bovine serum albumin (BSA) was purchased from Sigma-Aldrich (Louis, MO, USA); HAuCl4 from Guoyao Reagent Corporation (Shanghai, China); GdCl3·6H2O from HWRK Chemistry Corporation (Beijing, China); NaOH from Aladdin Chemistry Corporation (Shanghai, China); and 1-ethyl-3-(3-dimethylaminopropyl)carbodiimide (EDC)·HCl from GL Biochemistry Corporation (Shanghai, China).
Instrumentation
The following are the details of the instrumentation: Agilent 7800 (Hitachi Ltd., Tokyo, Japan) was used for inductively coupled plasma mass spectrometry; JEM-2100F electron microscopy (JEOL, Tokyo, Japan) for high-resolution transmission electron microscopy (HRTEM); Veeco Nano-Scope Multimode IIIa (Veeco, Plainview, NY, USA) for atomic force microscopy (AFM); JEM Zetasizer Nano-ZS90 (Malvern Instruments, Malvern, UK) for hydrodynamic diameter measurement; Cary 50 spectrophotometer (Varian, Palo Alto, CA, USA) for ultraviolet (UV)–visible absorption spectra measurement; F-182 4500 spectrophotometer (Hitachi) for fluorescence measurement; and RBD-upgraded PHI-5000C ESCA system (Perkin Elmer, Waltham, MA, USA) for X-ray photoelectron spectroscopy (XPS).
Preparation of NCs
Gd–Au NCs were synthesized using an improved “facile” synthetic route reported previously.Citation28 Briefly, 250 mg BSA and 5 mL water were mixed. Then, 5 mL HAuCl4 solution (10 mM) was slowly added to the mixture. Ten minutes later, 0.15 mL GdCl3 solution (500 mM) was slowly added to the mixture with stirring; 0.75 mL 1 M NaOH was then added 10 minutes later, and the solution was stirred at 37°C for 12 hours. The Gd–Au NCs were purified using dialysis and then freeze-dried. They were then dissolved with appropriate media on the day of use.
GPC-1 antibody (Abcam, Cambridge, UK) was conjugated with Gd–Au NCs by EDC.Citation29 Briefly, 30 mg Gd–Au NCs were dissolved in 900 μL PBS, and 10 mg EDC was dissolved in 100 μL PBS. After adding EDC solution (100 μL) to Gd–Au NC solution (900 μL), the solution was mixed for 5 minutes at room temperature (RT) with sonication. GPC-1 antibody (30 μL) was then added into the activated Gd–Au NC solution at RT for 2 hours with stirring, protected from light. The mixture underwent centrifugal ultrafiltration (4,000 rpm, 20 minutes) and was washed with PBS 3 times, and the conjugates were then diluted with PBS (hereafter referred to as Gd-Au-NC-GPC-1).
Cell culture and in vitro cytotoxicity
Human PC cells (COLO-357) and human normal cell lines (293T) were used in this study. COLO-357 cells were obtained from the Second Military Medical University (Shanghai, China). 293T cells were obtained from Tongji University School of Medicine (Shanghai, China). All cells were maintained according to the previously described methods and were cultured at 37°C in a 5% CO2 incubator. This research was approved by the Second Military Medical University Institutional Review Board (Shanghai, China).
For in vitro cytotoxicity testing, COLO-357 or 293T (8×10³ cells/well) cells were cultured in 96-well plates at 37°C in the presence of 5% CO2. The next day, Cell Counting Kit-8 (CCK-8) assays were performed following the manufacturer’s protocol (ZOMANBIO, Beijing, China). Briefly, cultured media were removed and replaced with 200 μL fresh culture media containing Gd–Au NCs or Gd-Au-NC-GPC-1 in various concentrations. The mixture of target cells and NCs was incubated at 37°C for 24 hours. Then, the media were removed, and the cells were washed 2 times with PBS and were then incubated in fresh media with CCK-8 solution at 37°C for 1 hour. Absorbance at 450 nm was measured using an enzyme-linked immunosorbent assay (ELISA) Plate Reader (Thermo Fisher Scientific, Waltham, MA, USA). Three independent biological experiments were performed.
Fluorescence labeling in vitro
COLO-357 and 293T cells were seeded in culture dishes at a seeding density of 2×10⁵ cells/well and incubated for 24 hours under culture conditions. After incubation, the cells were washed 2 times with PBS and then treated with Gd-Au-NC-GPC-1 or Gd–Au NCs at Au concentration of 0.46 mM for 2 hours. After discarding NCs, the cells were washed 2 times with PBS and then visualized using a Leica confocal microscope (Leica TCS SP5 II, Wetzlar, Germany) with a 60× oil objective. The cells were then digested with Trypsin (Hyclone, Logan, UT, USA), washed 2 times with PBS, and resuspended in 0.5 mL PBS. The fluorescence intensity analysis was performed by flow cytometry using a BD FACSVerse and FlowJo_V10 cytometers (BD Bioscience, Lake Franklin, NJ, USA). We gated the fluorescence intensities from cells incubated without NCs as baseline fluorescence. We then analyzed and compared the percentages of cells with positive fluorescence in the different groups. Three independent experiments were performed.
Relaxometry and in vitro MRI
The longitudinal (T1) and transverse (T2) relaxation times of Gd-Au-NC-GPC-1 were evaluated by using a 1.41 T minispec mq60 NMR Analyzer (Bruker Optik GmbH, Ettlingen, Germany) at 37°C. Relaxivity values of r1 and r2 were calculated by fitting the 1/T1 and 1/T2 relaxation time (s−1) versus the Gd concentration (mM) curves.
For in vitro MRI, COLO-357 and 293T cells (2×10⁶) were treated with various concentrations of Gd-Au-NC-GPC-1 at 37°C for 2 hours. The cells were then washed 3 times with PBS and harvested by trypsinization for 3 minutes. After centrifugation at 1,000 rpm for 5 minutes, the cells were resuspended in 20 μL PBS in an Eppendorf Tube® (Axygen, CA, USA). Magnetic resonance images were acquired using a 3.0 T MAGNETOM Skyra MRI scanner (Siemens, Erlangen, Germany) using T1-weighted sequence (Mapping, repetition time/echo time [TR/TE] =6.83/2.26 ms, thickness =2 mm).
Animal model and immunohistochemical (IHC) staining
Male nude mice (4–5 weeks old) were purchased from Shanghai Laboratory Animal Center of the Chinese Academy of Sciences (Shanghai, China). To develop the mouse tumor model, 1×10⁶ COLO-357 cells were subcutaneously injected into the axillary fossa of each mouse. Experiments were performed on COLO-357 tumor-bearing mice when tumor volumes reached about 60 mm3. All mouse experiments were approved by and performed according to the guidelines of the Second Military Medical University Laboratory Animal Center (Shanghai, China; approval ID: #20170105024).
IHC staining was performed as previously described using the GPC-1 antibody.Citation30 Integrated optical density (IOD) was analyzed using Image-pro plus 6.0 (Media Cybernetics Inc., Rockville, MD, USA).
In vivo FI/MRI
For in vivo FI, 200 μL Gd–Au NCs or Gd-Au-NC-GPC-1 (Au: 37 μM/kg) was intravenously injected into each COLO-357 tumor-bearing mouse (n=3). Then, fluorescence images were acquired at different time points before (0 minute) and after (10, 30, and 40 minutes) tail vein injection. FI was performed using an IVIS Lumina II (Hopkinton, MA, USA). The excitation wavelength of filter was 535 nm, and the emission wavelength was 670 nm. In addition, relative fluorescence intensity of the tumor region was measured and expressed as mean ± SD.
For in vivo MRI, 200 μL Gd–Au NCs or Gd-Au-NC-GPC-1 (Gd: 50 μM/kg) was intravenously injected into each COLO-357 tumor-bearing mouse (n=3). Then, MR images were obtained at different time points before (0 minute) and after (10, 30, 60, and 120 minutes) tail vein injection. MRI was performed using a 3.0 T MAGNETOM Skyra MRI scanner (Siemens) using T1-weighted sequence (Mapping, TR/TE =6.83/2.26 ms, thickness =2 mm). In addition, the relative MR intensity of the tumor region was measured and expressed as mean ± SD.
In vivo toxicity of NCs
To evaluate the acute toxicological effects of Gd-Au-NC-GPC-1 in vivo, healthy nude mice (n=3) were intravenously injected with 200 μL saline solution or Gd-Au-NC-GPC-1 (Gd: 50 μM/kg). Mice injected with saline solution were used as the control. All nude mice were anaesthetized and euthanized 24 hours later. For blood chemistry analysis, serum biochemistry analysis was performed using an Automatic Chemistry Analyzer Chemray 240 (Rayto Life and Analytical Sciences Co., Ltd., Shenzhen, China). For histology examinations, appropriate organs were harvested and stained with hematoxylin and eosin (H&E). Pathological changes were observed using an optical microscope.
Results and discussion
Preparation and characterization of Gd-Au-NC-GPC-1
Gd–Au NCs were prepared according to the methods previously reported by our group.Citation28 BSA, commonly employed as a substrate for biomineralization, was selected as the model protein for this study. Upon adding HAuCl4 and GdCl3 to the aqueous BSA solution, the protein molecules sequestered and entrapped Au and Gd ions.Citation31,Citation32
GPC-1 antibody was then conjugated with Gd–Au NCs using EDC, a water-soluble carbodiimide crosslinker.Citation29,Citation33–Citation35 Under these conjugation conditions, BSA was activated by EDC and then conjugated with GPC-1 antibody.Citation29
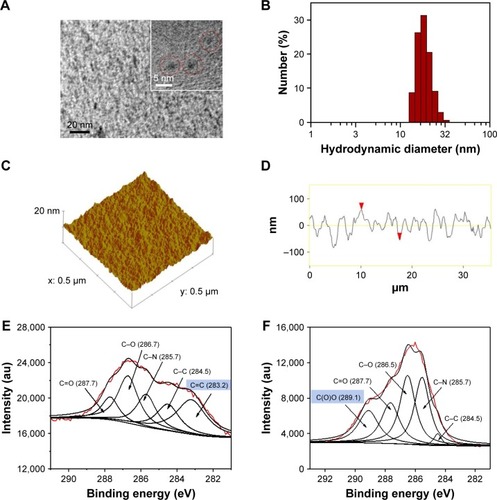
HRTEM images showed a round-like morphology for Gd-Au-NC-GPC-1 witĥ3 nm average diameter (), which was similar to the Gd–Au NCs (). Dynamic light scattering showed the hydrodynamic diameters of Gd-Au-NC-GPC-1 ranging from 13.5 to 24.4 nm with an average of 18.2 nm (), which was slightly larger than that of Gd–Au NCs (8.7 nm) due to GPC-1 antibody conjugation (). AFM 3-dimensional topographic images and line profiles showed a low surface roughness for Gd-Au-NC-GPC-1 (), which was similar to Gd–Au NCs (). From the data obtained from 3-dimensional topographic images and line profiles by AFM, we conclude the following: 1) the surface roughness of both nanomaterials (Gd-Au-NC-GPC-1 and Gd–Au NCs) were low; 2) the height distributions of both nanomaterial surfaces were homogeneous; 3) the average thickness of Gd-Au-NC-GPC-1 (23 nm) was slightly greater than that of Gd–Au NCs (18 nm) due to GPC-1 antibody conjugation; and 4) the thickness of both nanomaterials demonstrates the frame role that BSA plays in the 2 nanomaterials. The chemical structures of the probes were characterized using XPS. The C1s XPS spectra showed that 6 components are found to be associated with carbon atoms in the C1s region: O−C=O (289.1 eV), C=O (287.7 eV), C−O (286.5 eV), C−N (285.7 eV), C−C (284.5 eV), and C=C (283.2 eV). For Gd-Au-NC-GPC-1, the intensity peak of O−C=O was missing, indicating that the conjugation between carboxyl groups and primary amines was successful. The intensity peak of C=C in Gd-Au-Nc-GPC-1, which mostly came from the GPC-1 antibody, indicated successful conjugation of the GPC-1 antibody to Gd–Au NCs ().
Figure 1 (A) TEM image of Gd-Au-NC-GPC-1 (red circles). (B) Hydrodynamic diameter distribution of Gd-Au-NC-GPC-1. (C) Topographic profile of Gd-Au-NC-GPC-1. (D) Line profile of Gd-Au-NC-GPC-1. (E) The C1s XPS spectra of Gd-Au-NC-GPC-1. (F) The C1s XPS spectra of Gd–Au NCs.
Note: (D) Red arrowheads: two points selected artificially during the process of cartography, in order to determine the location of the line profile.
Abbreviations: Gd-Au-NC-GPC-1, Gd–Au NCs conjugated with GPC-1 antibody; GPC-1, Glypican-1; NCs, nanoclusters; TEM, transmission electron microscopy; XPS, X-ray photoelectron spectroscopy.
Property characterization of Gd-Au-NC-GPC-1
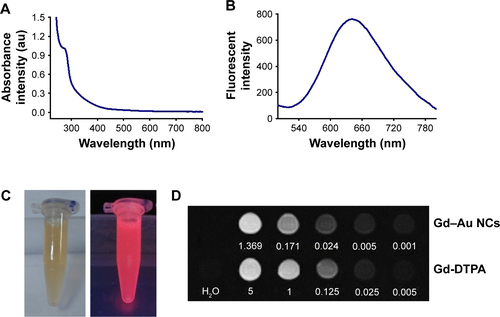
Property characterization of Gd-Au-NC-GPC-1 indicated that there was no significant influence by conjugating the GPC-1 antibody. As shown in , Gd-Au-NC-GPC-1 had absorption at 280 nm. The absorption peak was less well defined in Gd-Au-NC-GPC-1 compared with Gd–Au NCs (), which was mostly associated with ultrafiltration. It has been reported that the absorption peak at 280 nm originates from the aromatic amino acid.Citation36 As free BSA was removed during purification by ultrafiltration, the absorption peak in the Gd-Au-NC-GPC-1 became less well defined. Fluorescence emission spectra showed that strong fluorescence at 650 nm was observed from Gd-Au-NC-GPC-1 (), which was similar to that of Gd–Au NCs (). Using a 365-nm UV-lamp irradiation, Gd-Au-NC-GPC-1 exhibits strong fluorescence intensity as for Gd–Au NCs ( and ), which make it an ideal FI contrast agent.
Figure 2 (A) UV–visible absorption spectra of Gd-Au-NC-GPC-1. (B) Fluorescent emission spectra of Gd-Au-NC-GPC-1. (C) Bright (left) and fluorescent (right) photograph of Gd-Au-NC-GPC-1. (D) T1 and T2 relaxation times of Gd-Au-NC-GPC-1. (E) T1-weighted MR images of Gd-DTPA and Gd-Au-NC-GPC-1 at various concentrations (mM).
Abbreviations: DTPA, diethylenetriaminepentacetate; Gd-Au-NC-GPC-1, Gd–Au NCs conjugated with GPC-1 antibody; GPC-1, Glypican-1; MR, magnetic resonance; NCs, nanoclusters; UV, ultraviolet.
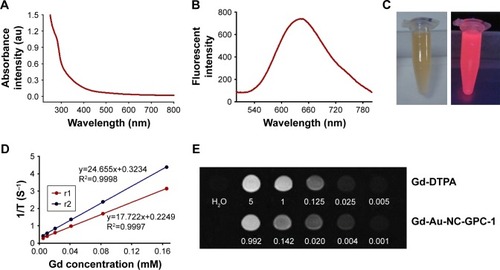
To evaluate the potential application of Gd-Au-NC-GPC-1 as an MRI contrast agent, the T1 and T2 relaxivity values were measured at different Gd concentrations. As shown in , the r1 value of Gd-Au-NC-GPC-1 was 17.722 s−1 mM−1 Gd, which was almost 4 times higher compared with the r1 value of Gd-diethylenetriaminepentacetate (DTPA; a clinical MRI contrast agent; r1 value =4.6 s−1 mM−1 Gd).Citation36 In addition, the ratio of r2 to r1 was relatively low (r2/r1 =1.39, r2/r1<3), indicating a strong T1 effect.Citation37 In this study, we considered 3 as a useful cutoff r2/r1 ratio, because most of the T1 contrast agents had r2/r1 ratios ranging between 1 and 2, while the r2/r1 ratios for T2 contrast agents are always much higher (iron oxide particles ≥10).Citation37,Citation38 Next, the T1-weighted MR images were compared ( and ). Gd-Au-NC-GPC-1 exhibits similar MR signals as Gd-DTPA even at lower Gd concentrations (). Results showed that MR signals between Gd-Au-NC-GPC-1 and Gd–Au NCs were almost same, which indicated that the conjugation of the GPC-1 antibody did not result in significant influence on MR signals from Gd–Au NCs. These results suggest that Gd-Au-NC-GPC-1 could be used as a T1-positive contrast agent.
Cell toxicity of Gd-Au-NC-GPC-1
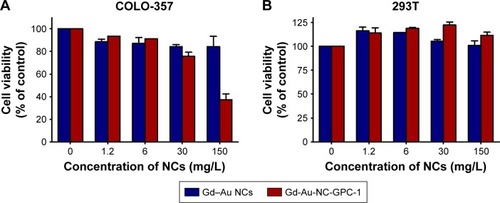
In order to test the cell toxicity of Gd-Au-NC-GPC-1, we selected human PC cells (COLO-357) and human normal cell lines (293T) as our target cells. CCK-8 assays were used to determine cell toxicity.Citation33 The results of target cells treated with both Gd–Au NCs and Gd-Au-NC-GPC-1 at various concentrations for 24 hours are shown in . Concentrations ranging from 0 to 150 mg/L were tested. Results indicated that there was no significant cytotoxicity (cell viability >80%) for Gd–Au NCs against both COLO-357 () and 293T cells () at all the concentrations tested, which was consistent with our previously published results.Citation28 For Gd-Au-NC-GPC-1, no significant cytotoxicity was observed in 293T cells at all concentrations tested, which was similar to Gd–Au NCs (). However, Gd-Au-NC-GPC-1 showed dose-dependent cytotoxicity (cell viability: from 75.7% to 37.4%) against COLO-357 cells at relatively high concentrations (concentrations: from 30 to 150 mg/L; ), which may be associated with complement-dependent cytotoxicity.Citation39 Gd-Au-NC-GPC-1 showed selective cell toxicity to PC cells, but almost no toxicity to human normal cells (293T cells), indicating that Gd-Au-NC-GPC-1 would be a promising agent for in vivo use.
Figure 3 Cell viability of COLO-357 (A) and 293T cells (B) after incubation with different concentrations of Gd–Au NCs (blue) or Gd-Au-NC-GPC-1 (red) for 24 hours.
Abbreviations: Gd-Au-NC-GPC-1, Gd–Au NCs conjugated with GPC-1 antibody; GPC-1, Glypican-1; NCs, nanoclusters.
Dual-modal imaging of PC cells in vitro
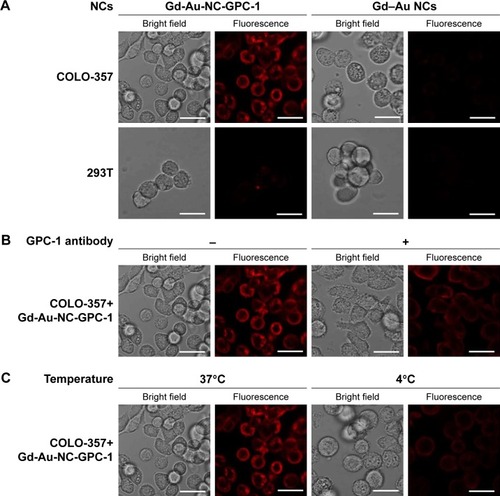
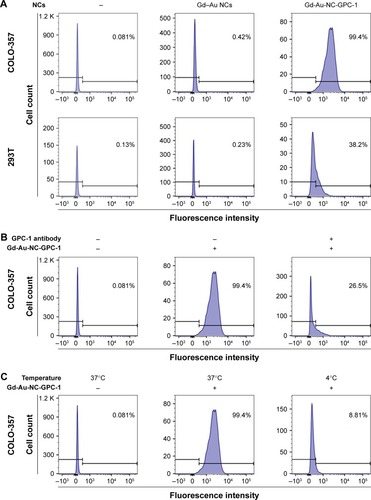
As Gd-Au-NC-GPC-1 exhibits strong fluorescence at 650 nm, it is possible to detect PC cells by FI using confocal microscopy and flow cytometry. COLO-357 and 293T cells were incubated with Gd-Au-NC-GPC-1 or Gd–Au NCs (Au concentration: 0.46 mM) at 37°C for 2 hours (). Gd-Au-NC-GPC-1 exhibits strong red fluorescence on the surface of COLO-357 cells, but was rather weak on the surface of 293T cells. In contrast, incubating with Gd–Au NCs, the red fluorescence on the surface of both COLO-357 and 293T cells was almost absent. These results suggest that Gd-Au-NC-GPC-1 is a selective FI agent for detecting PC cells in vitro. Next, we investigated whether the labeling of PC cells by Gd-Au-NC-GPC-1 is through specific binding of GPC-1 antibody to antigen. We preincubated COLO-357 cells with GPC-1 antibody at 37°C for 2 hours, followed by incubation with Gd-Au-NC-GPC-1 at 37°C for another 2 hours (). If Gd-Au-NC-GPC-1 labeling of PC cells was through the specific binding of GPC-1 antibody to antigen, then GPC-1 antibody will competitively bind to GPC-1 antigen in the preincubation stage, leading to reduced binding of Gd-Au-NC-GPC-1 to PC cells. In addition, we incubated COLO-357 cells with Gd-Au-NC-GPC-1 at 4°C for 2 hours (). It is known that the optimal condition for most IgG antibody binding to antigen is at 37°C; hence, the low temperature would reduce the binding rate of antibody and antigen.Citation40 If Gd-Au-NC-GPC-1 labeling of PC cells was through the specific binding of GPC-1 antibody to antigen, the incubation temperature at 4°C will reduce the binding rate of Gd-Au-NC-GPC-1 to PC cells. Results showed that the intensity of fluorescence was reduced for both GPC-1 antibody preincubation and 4°C incubation. These results suggest that the FI of PC cells by Gd-Au-NC-GPC-1 was through specific binding of GPC-1 antibody to antigen.
Figure 4 Confocal fluorescence images of in vitro cell uptake of Gd-Au-NC-GPC-1 at Au concentration of 0.46 mM. (A) COLO-357 and 293T cells were incubated with Gd-Au-NC-GPC-1 or Gd–Au NCs at 37°C for 2 hours. (B) COLO-357 cells were preincubated with or without GPC-1 antibody (dilution rate, 1:50) at 37°C for 2 hours. After discarding GPC-1 antibody and washing target cells with PBS 2 times, COLO-357 cells were incubated with Gd-Au-NC-GPC-1 at 37°C for another 2 hours. (C) COLO-357 cells were incubated with Gd-Au-NC-GPC-1 at 37°C or 4°C for 2 hours. Bar, 25 μm.
Abbreviations: Gd-Au-NC-GPC-1, Gd–Au NCs conjugated with GPC-1 antibody; GPC-1, Glypican-1; NCs, nanoclusters.
As shown in , the fluorescence intensity values of Gd–Au NCs on COLO-357 and 293T cells were quite low (COLO-357: 0.42%; 293T: 0.23%). In sharp contrast, the fluorescence intensity of Gd-Au-NC-GPC-1 on COLO-357 cells was enhanced significantly (99.4%). However, the fluorescence intensity of Gd-Au-NC-GPC-1 on 293T cells was slightly enhanced (38.2%). These data indicate that Gd-Au-NC-GPC-1 was a selective FI agent for labeling PC cells in vitro, which is consistent with the results obtained by confocal microscopy. shows that preincubation with GPC-1 antibody reduced the fluorescence intensity of Gd-Au-NC-GPC-1 on COLO-357 cells (26.5%). shows that incubation at 4°C also reduced the fluorescence intensity of Gd-Au-NC-GPC-1 on PC cells (8.81%). These data suggest that the fluorescence labeling of Gd-Au-NC-GPC-1 is through specific binding of GPC-1 antibody to antigen, which is consistent with the results obtained by confocal microscopy. These results indicate that Gd-Au-NC-GPC-1 is a potential FI contrast agent with a strong in vitro GPC-1 targeting capability.
Figure 5 GPC-1 targeted uptake analysis of Gd-Au-NC-GPC-1 at Au concentration of 0.46 mM by flow cytometry. (A) COLO-357 and 293T cells were incubated with Gd-Au-NC-GPC-1 or Gd–Au NCs at 37°C for 2 hours. (B) COLO-357 cells were preincubated with or without GPC-1 antibody (dilution rate, 1:50) at 37°C for 2 hours. After discarding GPC-1 antibody and washing target cells with PBS 2 times, COLO-357 cells were incubated with Gd-Au-NC-GPC-1 at 37°C for another 2 hours. (C) COLO-357 cells were incubated with Gd-Au-NC-GPC-1 at 37°C or 4°C for 2 hours.
Abbreviations: Gd-Au-NC-GPC-1, Gd–Au NCs conjugated with GPC-1 antibody; GPC-1, Glypican-1; NCs, nanoclusters.
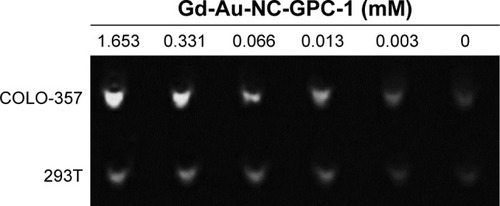
Since Gd-Au-NC-GPC-1 exhibits a strong T1 effect, it is possible to detect PC cells by MRI. shows the MR signal intensities of COLO-357 and 293T cells treated with various concentrations of Gd-Au-NC-GPC-1. Data show that the cells treated with Gd-Au-NC-GPC-1 exhibit concentration-dependent MR signal intensity. In addition, MR signal intensity of COLO-357 cells was much stronger compared with 293T cells, which was associated with the strong GPC-1 targeting capability of Gd-Au-NC-GPC-1. These results suggest that Gd-Au-NC-GPC-1 is a promising selective positive MRI contrast agent for detecting PC cells in vitro.
Figure 6 In vitro MRI study with COLO-357 and 293T cells.
Abbreviations: Gd-Au-NC-GPC-1, Gd–Au NCs conjugated with GPC-1 antibody; GPC-1, Glypican-1; MRI, magnetic resonance imaging; NCs, nanoclusters.
Dual-modal imaging of PC cells in vivo
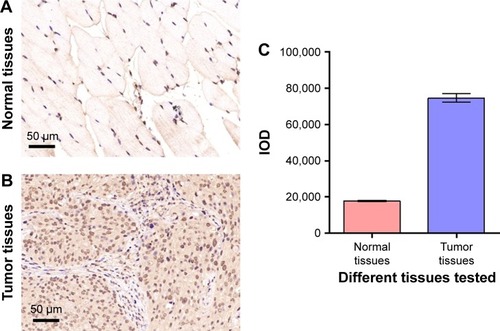
We next investigated the dual-modal imaging effect of Gd-Au-NC-GPC-1 in vivo. COLO-357 tumor-bearing nude mice were used as animal models. To investigate the level of GPC-1 in the tumor tissues of COLO-357 tumor-bearing nude mice, we performed IHC staining of GPC-1 in COLO-357 tumor tissues and adjacent normal tissues (). The results of IOD analysis showed that the expression level of GPC-1 in COLO-357 tumor tissues was significantly higher than that of normal tissues (), which was consistent with the previous reports.Citation12
Figure 7 GPC-1 is increased in the tumor tissues of COLO-357 tumor-bearing nude mice. (A, B) IHC staining of GPC-1 (brown color) in the normal tissues (A) and COLO-357 tumor tissues (B). (C) IOD of the results of (A, B).
Abbreviations: GPC-1, Glypican-1; IHC, immunohistochemical; IOD, integrated optical density.
After intravenous injection with 200 μL Gd–Au NCs or Gd-Au-NC-GPC-1 into tumor-bearing mice, in vivo fluorescence images and MR images were obtained at different time points. shows the fluorescence images of NCs in vivo. shows the relative fluorescence intensities of tumor sites. For Gd–Au NCs-treated mice, the fluorescent intensities in tumor sites gradually increased during the first 10 minutes after injection and decreased slightly during the following 30 minutes. We inferred that the enhancement of fluorescence signal may be attributable to the enhanced permeability and retention (EPR) effect.Citation36 For Gd-Au-NC-GPC-1-treated mice, the fluorescence intensity in tumor sites increased with time, reached a peak at 30 minutes after injection, and then subsequently decreased during the next 10 minutes. The fluorescence signal of tumor sites in the Gd-Au-NC-GPC-1 group was much higher than that in the Gd–Au NCs group, suggesting the strong GPC-1 targeting capacity of Gd-Au-NC-GPC-1 in vivo. Although the results of FI had limited spatial resolution, the high detection sensitivity makes Gd-Au-NC-GPC-1 an ideal FI contrast agent for detecting PC cells.
Figure 8 In vivo FI and MRI of COLO-357 tumor-bearing nude mice in the supine position. (A) Fluorescence images were taken at different time points after intravenous injection of Gd–Au NCs or Gd-Au-NC-GPC-1. The tumor sites are marked by black dotted circles. (B) Relative fluorescence intensities of tumor sites relate to (A). (C) T1-weighted MR images were taken at different time points after intravenous injection of Gd–Au NCs or Gd-Au-NC-GPC-1. The tumor sites are marked by red dotted circles. (D) Relative MR signal intensities of tumor sites relate to (C).
Abbreviations: FI, fluorescence imaging; Gd-Au-NC-GPC-1, Gd–Au NCs conjugated with GPC-1 antibody; GPC-1, Glypican-1; MRI, magnetic resonance imaging; NCs, nanoclusters.
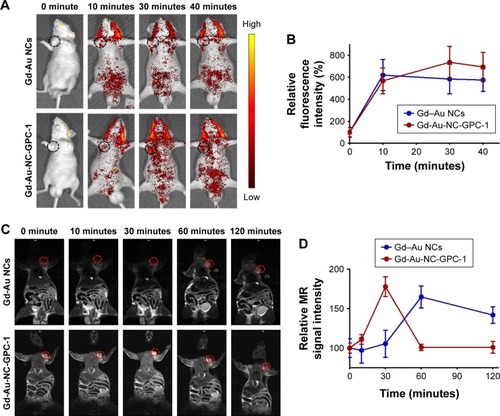
shows the MR images of NCs in vivo. In addition, shows the relative MR intensities of tumor sites. For Gd–Au NCs-treated mice, the MR signal in the tumor site increased gradually during the first 60 minutes and then started to decrease during the next 60 minutes. Similarly, we inferred that the time-dependent increase of MR signal in the Gd–Au NCs group was also associated with the EPR effect.Citation36 For Gd-Au-NC-GPC-1-treated mice, an obviously bright MR signal was observed in the tumor site at 30 minutes after injection. The MR signal in the Gd-Au-NC-GPC-1-treated group was earlier and stronger than that in the Gd–Au NCs-treated group. These results confirmed the strong GPC-1 targeting capacity of Gd-Au-NC-GPC-1 in vivo, which was consistent with the results of FI. Although the results of MRI had low sensitivity, the high spatial resolution makes Gd-Au-NC-GPC-1 an ideal MRI contrast agent for detecting PC cells.
It is documented that FI has high detection sensitivity, but suffers from limited spatial resolution.Citation23,Citation24 Conversely, MRI has high anatomical resolution, but lacks the sensitivity.Citation25–Citation27 The sensitivity of Gd-Au-NC-GPC-1 with dual-modal FI/MRI function is reflected in the following aspects: 1) in the dual-modal imaging of PC cells in vitro, MRI could only demonstrate whether or how much Gd-Au-NC-GPC-1 was located with PC cells or the combination degree. However, FI could clearly show that Gd-Au-NC-GPC-1 was targeted on the cell membrane of COLO-357 cells; and 2) in the dual-modal imaging of PC cells in vivo, FI could only demonstrate whether Gd-Au-NC-GPC-1 was targeted to the tumor and the approximate position of the tumor in the mouse. However, MRI could clearly show the exact location of the tumor based on the position of other organs. In this study, Gd-Au-NC-GPC-1 not only demonstrated the targeting spot at the cellular level, but also showed the exact location of the tumor in vivo. Therefore, Gd-Au-NC-GPC-1 with dual-modal FI/MRI function has the potential to be used both for the early diagnosis of PC in the clinic and as a research tool to determine the mechanism of action at the cellular level.
In vivo toxicity of Gd-Au-NC-GPC-1
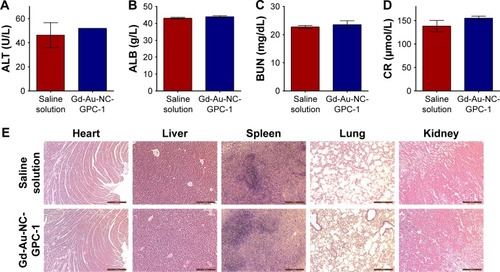
To investigate the acute toxicity of Gd-Au-NC-GPC-1 in vivo, serum biochemistry and histological examinations were performed (). Healthy nude mice (n=3) were intravenously injected with 200 μL saline solution or Gd-Au-NC-GPC-1 (Gd: 50 μM/kg) and then euthanized 24 hours later. The results of serum biochemistry analysis showed that there were no significant differences between the saline solution and Gd-Au-NC-GPC-1 group. Both liver function markers () and kidney function markers () in the Gd-Au-NC-GPC-1 group were within the normal range. H&E staining images of 5 major organs (heart, liver, spleen, lung, and kidney) from the saline-solution-injected mice and Gd-Au-NC-GPC-1-injected mice were compared (). Compared with the saline-solution-injected mice, there were no obvious pathology changes in the major organs of the Gd-Au-NC-GPC-1-injected mice. These results indicate that Gd-Au-NC-GPC-1 has good biosafety at the tested dose, which makes possible further clinical application.
Figure 9 Acute toxicology evaluation of Gd-Au-NC-GPC-1 in vivo. Healthy nude mice were intravenously injected with 200 μL saline solution or Gd-Au-NC-GPC-1 (Gd: 50 μM/kg) and then were euthanized 24 hours later (n=3). (A–D) Results of serum biochemistry analysis. (E) H&E stained images of mice visceral organs. Scale bar: 200 μm.
Abbreviations: ALB, albumin; ALT, alanine aminotransferase; BUN, blood urea nitrogen; CR, creatinine; Gd-Au-NC-GPC-1, Gd–Au NCs conjugated with GPC-1 antibody; GPC-1, Glypican-1; H&E, hematoxylin and eosin; NCs, nanoclusters.
Conclusion
We established a new multifunctional nanoprobe designated Gd-Au-NC-GPC-1 for detecting PC cells. Dual-modal Gd-Au-NC-GPC-1 nanoprobe exhibits intense red fluorescent emission and strong T1 effect. Conjugation with GPC-1 antibody enabled the functional imaging probe to effectively target GPC-1-expressing PC cells both in vitro and in vivo. Gd-Au-NC-GPC-1 could be a promising candidate for detecting PC cells in the clinic.
Author contributions
All authors contributed toward data analysis, drafting and revising the paper and agree to be accountable for all aspects of the work.
Acknowledgments
This study was supported by the Natural Science Foundation of China (Numbers: 81772285 and 31671029), Shanghai Health and Family Planning Commission Project (Number: 2017YQ051), Shanghai Science and Technology Commission Project (Number: 17411968700), and Shanghai Natural Science Foundation (Number: 16ZR1400700).
Supplementary materials
Figure S1 (A) TEM image of Gd–Au NCs. (B) Hydrodynamic diameter distribution of Gd–Au NCs. (C) Topographic profile of Gd–Au NCs. (D) Line profile of Gd–Au NCs.
Note: (D) Red arrowheads: two points selected artificially during the process of cartography, in order to determine the location of the line profile.
Abbreviations: Gd-Au-NC-GPC-1, Gd–Au NCs conjugated with GPC-1 antibody; GPC-1, Glypican-1; NCs, nanoclusters; TEM, transmission electron microscopy.
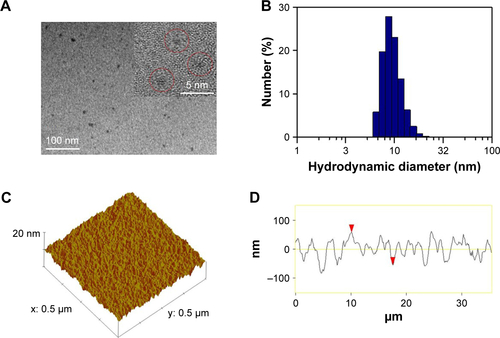
Figure S2 (A) UV–visible absorption spectra of Gd–Au NCs. (B) Fluorescent emission spectra of Gd–Au NCs. (C) Bright (left) and fluorescent (right) photograph of Gd–Au NCs. (D) T1-weighted MR images of Gd-DTPA and Gd–Au NCs with various concentrations (mM).
Abbreviations: DTPA, diethylenetriaminepentacetate; Gd-Au-NC-GPC-1, Gd–Au NCs conjugated with GPC-1 antibody; GPC-1, Glypican-1; MR, magnetic resonance; NCs, nanoclusters; UV, ultraviolet.
Disclosure
The authors report no conflicts of interest in this work.
References
- KamisawaTWoodLDItoiTTakaoriKPancreatic cancerLancet201638810039738526830752
- WolfgangCLHermanJMLaheruDARecent progress in pancreatic cancerCA Cancer J Clin201363531834823856911
- GillenSSchusterTMeyer Zum BuschenfeldeCFriessHKleeffJPreoperative/neoadjuvant therapy in pancreatic cancer: a systematic review and meta-analysis of response and resection percentagesPLoS Med201074e100026720422030
- KaurSBaineMJJainMSassonARBatraSKEarly diagnosis of pancreatic cancer: challenges and new developmentsBiomark Med20126559761223075238
- ZhouBXuJWChengYGEarly detection of pancreatic cancer: where are we now and where are we going?Int J Cancer2017141223124128240774
- WongKKQianZLeYThe role of precision medicine in pancreatic cancer: challenges for targeted therapy, immune modulating treatment, early detection, and less invasive operationsCancer Transl Med2016224147
- HussainSPPancreatic cancer: current progress and future challengesInt J Biol Sci201612327027226929733
- JaziehKAFooteMBDiazLAJrThe clinical utility of biomarkers in the management of pancreatic adenocarcinomaSemin Radiat Oncol2014242677624635863
- ChanAPrassasIDimitromanolakisAValidation of biomarkers that complement CA19.9 in detecting early pancreatic cancerClin Cancer Res201420225787579525239611
- HanadaKOkazakiAHiranoNDiagnostic strategies for early pancreatic cancerJ Gastroenterol201550214715425501287
- MeloSALueckeLBKahlertCGlypican-1 identifies cancer exosomes and detects early pancreatic cancerNature2015523755917718226106858
- KleeffJIshiwataTKumbasarAThe cell-surface heparan sulfate proteoglycan glypican-1 regulates growth factor action in pancreatic carcinoma cells and is overexpressed in human pancreatic cancerJ Clin Invest19981029166216739802880
- DuanLHuXQFengDYLeiSYHuGHGPC-1 may serve as a predictor of perineural invasion and a prognosticator of survival in pancreatic cancerAsian J Surg201336171223270819
- WeisslederRMahmoodUMolecular imagingRadiology2001219231633311323453
- SangtaniANagOKFieldLDBregerJCDelehantyJBMultifunctional nanoparticle composites: progress in the use of soft and hard nanoparticles for drug delivery and imagingWiley Interdiscip Rev Nanomed Nanobiotechnol201796
- LouieAMultimodality imaging probes: design and challengesChem Rev201011053146319520225900
- ChenQShangWZengCTheranostic imaging of liver cancer using targeted optical/MRI dual-modal probesOncotarget2017820327413275128416757
- DongALanSHuangJModifying Fe3O4-functionalized nanoparticles with N-halamine and their magnetic/antibacterial propertiesACS Appl Mater Interfaces20113114228423522008460
- YangJLuoYXuYConjugation of iron oxide nanoparticles with RGD-modified dendrimers for targeted tumor MR imagingACS Appl Mater Interfaces2015795420542825695661
- GuoWYangWWangYColor tunable Gd-Zn-Cu-In-S/ZnS quantum dots for dual modality magnetic resonance and fluorescence imagingNano Res20147111581159125485043
- YangWGuoWGongXFacile synthesis of Gd-Cu-In-S/ZnS bimodal quantum dots with optimized properties for tumor targeted fluorescence/MR in vivo imagingACS Appl Mater Interfaces2015733187591876826257133
- HuHHuangPWeissOJPET and NIR optical imaging using self-illuminating (64)Cu-doped chelator-free gold nanoclustersBiomaterials201435379868987625224367
- XuCWangYZhangCJiaYLuoYGaoXAuGd integrated nanoprobes for optical/MRI/CT triple-modal in vivo tumor imagingNanoscale20179134620462828323295
- ZhangJHaoGYaoCAlbumin-mediated biomineralization of paramagnetic NIR Ag2S QDs for tiny tumor bimodal targeted imaging in vivoACS Appl Mater Interfaces2016826166121662127300300
- XingXZhangBWangXLiuFShiDChengYAn “imaging-biopsy” strategy for colorectal tumor reconfirmation by multipurpose paramagnetic quantum dotsBiomaterials201548162525701028
- WangHZhouSMagnetic and fluorescent carbon-based nanohybrids for multi-modal imaging and magnetic field/NIR light responsive drug carriersBiomater Sci2016471062107327184106
- BaiJJulieTWRubioNTriple-modal imaging of magnetically-targeted nanocapsules in solid tumours in vivoTheranostics20166334235626909110
- LeWCuiSChenXZhuHChenBCuiZFacile synthesis of Gd-functionalized gold nanoclusters as potential MRI/CT contrast agentsNanomaterials (Basel)20166465
- RetnakumariAJayasimhanJChandranPCD33 monoclonal antibody conjugated Au cluster nano-bioprobe for targeted flow-cytometric detection of acute myeloid leukaemiaNanotechnology2011222828510221654031
- DingHWeiJZhaoYLiuYLiuLChengLProgranulin derived engineered protein Atsttrin suppresses TNF-alpha-mediated inflammation in intervertebral disc degenerative diseaseOncotarget201786510969210970229312639
- XieJPZhengYGYingJYProtein-directed synthesis of highly fluorescent gold nanoclustersJ Am Chem Soc2009131388888919123810
- IsabAAHormannALHillDTGriswoldDEDiMartinoMJShawCFBis(triethylphosphine)gold(I) chloride: ionization in aqueous solution, reduction in vitro of the external and internal disulfide bonds of bovine serum albumin and antiarthritic activityInorg Chem198928713211326
- LiuFLeWMeiTIn vitro and in vivo targeting imaging of pancreatic cancer using a Fe3O4@SiO2 nanoprobe modified with anti-mesothelin antibodyInt J Nanomedicine2016112195220727274243
- ChouSWShauYHWuPCYangYSShiehDBChenCCIn vitro and in vivo studies of FePt nanoparticles for dual modal CT/MRI molecular imagingJ Am Chem Soc201013238132701327820572667
- RetnakumariASetuaSMenonDMolecular-receptor-specific, non-toxic, near-infrared-emitting Au cluster-protein nanoconjugates for targeted cancer imagingNanotechnology201021505510320023317
- SunSKDongLXCaoYSunHRYanXPFabrication of multi-functional Gd2O3/Au hybrid nanoprobe via a one-step approach for near-infrared fluorescence and magnetic resonance multimodal imaging in vivoAnal Chem201385178436844123924153
- CaravanPEllisonJJMcMurryTJLaufferRBGadolinium(III) chelates as MRI contrast agents: structure, dynamics, and applicationsChem Rev19999992293235211749483
- KimBHLeeNKimHLarge-scale synthesis of uniform and extremely small-sized iron oxide nanoparticles for high-resolution T-1 magnetic resonance imaging contrast agentsJ Am Chem Soc201113332126241263121744804
- LiHSunYChenDSynergistic anti-tumor therapy by a comb-like multifunctional antibody nanoarray with exceptionally potent activitySci Rep201551571226508306
- ArmstrongBAntigen–antibody reactionsISBT Sci Ser2008322132