

Abstract
Purpose
The low penetration of drugs across the blood–brain barrier (BBB) compromises the delivery of chemotherapeutic agents to the brain parenchyma and contributes to the poor prognosis of glioblastoma multiforme (GBM). We investigated the efficacy of methotrexate-loaded lipid-core nanocapsules (MTX-LNC) administered by the oral route to treat murine GBM, its ability to cross the BBB, and the mechanisms of MTX-LNC uptake by cultured GL261 glioma and BV2 microglia cells.
Materials and methods
Female C57B/6 mice were used in intravital microscopy assays to investigate the penetrance of rhodamine B-label MTX-LNC (RhoB/MTX-LNC) in the brain after oral or IV administration, and to evaluate the BBB integrity. Intracranial implantation of GL261 cells was undertaken to induce a murine GBM model, and the effectiveness of oral MTX or MTX-LNC treatments (started on Day 10 of GBM, every 2 days for 12 days) was quantified by tumor size, body weight, and leukogram. Pharmacological blockade of endocytic pathways was done to investigate the mechanisms of MTX-LNC uptake by cultured GL261 and microglia BV2 cells by using fluorescence microscopy. The effect of MTX-LNC or MTX on GL261 and BV2 proliferation was evaluated to compare the cytotoxicity of such compounds.
Results
RhoB/MTX-LNC was detected in brain parenchyma of mice after IV or oral administration, without any damage on BBB. Oral treatment with MTX-LNC reduced tumor volume and prevented weight loss and leukopenia in comparison to MTX-treated mice. MTX-LNC uptake by GL261 is caveolae-dependent, whereas endocytosis of MTX-LNC by BV2 occurs via phagocytosis and macropinocytosis. Both MTX-LNC and MTX reduced GL261 and BV2 proliferation; however, MTX-LNC showed higher efficacy in the inhibition of glioma proliferation.
Conclusion
Together, we infer that the higher ability of MTX-LNC to cross the BBB and be captured by cancer and immune brain cells by different mechanisms is responsible for the higher efficacy of oral MTX-LNC treatment in GBM.
Supplementary materials
Blood–brain barrier (BBB) integrity
In order to investigate the effects of MTX-LNC on BBB permeability, we evaluated the effect of treatments in the extravasation of Evans Blue (EB) (Sigma-Aldrich; St. Louis, MO, USA) into brain parenchyma. Briefly, EB solution (2%) was injected (4 mL/kg) into the femoral vein of anesthetized mice 5 minutes after IV treatment with MTX-LNC, MTX, or saline solution. Twenty-four hours later, 0.4 mL blood was collected and mice were transcardially perfused with PBS for 5 minutes. The brain was removed and divided into two hemispheres, and each one was homogenized and sonicated in 1 mL of 50% trichloroacetic acid (Sigma-Aldrich) and centrifuged (10,000 rpm, 20 minutes). The supernatant was diluted with ethanol, and EB concentrations in brain and plasma were determined by using a fluorescence spectrophotometer (FLUOstar Optima microplate reader; BMG Labtech, Inc., Ortenberg, Germany). The BBB permeability was determined by dividing cerebral EB concentration (µg/g brain weight) by the plasma EB concentration (µg/g).
Intracranial injection of glioma cells
The intracranial implantation of GL261 (105 cells) was undertaken following the protocol previously described by Rodrigues et al.Citation8 The entire procedure was carried out under sterile operating room conditions. Briefly, mice were anesthetized and affixed in a prone position using an acrylic stereotactic head frame. A vertical incision was made in the skin overlying the skull, exposing the coronal suture and bregma. A cranial window (2 mm2) was opened using a mini drill starting 1 mm to the right of the midline sagittal suture and 1 mm posterior to the coronal suture. A 26-gauge needle was inserted at a position 2.7 mm right of the midline sagittal suture, 0.5 mm posterior to the coronal suture, and at a depth of 2.4 mm from the surface of the brain. A cell culture solution (2 µL; 5×10⁷ cells/mL) was injected over 8 minutes with an automated microinjection system attached to a fully motorized stereotaxic system (Neurostar, Sindelfingen, Germany). Then, the needle was slowly removed, the original cranial bone was returned to the place, and bone wax was used to fix the bone in place. The skin incision was closed with 6-0 suture and analgesia (2 mg/kg ketoprofen; intraperitoneal [IP]) was administered at the end of the surgery. The food intake and the body mass of the mice were measured every 48 hours until the euthanizing of animals.
Endocytosis of RhoB/MTX-LNC on glial cells
For assessment of MTX-LNC/RB endocytosis, GL261 and BV2 (20,000 cells) were seeded in sterile coverslips (13 mm) 24 hours before experiments. After adhesion, cells remained in the serum-deprived medium overnight. After that, cells were washed with PBS and incubated at different times (1, 5, 20, 40, or 60 minutes at 37°C) with Hank’s balanced salt solution (HBSS) containing MTX-LNC/RB (5,500 nmol/L). Then, cells were washed (3×5 minutes) with PBS and incubated (5 minutes, 37°C) with HBSS containing 4′, 6-diamidino-2-phenylindole (DAPI; 1:50) for cell nuclear localization. Cells were washed (3×5 minutes) and fluorescent images were acquired by using a fluorescence microscope (AxioVision; Carl-Zeiss). The images were analyzed by using Zen 2012 (Carl-Zeiss) and the fluorescence intensity (arbitrary units; au) was measured in the region of interest by selecting just inside the cell. All the quantifications were carried out on background-subtracted images. For each experiment, five field images that were randomly selected were analyzed, and between 6 and 8 cells were analyzed in each field. The results are shown as the percentage of RhoB/MTX-LNC endocytosis in comparison with control cells that were incubated with HBSS without RhoB/MTX-LNC. These experiments were conducted in order to determine whether RhoB/MTX-LNC are able to enter cells and the time necessary to maximal endocytosis of RhoB/MTX-LNC. In order to determine the concentration of endocytosis inhibitors, BV2 cells were seeded in sterile coverslips and incubated (1 hour at 37°C) with HBSS containing fluorescent probes used as positive control to phagocytosis (zymozan conjugated to Alexa Fluor 488–500 µg/mL); or clathrin-mediated endocytosis (low-density lipoprotein [LDL] conjugated to Alexa Fluor 488–20 µg/mL); or caveolae-mediated endocytosis (choleric toxin conjugated to Alexa Fluor 488-10 µg/mL). The pre-incubation of BV2 cells with Cyto D (10 µmol/L), Suc (0.5 mol/L), or MβC (10 µmol/L) was able to induce a significant decrease (P<0.05) in the capitation of positive controls to phagocytosis, clathrin-mediated endocytosis, and caveolae-mediated endocytosis, respectively.
Figure S1 (A) Particle size distributions obtained by laser diffraction (Mastersize 2000; Malvern Panalytical, Malvern UK); (B) dynamic light scattering (Zetasizer ZS; Malvern Panalytical, Malvern, UK); and (C) nanoparticle tracking analysis (Nanosight LM10; Nanosight, Malvern Panalytical, Malvern, UK) for LNC (left), MTX-LNC (center) and rhodamine B-labeled LNC-MTX (right). Mean ± SD for triplicate batches (n=3).
Abbreviations: LNC, lipid-core nanocapsules; MTX-LNC, methotrexate-loaded lipid-core nanocapsules.
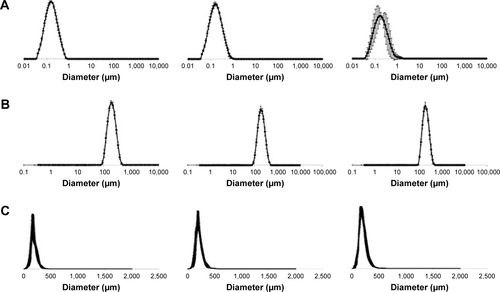
Figure S2 (A) Bar graphs and representative images showing fluorescence of RhoB/MTX-LNC (5,500 nmol/L) in BV2 cells after 1, 5, 20, 40, or 60 minutes of incubation. (B) Positive control of phagocytosis-mediated endocytosis. BV2 cells were incubated with HBSS containing zymozan conjugated to Alexa Fluor 488 (500 µg/mL) in the absence (control) or presence of Cyto D (10 µmol/L). (C) Positive control of clathrin-mediated endocytosis. BV2 cells were incubated with HBSS containing LDL conjugated to Alexa Fluor 488 (20 µg/mL) in the absence (control) or presence of high concentration of Suc (0.5 mol/L). (D) Positive control of caveolin-mediated endocytosis. BV2 cells were incubated with HBSS containing choleric toxin conjugated to Alexa Fluor 488 (10 µg/mL) in the absence (control) or presence of MβC (5 mmol/L). For phagocytosis analyses, the number of labeled cells (presence of phagosome) was counted, whereas for clathrin- or caveolin-mediated endocytosis, the fluorescence intensity (au) within cells was determined. In all the cases, the control group was considered as the 100% reference. The results are expressed as mean ± SEM, n=3–5 per group. Data from graph (A) were analyzed by one-way ANOVA, whereas (B–D) were analyzed by the Student’s t-test, *P<0.05 vs control.
Abbreviations: LDL, low-density lipoprotein; HBSS, Hank’s balanced salt solution; SEM, standard error of the mean; ANOVA, analysis of variance.
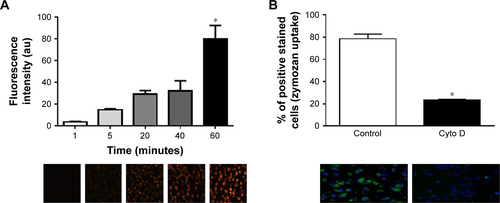
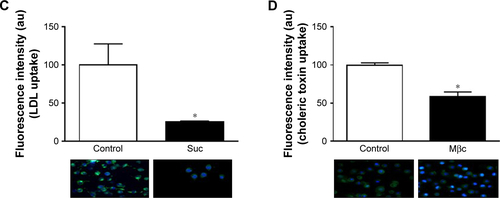
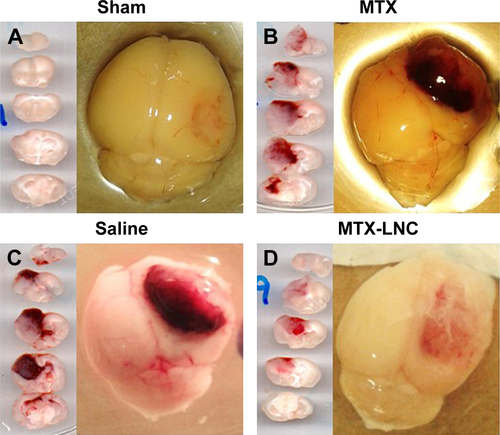
Figure S3 Representative images of mice brain segments: (A) sham-group; glioblastoma-carrying mice treated with MTX solution (B), saline (C), or MTX-LNC (D) for 10 days, in alternated days, by the oral route.
Abbreviations: MTX, methotrexate; MTX-LNC, methotrexate-loaded lipid-core nanocapsules.
Acknowledgments
The authors thank Fundação de Amparo à Pesquisa do Estado de São Paulo (S.H.P.F. FAPESP – grant no. 2014/07328-4) and Fundação de Amparo à Pesquisa do Estado de Rio Grande do Sul (FAPERGS) for financial support to this study; Conselho Nacional de Desenvolvimento Científico e Tecnológico (CNPq) for Master fellow support to Natália Rubio Claret Pereira and also for financial support to this study (Universal 470895/2011-0); and Coordenação de Aperfeiçoamento de Pessoal de Nível Superior (CAPES) for the post-doctoral fellowship to Rodrigo Azevedo Loiola. Stephen Fernandes Rodrigues was a recipient of a postdoctoral fellowship from FAPESP (2011/02438-8). Adriana R Pohlmann, Silvia S Guterres, and Sandra H Farsky are researcher fellows of CNPq. We are grateful to Willian Prado, MSc for the synthesis of rhodamine B-LNC conjugates.
Author contributions
NRCP conducted in vivo assays; RAL conducted in vitro assays and contributed to manuscript writing; SFR undertook intravital microscopy experiments; CPO and SLB prepared and analyzed methotrexate-loaded lipid-core nanocapsules (MTX-LNC); SSG and ARP designed and developed MTX-LNC; SHF conceived this study and wrote the manuscript. All authors contributed substantially to data acquisition/analysis and drafting and/or critically revising the paper, and agree to be accountable for all aspects of the work.
Disclosure
The authors report no conflicts of interest in this work.