
Abstract
Background
Islet cell transplantation is one of the key treatments for type 1 diabetes. Understanding the mechanisms of insulin fusion and exocytosis are of utmost importance for the improvement of the current islet cell transplantation and treatment of diabetes. These phenomena have not been fully evaluated due either to the lack of proper dynamic imaging, or the lack of proper cell preservation during imaging at nanoscales.
Methods
By maintaining the native environment of pancreatic β-cells between two graphene monolayer sheets, we were able to monitor the subcellular events using in situ graphene liquid cell (GLC)-transmission electron microscopy (TEM) with both high temporal and high spatial resolution.
Results
For the first time, the nucleation and growth of insulin particles until the later stages of fusion were imaged at nanometer scales. The release of insulin from plasma membrane involves the degradation of plasma membrane and drastic reductions in the shorter axis of the insulin particles. Sequential exocytosis results indicated the nucleation, growth and attachment of the new insulin particles to the already anchored ones, which is thermodynamically favorable due to the reduction in total surface, further reducing the Gibbs free energy. The retraction of the already anchored insulin toward the cell is also monitored for the first time live at nanoscale resolution.
Conclusion
Investigation of insulin granule dynamics in β-cells can be investigated via GLC-TEM. Our findings with this technology open new realms for the development of novel drugs on pathological pancreatic β-cells, because this approach facilitates observing the effects of the stimuli on the live cells and insulin granules.
Introduction
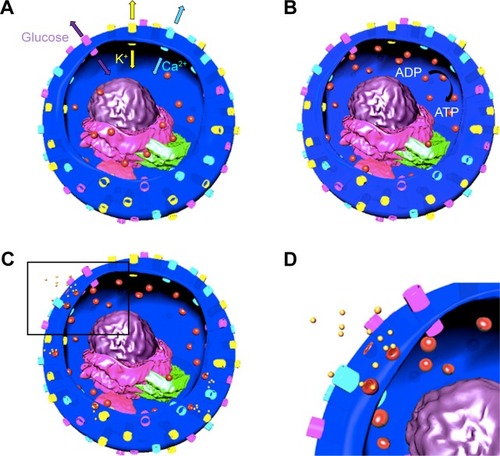
While most of the pancreas is composed of exocrine cells for food digestion, endocrine cells are responsible for the release of insulin and glucagon hormones to the blood stream for the regulation of blood sugar.Citation1 Endocrine cells also have delta cells in islets are composed of α- and β-cells producing glucagon and insulin, respectively.Citation2 β-cell is the key factor in insulin secretion, which lowers blood glucose levels.Citation3 Insulin secretion happens by the entrance of glucose to the β-cells (), which triggers conversion of ADP to ATP ().Citation4 Furthermore, this closes the potassium channel, causing membrane depolarization that leads to the opening of the calcium channel and the increase of calcium concentration inside the cell.Citation4 This process results in fusion of insulin granules and insulin exocytosis (). Basically, type 1 diabetes is the destruction of insulin-producing cells by the immune system, resulting in a lack of insulin in the body.Citation5 Type 2 diabetes is the improper usage of insulin by the pancreas, causing insulin deficiency.Citation6
Figure 1 Schematics depicting fusion and exocytosis process of insulin granules.
Notes: Channels: yellow: K, light purple: glucose, blue: Ca; organelles: light purple: endoplasmic reticulum, dark purple: nucleus, green: Golgi apparatus, pink: mitochondria, particles: red: insulin granules and yellow: secreted insulin. (A) Glucose and K channels are opened and Ca channel is closed. (B) Glucose enters the cell and ADP is converted to ATP, K channel is closed and Ca channel is opened. Insulin granules move toward the plasma membrane. (C) Insulin granules dock to plasma membrane and release insulin. (D) Inset of the black rectangle shown in (C).
There are four different modes of exocytosis reported, spanning full fusion, kiss-and-run, sequential, and multivesicular, where full fusion, reportedly, is the most frequent insulin secretion process (92%).Citation7 This led to investigating subcellular activities of live β-cells using live imaging.Citation8,Citation9 Membrane capacitance measurement was used to estimate granule diameters and fusion pore properties.Citation10,Citation11 However, it is difficult to distinguish concurrent exocytosis, to detect interaction between endocytosis and exocytosis, or to discriminate between fusion and actual release insulin. Another technique used was fiber amperometry, which monitors exocytosis by first introducing serotonin, where then the insulin granules will be taken up.Citation12 Then, the electrode detects serotonin that is co-released with insulin;Citation12 however, it only measures content release, not fusion event.Citation13 Furthermore, there is variability of the results between cells due to the uneven uptake of serotonin,Citation14 and serotonin can be toxic to β-cells.Citation15 Another technique used is total internal reflectance fluorescent (TIRF) microscopy, which significantly increases sensitivity and spatial resolution reaching 100 nm with time-lapse visualization for insulin granule dynamics. Due to their limited penetration, docking or fusion events are often much less quantified, and compound exocytosis is often undetectable.Citation16,Citation17 Ohara-Imaizumi et al used TIRF to study the functions of t-SNAREs (soluble NSF attachment protein receptor) in docking and fusion of insulin granules in physiological β-cells, and compared them to diabetic β-cells.Citation18,Citation19 However, when using TIRF, kiss-and-run exocytosis is more commonly seen,Citation20 whereas in confocal microscopy, full fusion is mainly seen.Citation21,Citation22 This discrepancy is due to the fact that when using TIRF, the cell is in contact with the glass cover slip, and this may cause the process of exocytosis to differ significantly.Citation21 Two-photon extracellular polar tracer imaging with sulforhodamine B and FM1-43 allows for better estimation of granule diameter and tracking of vesicle after exocytosis. However, it often causes observational bias for a subset of granules that are not well labeled. In addition, such labeling often causes changes in secretion kinetics.Citation23,Citation24 Finally, confocal microscopy has been used to study regulation and movement of insulin granules, the effect of different chemicals on insulin granule size and trafficking, and analysis of various components in the β-cells that are involved in the insulin secretion process.Citation25–Citation27 However, this method relies on fluorescence labeling, which has several disadvantages including toxicityCitation28 and photobleaching.Citation29
Electron microscopy (EM) has been widely used to study the structure of β-cells, specifically for the comparison of insulin granules in physiological β-cells and diabetic β-cells.Citation30,Citation31 Studies were carried out mainly to locate, visualize, and measure the size of the insulin and glucagon secreting granules.Citation32–Citation34 In a recent work carried out by Pfeifer et al, 3D reconstruction of islets were carried out by removing thin sections of the conventionally fixed samples via a microtome, which is housed in the scanning electron microscope (SEM). Three-dimensional tomography was conducted by serial imaging of the block face via SEM, which exhibits the distribution of the insulin granules.Citation35 Correlative light and electron microscopy studies were carried out to investigate islets without dissociating them with the self-labeling proteins on Tokuyasu sections via high pressure freezing, freeze substitution, OsO4 staining and Epon embedding, which prevents some of the drawbacks of the conventional fluorescence staining after conventional fixation and embedding.Citation36 Current EM observations of β-cells have been limited to cryogenic techniques that prevent monitoring of dynamic phenomena within these cells.Citation37 The ambiguity surrounding insulin granule exocytosis and other characteristics of insulin granules calls for EM techniques with the ability to monitor such events in native environment. Recent development in liquid-cell transmission electron microscopy (TEM) imaging has provided new opportunities to study biological structures at unprecedented resolutions by which whole cells or granules can be encapsulated between two electron transparent windows with a hermetical seal, which is achieved by using either thick silicon nitride (SiN) or thin graphene monolayers. Imaging samples in liquid state via SiN windows has an advantage where liquids can be delivered while imaging, but the extra thickness of the two SiN windows deteriorates the imaging resolution. This technique has been used frequently to observe the growth mechanism of nanoparticles,Citation38–Citation42 nanostructures,Citation43 and metal-organic frameworks.Citation44 Woehl et al used in situ liquid TEM to image Magnetospirillum magneticum to determine the effects of the radiation caused by the electron beam on the live bacteria.Citation45 They were able to verify that the bacteria did not undergo drastic radiation damage and stayed viable mostly during electron imaging. Kennedy et al conducted a similar experiment, but with Escherichia coli and bacteriophages, and saw similar results where they were able to determine the average dose of electrons that is needed to damage the bacteria.Citation46 In numerous studies, visualization of fibroblast cells labeled with epidermal growth factor conjugated gold nanoparticles were carried out, and the penetration of gold nanoparticles on the surface of the cell was visualized.Citation47–Citation49 These all had the drawback of low imaging resolution due to the excessive thickness of SiN. Graphene liquid cell (GLC)-TEM imaging was introduced very recently during which liquid samples are encapsulated between two monolayers of electron transparent, strong and biocompatible graphene sheets.Citation50–Citation52 These graphene sheets stay closed due to the van der Waals forces.Citation53 All these properties of GLC sample preparation make it perfect for our needs, which are keeping the cells viable and obtaining high imaging resolution. Several works have previously been reported with this technique. Mohanty et al reported the encapsulation of Bacillus subtilis bacteria in between a graphene sandwich and carried out TEM imaging.Citation54 Yuk et al reported the growth of platinum nanocrystals via coalescence using this imaging technique.Citation55 Wang et al used this technique to understand the crystal structure and chemistry information of ferritins.Citation56 Wang, Shokuhfar and Klie demonstrated that nanoscale chemical reactors can be created inside GLCs and the rate of the hydrogen molecule formation can be monitored.Citation57 Park et al also developed a hybrid method using GLC-TEM and single particle reconstruction, and reported the 3D structure of individual platinum nanoparticles in liquid state, which, without the usage of GLCs, would require collection of images of many individual particles for reconstruction.Citation58 Furthermore, Park et al used GLCs to image the structures of influenza viruses, during which they were able to obtain high resolution images of the viruses and visualize the cytoskeleton structure, exhibiting the native state whole cell imaging capability of GLCs.Citation59
Although the overall mechanism of how β-cells secrete insulin at high blood glucose level is well established and described earlier,Citation60 it needs to be further unfolded using nanoscale electron imaging so that the reasons why some β-cells secrete insulin while others do not in different environments can be understood. This aforementioned resolution during imaging is of utmost importance and with the recent ongoing advancements in electron optics and sample preparation techniques, more detailed visualization of the subcellular details is possible. Until our wok, monitoring dynamics of insulin granules to aid the detailed assessment of β-cell function with nanoscale imaging resolution has been unachievable with the current conventional approaches due to the lack of both keeping the sample in its native state and using high resolution liquid EM imaging. Therefore, to study insulin granules at high resolution, we used TEM imaging via GLC sample preparation technique and reported the insulin granule fusion and exocytosis. Presence of water in between graphene layers around insulin particles is verified via spatially resolved electron energy loss spectroscopy (EELS) and energy dispersive X-ray spectroscopy (EDS). Viability of the β-cells is monitored before and after GLC-TEM imaging to evaluate the feasibility of this technique on cells. Understanding the physiological structure and subcellular dynamics of pancreatic islet cells in this research, and comparing them with the pathogeny to understand the causes of the dysfunctionalities as a future goal will facilitate the development of more effective drug and therapeutic treatments for diabetes.
Materials and methods
Cells and chemicals
MIN6 β-cells were used for GLC-TEM imaging. We obtained MIN6 cells from Louis Philipson (University of Chicago)Citation61 (originally from Jun-Ichi Miyazaki).Citation62
MIN6 cell culture and preparation
MIN6 cells in the active phase of growth were cloned by the dilution plating technique. The effect of increased passage on the insulin secretion dynamics was evaluated earlier by O’Driscoll et al.Citation63 They compared MIN6 cells with passage #18 and passage #40 and they reported that the cells which underwent low passage exhibited five- to sixfold increased insulin secretion when the glucose stimulus was in the range of 0–26.7 mmol/L. Therefore, in our work, we tried to keep the passage low, similar to the passage reported in O’Driscoll et al.Citation63 Many times experimentation was carried out and 15 to 20 cell passages were executed. Cells were detached with trypsin in Dulbecco’s phosphate buffered saline without Ca2+ and Mg2+, and then resuspended in DMEM, 1X+ GlutaMAX™-I with the addition of 10% FBS, antibiotics (100 U/mL penicillin and 100 µg/mL streptomycin) (Ab), 25 mM HEPES, and 285 µM 2-mercaptoethanol. The cell suspension was aspirated gently with care, to avoid separating the cells into a single-cell suspension. Following this, the cells were centrifuged at 1,000 rpm for 5 minutes, resuspended in prewarmed culture medium, counted, and diluted to a concentration of 100 cells/µL in Krebs–Ringer buffer (with 2 mM glucose). Buffer solutions were prepared by adding 20 mM HEPES, 5 mM KH2PO4, 1 mM MgSO3, 1 mM CaCl2, 136 mM NaCl, 4.7 mM KCl, and adjusted to a pH of 7.4. For high KCl stimulation experiments, we adjusted the final concentration with 30 mM KCl.
Cell live/dead testing
Live/dead assay of the cells was determined by 1) cell counter by adding 10 µL trypan blue solution 0.4% (ThermoFisher Scientific, Waltham, MA, USA) to 10 µL cell culture, and by (2) fluorescence microscopy by adding 10 µL of 0.46 µM fluorescein diacetate (ThermoFisher Scientific) for counting the live cells and 5 µL of 14.34 µM propidium iodide (ThermoFisher Scientific) to 100 µL cell culture for counting the dead cells. Direct reading of percent viable cells from cell counter was obtained. For fluorescence imaging, Olympus BX51/IX70 and Leica M165 FC fitted with Leica DFC420 C cameras were used with acquisition times of 0.1–1 seconds.
GLC sample preparation
The dissociated β-cells were used for investigating insulin granule characteristics by GLC-TEM. In brief, 1 µL of cells (100 cells/µL) in Krebs–Ringer buffer was loaded into graphene coated TEM grids (2,000 meshes) with single layer of graphene deposited on it via chemical vapor deposition (Graphene Supermarket; Graphene Laboratories Inc., Calverton, NY, USA). Sample was dipped onto the floating monolayer of graphene, creating the GLC as discussed by Wang et al.Citation56
TEM imaging, STEM imaging, STEM EELS and STEM EDS
TEM imaging was carried out via JEOL 1220 or Hitachi HT7700. Scanning transmission electron microscopy (STEM) imaging, spatially resolved EDS and EELS were conducted via Hitachi HD2300, respectively. For low loss EELS, 0.1 eV/channel dispersion was used. Microscopes were operated at a low energy of 80 keV to minimize electron beam damage to the cells. Graphene itself further protected the cells from beam damage by minimizing the radicals and conducting the electrons. During the course of the TEM imaging (0.1 seconds exposure for video recording), electron dose was kept lower than 100 e/nm2, which was discussed earlier by de Jonge and Ross.Citation64 The dose values are estimates based on experiments performed by Hitachi HT7700. For STEM imaging, the electron dose was kept lower than the critical dose reported by Kennedy et al.Citation65 During TEM imaging, both high and low magnification imaging were carried out on most of the cells on the grids, with the main aim of keeping the cells intact in the vacuum environment.
Data analysis and statistics
Image acquisition was carried out via Digital Micrograph 2.11.1404.0. During video recording for Supplementary Videos S1, S2 and S3, 30 fps was used, which is high enough to visualize clearly the trajectories of the particles.
Results and discussion
Encapsulation of β-cells in GLCs
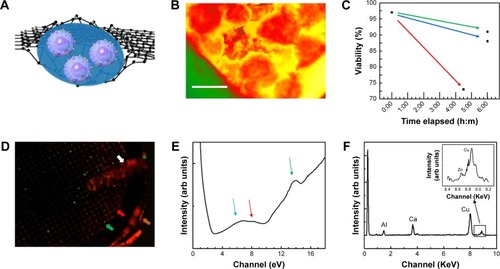
GLC-TEM imaging facilitates imaging of the cells and secreted granules in the smallest liquid capsule in the TEM. Cells were encapsulated between two graphene monolayers with 100 cells/µL concentration (). Individual β-cells are shown in the high-angle annular dark field (HAADF)-STEM image in . This image is in great harmony with the 3D tomography image reported by Pfeifer et al.Citation35 The intracellular structures were not as visible as in the cryofixed or conventionally fixed counterparts because the cells in those cases were fixed, stained and ultramicrotomed to a thickness less than 100 nm, reducing the electron scattering, thus increasing the imaging resolution, while in this work, whole cell imaging was carried out with no fixation and ultramicrotomy.
Figure 2 (A) β-cells are in KR2 low glucose medium encapsulated in graphene liquid cells. Cells are hermetically sealed between two biocompatible monolayers of graphene by the van der Waals forces. (B) False colored HAADF-STEM image of β-cells located in GLC sample. Red, β-cell; yellow, cell medium; green, copper mesh on TEM grid. Excessive thickness of the cells makes the intracellular structural details less visible. Scale bar: 10 µm. (C) Cell viability was tested via cell counter and reported as 1) no added fluorescence stain at t=0; 2) after keeping the cells as unstained (t: 6 hours); 3) as stained (t: 6 hours); and 4) after being imaged for 2 hours via GLC-TEM and was reported as 97, 91, 88% and 73% viable, respectively. (D) Cells were stained and imaged via GLC-TEM and the effect of GLC-TEM imaging was tested. Fluorescence microscopy image showed 73 green and 27 red cells, exhibiting 73% cell viability at t: 6 hours. Orange, white, green and red arrows show TEM grid, tweezer, live and dead cells, respectively. (E) Low loss EELS data show the presence of water optical gap at 6.9 eV, water exciton peak at 8.5 eV and graphene σ+π bond at 14 eV shown with blue, red and green arrows, respectively. These show encapsulations in between graphene and the presence of water. (F) The EDS data on secreted insulin granules indicated the presence of calcium and very low amounts of zinc, which are fingerprints for secreted insulin granules.
Abbreviations: arb, arbitrary; HAADF-STEM, high-angle annular dark field-scanning transmission electron microscopy; GLC, graphene liquid cell; TEM, transmission electron microscopy; EELS, electron energy loss spectroscopy; EDS, energy dispersive X-ray spectroscopy.
Effect of GLC encapsulation on the β-cell viability
One of the advantages of GLC-S/TEM is to protect the cells from the vacuum environment due to the strong graphene layers. GLC-TEM imaging has also been reported to be a very significant tool for the characterization of Madin–Darby canine kidney epithelial cells and it was proven that the cells were still viable in the correlative fluorescence microscopy imaging after the TEM study.Citation59 The other advantage is that graphene is electron transparent, which means that the radiolysis effect due to the electron charge build-up is at a minimum. Radiolysis of the water-based cell medium would create radiolysis by-products including hydroxyl radicals and hydrogen peroxide, which furthermore might interact with the cells and create oxidative stress, respectively.Citation66,Citation67 This may result in cell death. To test how the viability of the cells change during GLC-TEM imaging, cells were removed from the incubator at t: 0 seconds, stained with trypan blue and checked for viability via cell counter, which reported that cells were 97% alive. Another set of cells from the same batch was stained with fluorescein diacetate and propidium iodide for fluorescence imaging. After 6 hours with no electron microscopy, the cells were reported to be 88% and 91% viable with and without fluorescence stain, respectively. This showed that on the bench, with the assumption of linear rate of cell viability loss, viability drops 1% per hour and if stained for fluorescence, additional loss of 0.5% per hour was monitored. Furthermore, to check the viability change via GLC-TEM, cells were encapsulated in GLC and examined for 2 hours with an electron microscope. By interpolating the viability from the cell counter, when the GLC was prepared, viability was 97% (1.5% per hour ×2 hours) =94%. After 2 hours of TEM imaging, with 1.5% per hour viability loss, 3% viability loss was also expected due to the both nature of the cells and the effect of stain, making them 91% viable (). Via fluorescence imaging, the cell viability after 2 hours of GLC-TEM imaging was reported to be 73%, making the viability loss due to GLC-TEM imaging 91–73=18%, with respect to the total number of the cells in the starting batch (). This verifies that the cells remain mostly viable when encapsulated in GLC and imaged in TEM for at least 2 hours. We should also add that further work should be performed to fully asses if the cells are alive during TEM imaging in graphene liquid cells. There is always high chance for artifacts in liquid cell systems under electron beam that may lead to improper interpretation. We noticed that success rate of our experiments is quite low which points to the lack of proper control on keeping the cells alive during TEM imaging in GLC. We encourage the scientific community to perform such experiments with proper cross checking with other characterization techniques.
Verification of the presence of water, graphene and insulin
Low loss EEL spectrum was collected from secreted insulin granules and reported in . For the investigation of the presence of water, carrying out EELS analysis on β-cell will not be informative due to the excessive thickness of the cells, which is around 5–8 µm. Thus, the analysis was carried out on relatively smaller secreted insulin granules in the cell medium. The blue, red and green arrows at 6.9, 8.5 and 14 eV show water optical gap,Citation68 water excitonCitation69 and σ+π bond for graphene.Citation69 These are indications of the proper preservation of the samples, that is, samples are encapsulated in graphene and have liquid. Investigation of oxygen K edge in EELS was avoided since the source of oxygen in the GLC sample can be any constituent of the buffer, not limited to water. Insulin is also known to show fingerprints of calcium and zinc before secretion.Citation70 shows the EDS data collected from secreted insulin granules, which indicate the presence of calcium and very low amounts of zinc, which was consistent with an earlier study by Li,Citation71 confirming the release of zinc after the secretion of insulin. Calcium and zinc can be also used as an identification marker for insulin granules residing in the β-cell and for potential quantification of zinc, calcium, or other element homeostasis and insulin maturation. But after the secretion, negligible zinc was observed in these particles. Furthermore, the copper signal was due to the copper grid and aluminum from the grid locking mechanism of the holder.
Fusion and exocytosis events
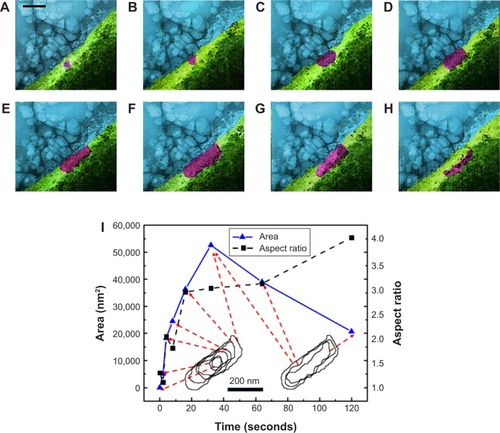
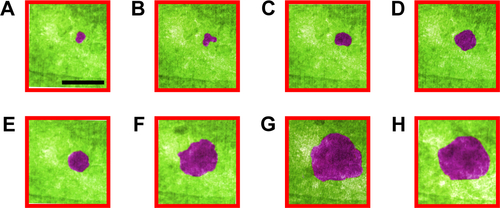
β-cells have four modes of insulin granule fusion. In full fusion (92% of total exocytosis), a granule completely fuses with the plasma membrane (PM) forming an omega structure.Citation7 We have successfully imaged and recoded, with nanoscale resolution, the dynamics of insulin fusion and exocytosis in real-time as shown in . Formation and docking of insulin granule outside the PM and release of the insulin are shown as false colored TEM images in . Furthermore, shows the morphology and size change during this full fusion process. shows the proximity of the PM at t: 0 seconds. Initially, there is a small insulin granule by the PM with a size of 52 by 68 nm with an aspect ratio of 1.3. Furthermore, the presence of bubbles in the liquid area shows the presence of liquid, specifically, the formation of hydrogen molecule bubbles due to the electron beam induced radiolysis in the liquid.Citation72 show the time sequences of t: 2, 4, 6, 8 and 32 seconds, exhibiting the growth of insulin particle. shows the fully grown particle to a size of 130 by 388 nm with an aspect ratio of 3. In addition to the size of the particle, the aspect ratio also increases, but until t: 16 seconds, after which it stays constant and slightly increases until t: 64 seconds and afterward increases drastically. The granule, initially shaped as a sphere, transforms into an imperfect rectangle following docking on the PM in an omega shape (Ω). This shape transformation is affected by the PM, where if the PM was not there, these particles might have been grown to spherical shape similar to the initial shape of these particles. This trend in the shape transformation is traditional for the insulin undergoing full fusion. After t: 60 seconds (), the granule is retrieved, fusion pores open and as time passes (t: 120 seconds) insulin is released (). The further increase in the aspect ratio with more drastic shrinkage in shorter axis compared to longer axis might be an indication of the insulin release in parallel direction with the short axis that is perpendicular to PM, which is anticipated through the basis of insulin fusion as well. Another example of full fusion is also reported in .
Figure 3 (A–H) False colored TEM images from Supplementary video S1 recorded for full fusion.
Notes: Blue, cell medium; purple, insulin; green, cell. (A) Cell, cell medium and a small insulin particle are shown at t: 0 seconds. (B–F) show the time sequences of t: 2, 4, 6, 8, 16, and 32 seconds. Insulin granule grows to its full size. Aspect ratio increases until t: 16 seconds and stays the same until t: 64 seconds. (F) (t: 32 seconds). Fully grown particle is visible. Particle formation and following docking on the membrane in an omega shape (Ω) were known to be typical for these particles. (G) Retrieval of the granule (t: 60 seconds) and (H) (t: 120 seconds). Release of insulin was observed with aspect ratio further increasing. (I) Insulin granule morphology, size and aspect ratio change during full fusion. Scale bar: 200 nm; magnification 300,000×.
Abbreviation: TEM, transmission electron microscopy.
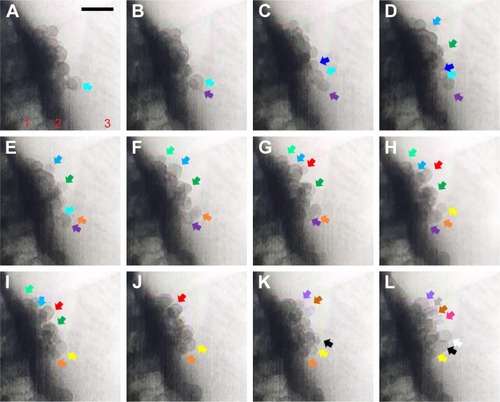
An insulin granule undergoing kiss-and-run exocytosis transiently fuses with the PM and subsequently moves away. The transient and narrow fusion pore often indicates as a failure of insulin secretion. In multivesicular exocytosis, several granules are fused together, leading to a robust and abrupt insulin release that brings risk of hypoglycemia. In sequential exocytosis, a granule fuses with another granule that is already fused with the PM, in which exocytosis sites move into the internal area designated for exocytosis.Citation7 The TEM images in show the sequence of sequential exocytosis. Individual insulin particles are observed to attach onto the top of the anchored initial particles first, and afterward, these particles approach each other and further toward PM. In , at t: 0 seconds, one of the insulin particles is marked with cyan arrow. Following this, attachment of new particles is designated with additional colors throughout a 0.5–5 second time interval. Comparing the positions of the particles in (t-0 seconds) with (t-0.5 seconds), the particles with cyan arrow in 4D, dark green arrow in and yellow arrow in moved toward PM, which is expected in sequential exocytosis. In , at t: 2 seconds, the insulin particles with light blue and dark green arrows and in , at t: 3 seconds, insulin particles with orange and purple arrows are observed to attract toward each other. This attraction, along with the attachment of the new ones to the already anchored ones, is thermodynamically favorable due to the fact the total surface area will be reduced, which will further reduce the Gibbs free energy. The observed sequential exocytosis here also matches with the relatively lower resolution video recorded by two-photon excitation microscopy by Takahashi et al.Citation73
Figure 4 (A–L) TEM images from Supplementary video S2 recorded for sequential exocytosis with 0.5-second intervals. Region 1: cell, region 2: plasma membrane, region 3: cell medium. At t: 0 seconds, insulin particle with cyan arrow is shown (A). Formation and attachment of one new granule to the already anchored insulin is shown with purple arrow at t: 0.5 seconds (B), with dark blue arrow at t: 1 seconds (C), with light blue and dark green arrows at t: 1.5 seconds (D), with light green arrow at t: 2 seconds (E), with orange arrow grows at t: 2.5 seconds (F), red arrow at t: 3 seconds (G), yellow arrows at t: 3.5 seconds (H), at t: 4 seconds (I), at t: 4.5 seconds (J), with black, purple and brown arrows at t: 5 seconds (K), white, gray and pink arrows at t: 5.5 seconds (L). Attraction of these particles toward themselves (E) and retrieval of these granules by time toward PM is monitored as well. Scale bar: 200 nm.
Abbreviations: TEM, transmission electron microscopy; PM, plasma membrane.
The observed full fusion and sequential exocytosis are similar with respect to the ones reported by Takahashi and KasaiCitation7 and Takahashi et al.Citation73 The EDS characterization in conjunction to similar particle size also confirmed that the particles released are insulin. Kennedy et alCitation65 was able to monitor the cellular functions by the expression of green fluorescing protein-GFP-LVA by Escherichia coli in the electron microscope. We used an electron dose that is tolerant for the live cell imaging. Furthermore, graphene is 1) impermeable to ion flow, so the liquid medium cannot leak from the graphene cell, and thus prevents the cell drying; 2) electron transparent, so electrons do not accumulate on the sample, preventing electron charging induced damage; 3) thin (~1–2 nm) due to its monolayer nature compared to thicker Si3N4 windows (~30–100 nm) used in earlier works, therefore, formation of secondary electrons is in a lower extent, thus less radiation damage; and 4) a radical scavenger, continuously removing the radiolysis by-products. In addition to these advantageous features of graphene, the electron doses used in this work are within the limits of live cell imaging, and in addition to the cell viability test with fluorescence imaging, similar to the experimentation by Kennedy et al,Citation65 cellular function specific to the β-cell under consideration, that is insulin secretion, was monitored.Citation65 Furthermore, the authors did not observe insulin secretion in many of the cells they monitored. Reasons for this could be either the particular cell under observation is not viable or the local glucose concentration in the given graphene pocket is not enough for the initiation of the insulin secretion.
For metabolic activity tests reported in the literature, the KR2 buffer contained 2×10⁶ cells/mL, which has 0.002M (mol/L) or 2×10⁻⁶ mol/mL glucose concentration.Citation74 Similar glucose concentration in the buffer was reported by Llanos et alCitation75 and Hays et al.Citation76 So, the total glucose one cell faces is 10−12 mol. However, in this work, the authors used 100 cells/µL, which is 105 cells/mL. Therefore, the total glucose of 0.002M (2×10⁻⁶ mol/mL) was received by 105 cells/mL. This translates to (2×10⁻⁶ mol/mL/1×105 cells/mL) 2×10⁻¹¹ mol/cell, which is 20 times higher than the one used by Bernard et al.Citation74 This amount of glucose is high enough for insulin secretion. We also observed the full fusion process rarely, even though it is the most common mode of insulin secretion. However, this local high glucose concentration helped with the observation of a few full fusion processes. For future studies to investigate the insulin secretion under varying glucose concentrations, KR buffer will be prepared with higher glucose concentrations.
Many experimentations have been carried out to monitor these insulin secretion events; however, only a few were very successful in imaging insulin secretion (). Considering that TEM provides local information about the specimens and is most suited for understanding the mechanisms, we suggest more experimentation should be carried out to further verify these results. Furthermore, even though appropriate glucose concentrations including KR2 to KR50 were used, tightly wrapping of cells between the graphene monolayers yields little amount of liquid wrapped with the cell itself in the graphene capsules, which may not always be high enough for monitoring glucose-induced insulin secretion events. The inability to monitor high numbers of insulin secretion events due to these reasons also hinders monitoring the other types of insulin secretion, namely kiss-and-run and multivesicular exocytosis in addition to the monitored full fusion and sequential exocytosis. Additional tests with microfluidic TEM cells should be pursued in addition to the GLC-TEM studies conducted here.
Even though GLC is advantageous over the Si3N4 based liquid cell TEM holders due to the addition of a few layers of graphene instead of thicker Si3N4 membranes, which deteriorate imaging resolution, formation of individual graphene sandwiches happens due to the adhesion of two monolayers of graphene via the van der Waals forces between two graphene layers. Hence, an individual cell is wrapped in isolated capsules of graphene sandwiches, hindering the interaction of multiple cells. However, due to the nature of the Si3N4 based liquid cell TEM holders, multiple cells could be enclosed in Si3N4 enclosure and the interaction of cells in the cell medium could be monitored.
Conclusion
In this work we reported a direct investigation of insulin granule dynamics in β-cells, which is highly critical for diabetes research. Utilizing GLC-TEM, β-cells were first encapsulated between monolayers of graphene. Verification of cell intactness and the presence of water in graphene sandwich confirmed the feasibility of technique for the cell imaging. Afterward, the insulin granule full fusion and the relatively rare sequential exocytosis were reported for the first time with nanoscale resolution. At the later stages of insulin secretion through full fusion, the aspect ratio of the insulin granule remained high and increasing further, which indicates the release of insulin in perpendicular direction to the PM. Retraction of the anchored insulin granules toward the PM was monitored during sequential exocytosis for the first time with nanoscale resolution as well. The present findings provide an indispensable tool for type 1 and 2 diabetic researchers to monitor the insulin granule dynamics at very small scales. This can open up new opportunities to investigate the effect of chemical stimuli and immunosuppressive drugs on insulin secretion. However, due to low success rate of our experiments and possibility for artifacts, we believe additional characterization and studies should be followed to fully assess if the cells remain to be alive during TEM imaging.
Author contributions
EF, JO, and TS conceived the idea. EF performed GLC-TEM imaging and analysis. MO participated in imaging experiments. YX, DL, AC and YH provided the cells. EF and YH carried out cell viability tests. LC and BS draw schematics. Manuscript was written by EF, MO, LC, BS, RSY, YW, JO and TS. All authors contributed to data analysis, drafting and revising the article, gave final approval of the version to be published, and agree to be accountable for all aspects of the work.
Acknowledgments
TEM imaging work made use of instruments in the Electron Microscopy Service (Research Resources Center, UIC). STEM imaging, STEM-EDS and STEM-EELS work made use of the EPIC facility of Northwestern University Atomic and Nanoscale Characterization Experimental Center, which has received support from the Soft and Hybrid Nanotechnology Experimental (SHyNE) Resource (NSF ECCS-1542205); the MRSEC program (NSF DMR-1121262) at the Materials Research Center; the International Institute for Nanotechnology (IIN); the Keck Foundation; and the State of Illinois, through the IIN. T Shokuhfar is grateful to the National Science Foundation, CAREER award DMR-1564950, for providing partial financial support. R Shahbazian-Yassar acknowledges the financial support from NSF-DMR Award number 1710049. J Oberholzer acknowledges the financial support from NIH/NIDDK R01 DK091526. The authors are grateful to Shayan Shafiee for his contributions and for attending experiments.
Supplementary material
Figure S1 (A–H) False colored TEM images from Supplementary video 3 recorded for full fusion. Growth of insulin was reported at t: 0, 2, 4, 8, 16, 32, 64 and 120 seconds. Scale bar: 200 nm.
Abbreviation: TEM, transmission electron microscopy.
Disclosure
The authors report no conflicts of interest in this work.
References
- RöderPVWuBLiuYHanWPancreatic regulation of glucose homeostasisExp Mol Med2016483e21926964835
- ChandraRLiddleRANeural and hormonal regulation of pancreatic secretionCurr Opin Gastroenterol200925544144619535978
- GarrettWEKirkendallDTExercise and sport science Lippincott Williams & Wilkins2000 Available from: https://books.google.com/books?id=Cx22TcXodrwCAccessed October 23, 2018
- FridlyandLEJacobsonDAPhilipsonLHIon channels and regulation of insulin secretion in human β-cells: a computational systems analysisIslets20135111523624892
- TangQDesaiTAApproaching a cure for type 1 diabetesNat Med201622323623726937617
- WillemsenGWardKJBellCGThe concordance and heritability of type 2 diabetes in 34,166 twin pairs from international twin registers: The discordant twin (DISCOTWIN) consortiumTwin Res Hum Genet201518676277126678054
- TakahashiNKasaiHTwo-photon excitation imaging of insulin exocytosisSeinoSBellGIPancreatic Beta Cell in Health and DiseaseTokyoSpringer Japan2008195211
- Ohara-ImaizumiMNakamichiYTanakaTIshidaHNagamatsuSImaging exocytosis of single insulin secretory granules with evanescent wave microscopy: distinct behavior of granule motion in biphasic insulin releaseJ Biol Chem200227763805380811751926
- QianWJAspinwallCABattisteMAKennedyRTDetection of secretion from single pancreatic beta-cells using extracellular fluorogenic reactions and confocal fluorescence microscopyAnal Chem200072471171710701254
- HouJCLe MinJEPNIH Public AccessVitam Horm20098050647350619251047
- NeherEMartyADiscrete changes of cell membrane capacitance observed under conditions of enhanced secretion in bovine adrenal chromaffin cellsProc Natl Acad Sci U S A19827921671267166959149
- BokvistKHolmqvistMGromadaJRorsmanPCompound exocytosis in voltage-clamped mouse pancreatic β-cells revealed by carbon fibre amperometryPflügers Arch2000439563464510764224
- HuangLShenHAtkinsonMAKennedyRTDetection of exocytosis at individual pancreatic beta cells by amperometry at a chemically modified microelectrodeProc Natl Acad Sci U S A19959221960896127568182
- IslamMSThe Islets of Langerhans. PrefaceAdv Exp Med Biol2010654
- LeungYMSheuLKwanEWangGTsushimaRGaisanoHVisualization of sequential exocytosis in rat pancreatic islet beta cellsBiochem Biophys Res Commun2002292498098611944911
- NagamatsuSOhara-ImaizumiMNakamichiYTanakaTKatsutaHHitoshi Ishida And Shinya NagamatsuSociety2002807380
- YuanTLuJZhangJZhangYChenLSpatiotemporal detection and analysis of exocytosis reveal fusion “hotspots” organized by the cytoskeleton in endocrine cellsBiophys J2015108225126025606674
- Ohara-ImaizumiMNishiwakiCNakamichiYKikutaTNagaiSNagamatsuSCorrelation of syntaxin-1 and SNAP-25 clusters with docking and fusion of insulin granules analysed by total internal reflection fluorescence microscopyDiabetologia200447122200220715647897
- Ohara-ImaizumiMNishiwakiCKikutaTNagaiSNakamichiYNagamatsuSTIRF imaging of docking and fusion of single insulin granule motion in primary rat pancreatic beta-cells: different behaviour of granule motion between normal and Goto-Kakizaki diabetic rat beta-cellsBiochem J2004381Pt 1131815128287
- TsuboiTMcmahonHTRutterGAMechanisms of dense core vesicle recapture following “kiss and run” (“cavicapture”) exocytosis in insulin-secreting cellsJ Biol Chem200427945471154712415331588
- MaLBindokasVPKuznetsovADirect imaging shows that insulin granule exocytosis occurs by complete vesicle fusionProc Natl Acad Sci U S A2004101259266927115197259
- TakahashiNRecent progress in the research of insulin secretion imaging analysis of insulin secretion with two-photon microscopy2015385656662
- KasaiHHatakeyamaHOhnoMTakahashiNExocytosis in islet beta-cellsIslamMSThe Islets of LangerhansDordrechtSpringer Netherlands2010305338
- KasaiHKishimotoTNemotoTHatakeyamaHLiuTTTakahashiNTwo-photon excitation imaging of exocytosis and endocytosis and determination of their spatial organizationAdv Drug Deliv Rev200658785087716996640
- HaoMLiXRizzoMARocheleauJVDawantBMPistonDWRegulation of two insulin granule populations within the reserve pool by distinct calcium sourcesJ Cell Sci2005118Pt 245873588416317050
- BoganJSXuYHaoMCholesterol accumulation increases insulin granule size and impairs membrane traffickingTraffic201213111466148022889194
- ChengHBeckALaunayPTRPM4 controls insulin secretion in pancreatic beta-cellsCell Calcium2007411516116806463
- CrivatGTaraskaJWImaging proteins inside cells with fluorescent tagsTrends Biotechnol201230181621924508
- EttingerAWittmannTFluorescence live cell imagingMethods Cell Biol2014123779424974023
- MasiniMMarselliLBuglianiMUltrastructural morphometric analysis of insulin secretory granules in human type 2 diabetesActa Diabetol201249Suppl 1247252
- XueYZhaoWduWUltra-structural study of insulin granules in pancreatic β-cells of db/db mouse by scanning transmission electron microscopy tomographyProtein Cell20123752152522773341
- FavaEDehghanyJOuwendijkJNovel standards in the measurement of rat insulin granules combining electron microscopy, high-content image analysis and in silico modellingDiabetologia20125541013102322252472
- MantellJNamDBullDAchimAVerkadePA novel 2D and 3D method for automated insulin granule measurement and its application in assessing accepted preparation methods for electron microscopyJournal of Physics: Conference Series2014522012022
- CollinsSCdoHWHastoyBIncreased expression of the diabetes gene SOX4 reduces insulin secretion by impaired fusion pore expansionDiabetes20166571952196126993066
- PfeiferCRShomoronyAAronovaMAQuantitative analysis of mouse pancreatic islet architecture by serial block-face SEMJ Struct Biol20151891445225448885
- MüllerANeukamMIvanovaAA global approach for quantitative super resolution and electron microscopy on cryo and epoxy sections using self-labeling protein TagsSci Rep2017712328154417
- WuJSKimAMBleherRImaging and elemental mapping of biological specimens with a dual-EDS dedicated scanning transmission electron microscopeUltramicroscopy2013128243123500508
- AhnT-YHongS-PKimS-IKimY-WIn situ liquid-cell transmission electron microscopy for direct observation of concentration-dependent growth and dissolution of silver nanoparticlesRSC Adv201551008234282345
- EvansJEJungjohannKLBrowningNDArslanIControlled growth of nanoparticles from solution with in situ liquid transmission electron microscopyNano Lett20111172809281321619024
- QinFWangZWangZLAnomalous growth and coalescence dynamics of hybrid perovskite nanoparticles observed by liquid-cell transmission electron microscopyACS Nano20166b04234
- LiangW-IZhangXBustilloKIn situ study of spinel ferrite nanocrystal growth using liquid cell transmission electron microscopyChemistry of Materials2015272381468152
- ParentLRRobinsonDBWoehlTJDirect in situ observation of nanoparticle synthesis in a liquid crystal surfactant templateACS Nano2012643589359622439964
- ZhuGJiangYLinFIn situ study of the growth of two- dimensional palladium dendritic nanostructures using liquid-cell electron microscopyChem Commun201450679447
- PattersonJPAbellanPDennyMSObserving the growth of metal-organic frameworks by in situ liquid cell transmission electron microscopyJ Am Chem Soc2015137237322732826053504
- WoehlTJKashyapSFirlarECorrelative electron and fluorescence microscopy of magnetotactic bacteria in liquid: toward in vivo imagingSci Rep201441685425358460
- KennedyENelsonEMTanakaTDamianoJTimpGLive bacterial physiology visualized with 5 nm resolution using scanning transmission electron microscopyACS Nano20161022669267726811950
- de JongeNPeckysDBKremersGJPistonDWElectron microscopy of whole cells in liquid with nanometer resolutionProc Natl Acad Sci U S A200910672159216419164524
- PeckysDBVeithGMJoyDCde JongeNNanoscale imaging of whole cells using a liquid enclosure and a scanning transmission electron microscopePLoS One2009412e8214e821720020038
- PeckysDBde JongeNLiquid scanning transmission electron microscopy: imaging protein complexes in their native environment in whole eukaryotic cellsMicrosc Microanal201420234636524548636
- KimYDKimHChoYBright visible light emission from grapheneNat Nanotechnol201510867668126076467
- NairRRAnissimovaSZanRGraphene as a transparent conductive support for studying biological molecules by transmission electron microscopyIEEE Trans Inf Theory199339310571064
- HeoCYooJLeeSThe control of neural cell-to-cell interactions through non-contact electrical field stimulation using graphene electrodesBiomaterials2011321192720880583
- WarnerJHSchaffelFRummeliMBachmatiukAGraphene: Fundamentals and Emergent Applications: Elsevier Science2012 Available from: https://www.elsevier.com/books/graphene/warner/978-0-12-394593-8Accessed October 23, 2018
- MohantyNFahrenholtzMNagarajaABoyleDBerryVImpermeable graphenic encasement of bacteriaNano Lett20111131270127521271738
- YukJMParkJErciusPHigh-resolution EM of colloidal nano-crystal growth using graphene liquid cellsScience20123366077616422491849
- WangCQiaoQShokuhfarTKlieRFHigh-resolution electron microscopy and spectroscopy of ferritin in biocompatible graphene liquid cells and graphene sandwichesAdv Mater201426213410341424497051
- WangCShokuhfarTKlieRFPrecise In Situ Modulation of Local Liquid Chemistry via Electron Irradiation in Nanoreactors Based on Graphene Liquid CellsAdv Mater201628357716772227375052
- ParkJElmlundHErciusPNanoparticle imaging. 3D structure of individual nanocrystals in solution by electron microscopyScience20153496245290LP-295-295 Available from: http://science.sciencemag.org/content/349/6245/290.abstractAccessed October 23, 201826185247
- ParkJParkHErciusPDirect observation of wet biological samples by graphene liquid cell transmission electron microscopyNano Lett20151574737474426065925
- SchmitzORungbyJEdgeLJuhlCBOn high-frequency insulin oscillationsAgeing Res Rev20087430130518583199
- RajanSDicksonLMMathewEChronic hyperglycemia down-regulates GLP-1 receptor signaling in pancreatic β-cells via protein kinase AMol Metab20154426527625830090
- MiyazakiJArakiKYamatoEEstablishment of a pancreatic beta cell line that retains glucose-inducible insulin secretion: special reference to expression of glucose transporter isoformsEndocrinology199012711261322163307
- O’DriscollLGammellPMckiernanEPhenotypic and global gene expression profile changes between low passage and high passage MIN-6 cellsJ Endocrinol2006191366567617170223
- de JongeNRossFMElectron microscopy of specimens in liquidNat Nanotechnol201161169570422020120
- KennedyENelsonEMDamianoJTimpGGene expression in electron-beam-irradiated bacteria in reply to “live cell electron microscopy is probably impossible”ACS Nano20171113728114765
- Le CaërSWater Radiolysis: Influence of oxide surfaces on H2 production under ionizing radiationWater201131235253
- PerssonHLKurzTEatonJWBrunkUTRadiation-induced cell death: importance of lysosomal destabilizationBiochem J2005389Pt 387788415813701
- HoltzMEYuYGaoJAbruñaHDMullerDAIn situ electron energy-loss spectroscopy in liquidsMicrosc Microanal20131941027103523721691
- AronovaMASousaAALeapmanRDEELS characterization of radiolytic products in frozen samplesMicron201142325225621111626
- FosterMCLeapmanRDLiMXAtwaterIElemental composition of secretory granules in pancreatic islets of LangerhansBiophys J1993642525532 Available from: http://www.ncbi.nlm.nih.gov/pmc/articles/PMC1262355/Accessed October 23, 20188457676
- LiYVZinc and insulin in pancreatic beta-cellsEndocrine201445217818923979673
- GroganJMSchneiderNMRossFMBauHHBubble and pattern formation in liquid induced by an electron beamNano Lett201414135936424299122
- TakahashiNHatakeyamaHOkadoHSequential exocytosis of insulin granules is associated with redistribution of SNAP25J Cell Biol2004165225526215117968
- BernardABLinCCAnsethKSA microwell cell culture platform for the aggregation of pancreatic β-cellsTissue Eng Part C Methods201218858359222320435
- LlanosPContreras-FerratABarrientosGValenciaMMearsDHidalgoCGlucose-dependent insulin secretion in pancreatic β-cell islets from male rats requires Ca2+ release via ROS-stimulated ryanodine receptorsPLoS One20151010e014019826431036
- HaysLBWicksteedBWangYIntragranular targeting of syncollin, but not a syncollin GFP chimera, inhibits regulated insulin exocytosis in pancreatic beta-cellsJ Endocrinol20051851576715817827