
 ?Mathematical formulae have been encoded as MathML and are displayed in this HTML version using MathJax in order to improve their display. Uncheck the box to turn MathJax off. This feature requires Javascript. Click on a formula to zoom.
Abstract
Purpose
The purpose of this study was to investigate the feasibility and sensitivity of cellular magnetic resonance imaging (MRI) with ferumoxytol nanocomplex-labeled macrophages at ultrahigh magnetic field of 7 T.
Materials and methods
THP-1-induced macrophages were labeled using self-assembling heparin + protamine + ferumoxytol nanocomplexes which were injected into a gelatin phantom visible on both microscope and MRI. Susceptibility-weighted imaging (SWI) and balanced steady-state free precession (bSSFP) pulse sequences were applied at 3 and 7 T. The average, maximum intensity projection, and root mean square combined images were generated for phase-cycled bSSFP images. The signal-to-noise ratio and contrast-to-noise ratio (CNR) efficiencies were calculated. Ex vivo experiments were then performed using a formalin-fixed pig brain injected witĥ100 and ~1,000 labeled cells, respectively, at both 3 and 7 T.
Results
A high cell labeling efficiency (.90%) was achieved with heparin + protamine + ferumoxytol nanocomplexes. Less than 100 cells were detectable in the gelatin phantom at both 3 and 7 T. The 7 T data showed more than double CNR efficiency compared to the corresponding sequences at 3 T. The CNR efficiencies of phase-cycled bSSFP images were higher compared to those of SWI, and the root mean square combined bSSFP showed the highest CNR efficiency with minimal banding. Following co-registration of microscope and MR images, more cells (51/63) were detected by bSSFP at 7 T than at 3 T (36/63). On pig brain, botĥ100 and ~1,000 cells were detected at 3 and 7 T. While the cell size appeared larger due to blooming effects on SWI, bSSFP allowed better contrast to precisely identify the location of the cells with higher signal-to-noise ratio efficiency.
Conclusion
The proposed cellular MRI with ferumoxytol nanocomplex-labeled macrophages at 7 T has a high sensitivity to detect, 100 cells. The proposed method has great translational potential and may have broad clinical applications that involve cell types with a primary phagocytic phenotype.
Video abstract
Point your SmartPhone at the code above. If you have a QR code reader the video abstract will appear. Or use:
Background
Noninvasive imaging of cells labeled with ultrasmall superparamagnetic iron oxide nanoparticles (USPIOs, >50 nm) in intact, live organisms has drawn growing interest in many fields related to cell transplantation, early detection of cell homing, and monitoring cell migration. During the past two decades, many studies have used magnetic resonance imaging (MRI) to track cells after they are labeled with USPIOs, including stem cell tracking to damaged myocardium, early detection of tissue rejection, early detection of cancer and inflammation, and tracking neural stem cell response to stroke and trauma.Citation1,Citation2 However, most cell-based imaging studies are preclinical with relatively few clinical studies in humans. In particular, there are several challenges for translating USPIO-based cellular MRI for in vivo human brain imaging: 1) MRI is typically described as having high image resolution, but low sensitivity (compared to positron emission tomography); reported sensitivity of human cellular MRI is generally on the order of a few thousand cells,Citation3 2) gradient-echo (GRE) or T2*-weighted sequences are typically used for detecting USPIO-labeled cells. The negative contrast of USPIOs on T2*-weighted images may be confounded by other susceptibility effects, such as microhemorrhages, and is difficult to interpret in areas near air, bone, or areas with blood flow, and 3) the labeling efficiency of USPIOs is not high for most immune or stem cells, and the label will be diluted once the cell divides.
Recently, self-assembling nanocomplexes by combining three US Food and Drug Administration (FDA)-approved compounds – heparin, protamine, and ferumoxytol (HPF) – were introduced for efficient cell labeling with threefold increase in T2 relaxivity compared to ferumoxytol.Citation4 Here, we propose a novel method for cellular MRI using HPF nanocomplex-labeled white blood cells (macrophages) and phase-cycled balanced steady-state free precession (bSSFP) sequences at ultrahigh field (UHF) of 7 T. This method is expected to effectively address the limitations of existing USPIO-based cellular MRI while retaining the high spatial resolution and contrast for the visualization of brain anatomy and function. As a proof-of-concept, we demonstrate the feasibility and evaluate the sensitivity of this technique in in vitro studies and ex vivo brain specimen at both 3 and 7 T.
Materials and methods
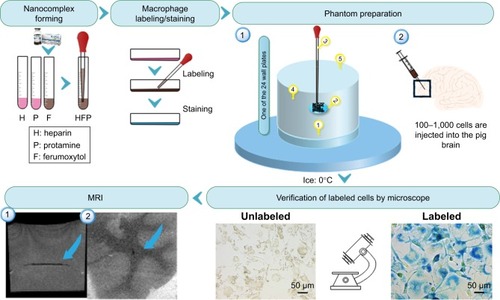
The present study was exempt from Institutional Animal Care and Use Committee approval as no vertebrate animal was involved in the experiment. shows the schematic diagram of the workflow of our study, including nanocomplex preparation, cell labeling and staining, labeling verification by microscope followed by MRI of labeled cells in phantom and ex vivo tissue samples. Below we describe the detailed methods for each step.
Figure 1 Schematic diagram of the workflow to show the process of nanocomplex preparation, cell labeling, cell staining, labeling verification by microscope, and MRI.
Notes: Numbers in phantom preparation indicate as (1) adding 200 μL 4% gelatin at the bottom of each well; (2) adding 100 μL 4% gelatin in the middle of each well and on top of the solid layer formed by the 200 μL gelatin of step 1; (3) injecting 10 μL media with labeled cells and 10% trypan blue in the middle of the previously added 100 μL 4% gelatin before it was frozen; (4) filling the tube with 4% gelatin after the gelatin turned solid and the cells were fixed; (5) removing air bubbles in gelatin using a pipette. Images in MRI represent (1) MRI image of labeled cells in a gel phantom; (2) MRI image of labeled cells in ex vivo pig brain tissue. Blue arrows represent location of labeled cells. Magnification 5×20 for images from verification of labeled cells by microscope.
Abbreviation: MRI, magnetic resonance imaging.
Cell preparation
THP-1 is a human promonocytic cell line derived from acute monocytic leukemia.Citation5 THP-1 cells (American Type Culture Collection) were maintained at 37°C and 5% CO2 in RPMI 1640 (Thermo Fisher Scientific, Waltham, MA, USA) supplemented with 10% fetal bovine serum (FBS; Thermo Fisher Scientific), 1% penicillin/streptomycin, and 10 mM HEPES (Calbiochem). Also, 100 ng/mL of phorbol 12-myristate 13-acetate was added and incubated for 3 days to convert THP-1 cells into phagocytic macrophage cells.
Cell labeling
Adherent monolayer THP-1-differentiated macrophages were grown to 80%–90% confluence. The macrophages were then labeled in serum-free RPMI-1640. Different labeling strategies and labeling times (1 and 2 days) were tested on the THP-1 differentiated macrophages, including 1) ferumoxytol (Feraheme®; AMAG Pharmaceuticals, Boston, MA, USA) only, 2) ferumoxytol + protamine, and 3) HPF (), which were used to label the cells to achieve a high labeling efficiency and T2 relaxivity. The concentrations of ferumoxytol, protamine, and heparin in each labeling condition were kept the same: heparin (2 IU/mL), protamine (60 μg/mL), and ferumoxytol (50 μg/mL). The three compounds were mixed together to form self-assembling nanocomplexes for 5 min according to Thu et al.Citation4 After incubation in serum-free medium for 2–4 hours, FBS was added to make the concentration of FBS 10%–20% in the medium. The three USPIO compounds were added into the corresponding medium, respectively, and incubated 1 or 2 days, respectively. Adhered macrophages were then detached from incubation with pancreatic enzymes (0.25%) combined with EDTA (1 mM) and then washed in PBS for three times. Cell number was counted by a hemocy-tometer twice to obtain the average number.
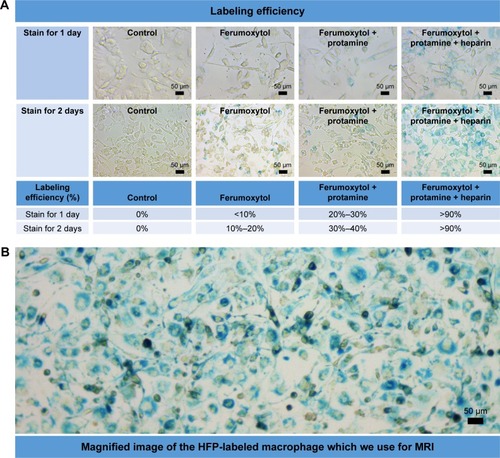
Figure 2 (A) Labeling efficiency of different labeling methods. The labeling efficiency of ferumoxytol only (,20%) or combining ferumoxytol and protamine (,40%) was relatively poor, while self-assembling nanocomplexes formed by combining ferumoxytol, heparin, and protamine could achieve a high labeling efficiency (.90%). (B) Magnified image of HPF-labeled macrophage stain used for MRI. Magnification 5×20.
Abbreviations: HPF, heparin, protamine, and ferumoxytol; MRI, magnetic resonance imaging.
Cell viability and labeling efficiency
Cell viability was then confirmed by the trypan blue exclusion test for membrane integrity according to a published protocol.Citation6 Cells were counted using a cell counting chamber. A cell viability of .90% was the criterion for the following steps.
The labeled cells were stained by Prussian blue to verify the labeling efficiency. Perls’ Prussian blue staining was applied for displaying ferric iron and ferritin protein.Citation7 After labeling with three compounds of ferumoxytol for 1 or 2 days, the labeled cells were fixed with 4% paraformaldehyde for 5 min. A mixture of 4% potassium ferrocyanide (potassium hexacyanoferrate (II) trihydrate, Sigma) and 3.7% hydrochloric acid (Perls’ reagent for Prussian blue staining) was added for 30 min, and then cells were washed with PBS for three times.
Finally, the stained cells were imaged and captured using a phase-contrast reverse microscope (20×; Leica Microsys-tems, Wetzlar, Germany). Cells exhibiting blue intracellular particles were considered Prussian blue positive. The percentage of labeled cells was determined from the average of the labeled cells versus the total number of cells from four randomly selected fields of view.
Gelatin phantom preparation
A gelatin phantom was designed and constructed to be suitable for both microscope imaging and MRI using 24-well plates (). Five steps were followed as shown in : 1) adding 200 μL 4% gelatin at the bottom of each well; 2) adding 100 μL 4% gelatin in the middle of each well and on the top of the solid layer formed by the 200 μL gelatin of Step 1; 3) injecting 10 μL media with labeled cells and 10% trypan blue in the middle of the previously added 100 μL 4% gelatin before it was frozen; 4) filling the tube with 4% gelatin after the gelatin turned solid and the cells were fixed; and 5) removing air bubbles in gelatin using a pipette.
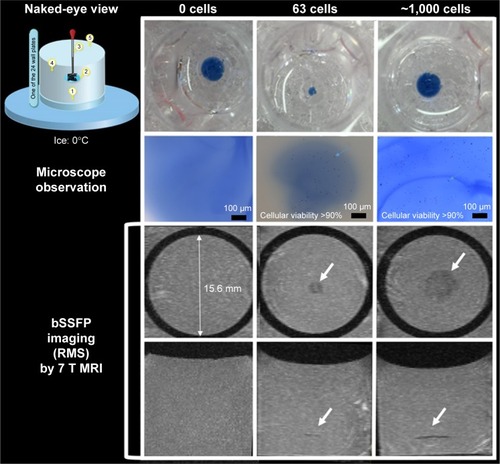
Figure 3 Diagram showing phantom preparation method by fixing macrophages between two layers of gelatin without air bubbles.
Notes: Numbers in naked-eye view image indicate as (1) adding 200 μL 4% gelatin at the bottom of each well; (2) adding 100 μL 4% gelatin in the middle of each well and on top of the solid layer formed by the 200 μL gelatin of step 1; (3) injecting 10 μL media with labeled cells and 10% trypan blue in the middle of the previously added 100 μL 4% gelatin before it was frozen; (4) filling the tube with 4% gelatin after the gelatin turned solid and the cells were fixed; (5) removing air bubbles in gelatin using a pipette. Both microscope (top row, dark dots are individual cells) and MRI (second and third rows showing sagittal and axial views of RMS combined bSSFP images) can be used to image the phantom. A cellular level of, 100 cells can be achieved with this phantom and can be clearly detected by MRI with RMS combined phase-cycled bSSFP images. White arrows show the location of the labeled cells.
Abbreviations: bSSFP, balanced steady-state free precession; MRI, magnetic resonance imaging; RMS, root mean square.
The central eight wells of the 24-well plate were prepared as above, and the remaining 16 wells were directly injected with 4% gelatin as control. The phantom was stored in a refrigerator at 4°C for MRI the next day. Several (six to eight) 24-well plates were stacked for MRI ().
The labeled cells were diluted to concentrations of 6.20×10³/mL, 1.25×10⁴/mL, 2.50×10⁴/mL, 5.00×10⁴/mL, and 1.00×10⁵/mL. Then, 10 μL cell solutions with concentrations of 6.20×10³/mL, 1.25×10⁴/mL, 2.50×10⁴/mL, 5.00×10⁴/mL, and 1.00×10⁵/mL were injected into the gelatin phantom. Hence, the wells of the gelatin phantom contained ~62, 125, 250, 500, and 1,000 cells in 10 μL medium.
Brain specimen preparation
A fresh pig brain was purchased from the supermarket, incubated, and fixed with formalin. The HPF-labeled cells were diluted to a concentration of 1×10⁵/mL, and then, 1 μL and 10 μL solutions were injected into the pig brain cortex. Hence, ~100 and 1,000 cells were injected with a microin-jection needle into the pig brain cortex. Right before injection, the needle was pulled back 1 mm, and the cells were administered at a rate of 0.5 μL per 2 min to prevent reflux. For MRI, the pig brain was cut into several pieces to fix in a small plastic box and submerged in formalin. This step minimized susceptibility artifacts due to air bubbles.
MRI of labeled cells
All MR images were acquired on a 3 T Prisma and a 7 T Terra whole-body MR system (Siemens, Erlangen, Germany) with 32-channel head coils. Two MRI pulse sequences using susceptibility-weighted imaging (SWI) and bSSFP were applied with an identical spatial resolution of 0.2×0.2×0.2 mm3 and closely matched imaging parameters, as shown in . The imaging protocols were based on literatureCitation8 as well as our empirical testing and practical constrain of scan time. For instance, SWI scans had four measurements in order to achieve adequate image quality at 3 T, while only two measurements were needed at 7 T. The differences in imaging time were accounted for during post-processing (see below). To minimize the banding artifact in bSSFP, phase cycling was performed with a total step of 16 (phase shift of π/8).Citation8 In addition, standard single-phase bSSFP scans were performed with identical parameters of phase-cycled bSSFP without phase shift. Details of the imaging parameters of SWI, bSSFP, and phase-cycled bSSFP are listed in .
Table 1 Parameters of SWI, bSSFP, and phase-cycled bSSFP for MRI scan of the gelatin phantom and brain specimen at 3 and 7 T
Post-processing of MRI
The phase-cycled bSSFP images were processed by three methods with a custom Matlab program: 1) average of the signal (AVE), 2) maximum intensity projection (MIP), and 3) root mean square (RMS) of images across phase cycles. Both signal-to-noise ratio (SNR) efficiency and contrast-to-noise ratio (CNR) efficiency were calculated for three times for the phantom study and the ex vivo brain study, and the mean values are reported in and , respectively.
Table 2 SNR and CNR efficiencies of SWI/bSSFP images acquired at 3 and 7 T on 1,000 cells injected into the gelatin phantom
Table 3 SNR and CNR efficiencies and segmented volumes of 100 and 1,000 labeled cells in a brain specimen using SWI and RMS combined phase-cycled bSSFP by 3 and 7 T
The SNR efficiency was defined as:
The CNR efficiency was defined as:
MRI signal changes of bSSFP and SWI at 3 and 7 T as a function of the injected cell number were measured on gelatin phantom and ex vivo brain specimen, respectively. Furthermore, the volumes of the labeled cells were manually segmented by ITK-SNAP.Citation9 The segmented volume and the SNR and CNR efficiencies were calculated for three times and the mean values were reported. Furthermore, image co-registration between microscope and MRI was performed using b-spline transformation and mutual information metric provided in Elastix.Citation10 This step allowed verification of the detection of >100 cells using MRI.
Evaluation of reproducibility
The phantom was constructed three times following the identical procedures as described above, and MR images (both 3 and 7 T) were acquired the following day. Statistical analysis was performed using GraphPad Prism 5 software (GraphPad Software, Inc.), and a p-value ≤0.05 (two-sided) was considered statistically significant.
Results
Cell labeling efficiency
As shown in of cell staining results, cell labeling using HPF nanocomplexes achieved a high labeling efficiency of >90% for both 1 and 2 days of labeling. The other two labeling methods were much less efficient (feru-moxytol <20% and <10%, ferumoxytol + protamin <40% and 30% for labeling time of 2 and 1 day, respectively). We chose cell labeling with HPF nanocomplexes for 2 days in the following experiments to achieve the highest labeling efficiency.
MRI with SWI, bSSFP, and phase-cycled bSSFP in gelatin phantom
shows the gelatin phantom by fixing macrophages between two layers of gelatin without air bubbles. Both microscope (top row, dark dots are individual cells) and MRI (second and third rows showing sagittal and axial views of RMS combined bSSFP images) can be applied to image the phantom. A cellular level of >100 cells can be achieved with this phantom and can be clearly detected by MRI with phase-cycled bSSFP images. The cells were intact in the gelatin phantom as shown by the microscope images (second row of ).
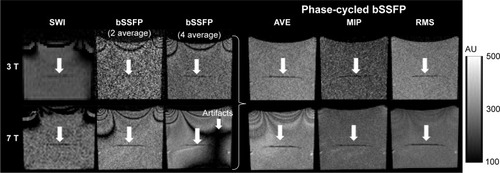
shows a comparison of SWI and bSSFP images of the gelatin phantom with ~1,000 labeled cells at 3 T (top row) and 7 T (bottom row), respectively. The original single-phase bSSFP images show banding artifacts, which are severer in images with four averages compared to those with two averages, due to magnetic field drift with time, especially at 7 T. The banding artifacts are suppressed in AVE, MIP, and RMS combined phase-cycled bSSFP images. The SNR and CNR efficiency values are listed in . At the same field strength, the SNR efficiencies of phase-cycled and single-phase bSSFP are higher than that of SWI. The CNR efficiencies are the highest using RMS and AVE combined phase-cycled bSSFP, followed by MIP combined phase-cycled bSSFP and standard single-phase bSSFP, and the lowest in SWI. Both SNR and CNR efficiencies are approximately doubled or more than doubled at 7 T compared to those at 3 T.
Figure 4 Comparison of SWI and bSSFP images of phantom witĥ1,000 labeled cells at 3 T (top row) and 7 T (bottom row).
Notes: The original bSSFP images show banding artifacts which are suppressed in combined phase-cycled AVE, MIP, and RMS images. Severer banding artifact in bSSFP images with four averages is due to magnetic field drift with time. White arrows show the location of labeled cells.
Abbreviations: AVE, average of the signal; bSSFP, balanced steady-state free precession; MIP, maximum intensity projection; RMS, root mean square; SWI, susceptibility-weighted imaging.
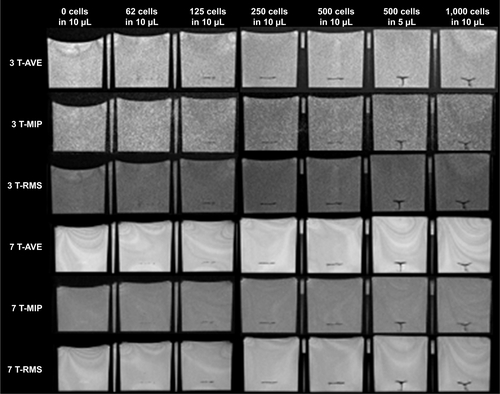
shows the results of SWI and RMS combined bSSFP imaging of different cell concentrations (~62, 125, 250, 500, and 1,000 cells in 10 μL medium) at 3 and 7 T, respectively. The three-dimensional rendering of manually segmented volume of labeled cells (using ITK-SNAP) with different concentrations of cells using SWI and bSSFP are shown in . Phase-cycled bSSFP images with three different combination methods (AVE, MIP, and RMS) at 3 and 7 T are shown in .
Figure 5 (A) SWI and RMS combined phase-cycled bSSFP images of different concentrations of cells (about 0, 62, 125, 250, 500, and 1,000 cells in 10 μL medium) injected into the gelatin phantom at 3 and 7 T. (B) CNR efficiency of MRI versus number of cells using SWI, RMS bSSFP at 3 and 7 T.
Abbreviations: bSSFP, balanced steady-state free precession; CNR, contrast-to-noise ratio; MRI, magnetic resonance imaging; RMS, root mean square; SWI, susceptibility-weighted imaging.
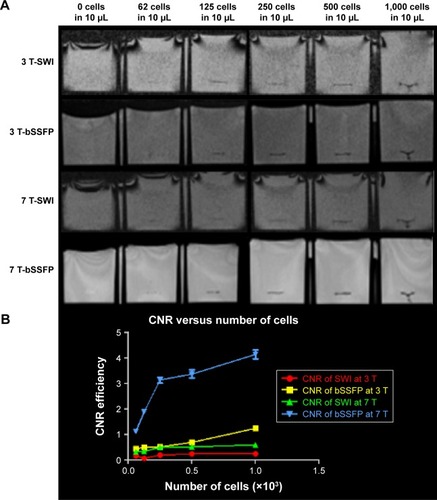
Figure 6 (A) 3D view of manually segmented volumes of labeled cells with different concentrations on SWI and RMS combined phase-cycled bSSFP at 3 and 7 T. (B) Segmented volume versus number of cells using SWI and phase-cycled bSSFP at 3 and 7 T.
Abbreviations: 3D, three dimensional; bSSFP, balanced steady-state free precession; RMS, root mean square; SWI, susceptibility-weighted imaging.
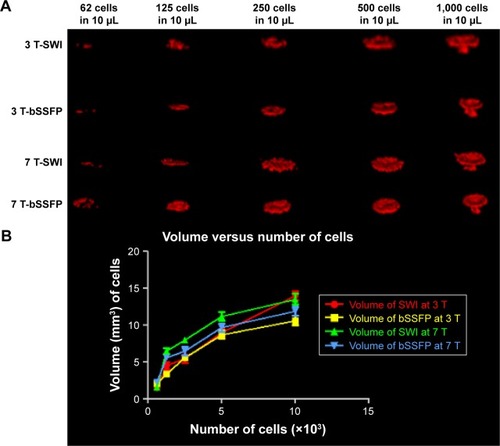
As shown in , the CNR efficiency increases as the number of labeled cells increases. CNR efficiency is .1 for all cell concentrations using bSSFP at 7 T, while it is .1 only for 1,000 cells in 10 μL condition using bSSFP at 3 T. For SWI, the CNR efficiencies are below 0.6 for all cell concentrations at 3 and 7 T. Also, the segmented volume of labeled cells increases as the cell number increases. The segmented volume of the cells is generally larger in SWI compared to that of bSSFP due to the stronger blooming effect of SWI. However, the segmented volume of 62 labeled cells is comparable between bSSFP and SWI.
Comparison of MRI and microscope
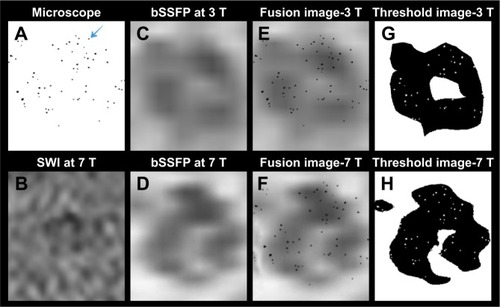
shows the co-registration of microscope images and RMS combined bSSFP MRI of the phantom with 63 labeled cells. More cells (51/63, 81%) were detected in 7 T images compared to 3 T (36/63, 57%) with a threshold of 40% signal decrease. SWI is also shown in , which is deemed too noisy for image registration.
Figure 7 Diagram showing co-registration of microscope images and MRI of the phantom with 63 cells.
Notes: Image registration was performed using b-spline transformation and mutual information metric provided in Elastix. (A) The microscope images of the 63 cells post-processed by ImageJ to show only the cells as dark spots. Blue arrow indicates the cells. (B) The SWI images of the 63 cells are too noisy for co-registration and overlay. (C) Zoomed 3 T RMS combined bSSFP image of the 63 cells. (D) Zoomed 7 T RMS combined bSSFP image of the 63 cells. (E) The fusion images of (A and C) after co-registration. (F) The fusion images of (A and D) after co-registration. (G) Image (E) post-processed with a threshold of 40% signal decrease. (H) Image (F) post-processed with a threshold of 40% signal decrease. More cells (51/63, 81%) are detected in 7 T images compared to 3 T images (36/63, 57%).
Abbreviations: bSSFP, balanced steady-state free precession; MRI, magnetic resonance imaging; RMS, root mean square; SWI, susceptibility-weighted imaging.
SWI and bSSFP MRI of labeled cells in brain specimen
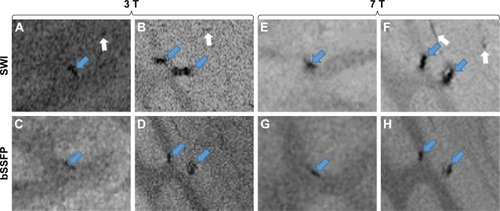
As shown in , ~100 and ~1,000 cells can be imaged by both bSSFP and SWI in a brain specimen with 3 and 7 T scanners. The volume and the SNR and CNR efficiencies are listed in . For SNR and CNR, the 7 T scanner has better performance than the 3 T scanner while bSSFP has better performance than SWI. The volume of segmented cells is larger by SWI compared to that by bSSFP, which may be the result of the blooming effect of SWI.
Figure 8 Ex vivo experiment with different numbers of cells, that is, ~100 (A, C, E, G) and ~1,000 (B, D, F, H), injected into the pig brain, respectively.
Notes: Images (A–D) were acquired at 3 T, while images (E–H) were acquired at 7 T. Images (A, B, E, and F) in the first row are SWI images, while images (C, D, G, and H) in the second row are RMS combined phase-cycled bSSFP images. The blue arrows in images (A–H) show labeled cells, while the white arrows show false-positive detection of labeled cells.
Abbreviations: bSSFP, balanced steady state free precession; SWI, weighted imaging.
Discussion
SSFP imaging for detecting USPIO-labeled cells
Using combined phase-cycled bSSFP,, 100 cells were detected in a gelatin phantom at both 3 and 7 T using clinical MRI scanners and product 32-channel head coils in the present study. The majority of earlier studies examined a relatively large number of cells (105–106 cells).Citation11 Recent studies have moved toward detecting a smaller number of cells or even single cells. Hoehn et alCitation12 demonstrated an in vivo detection limit of 500 stem cells implanted in the rat brain. Dahnke and SchaeffterCitation13 predicted the detection limit to be 600 labeled cells per voxel in the brain and 28,000 labeled cells per voxel in the liver using 3 T MRI. Kircher et alCitation14 showed that as few as three USPIO-labeled cytotoxic lymphocytes per voxel could be detected at 8.5 T in a tumor in live mice. Single SPIO-labeled cells have been reported to be detectable in in vitro studies at both low field strength (1.5 T with a custom gradient coil)Citation15 and UHF strength (7 T)Citation16,Citation17 animal scanner. However, to the best of our knowledge, the minimal number of USPIO-labeled cells reported in literature imaged by clinical MRI scanners and coils waŝ1,000 cells.Citation4,Citation18
Most studies have used GRE and SWI sequences for detecting USPIO-labeled cells, by exploiting the “blooming” effect on MR phase images to accentuate the signal loss. The blooming effect has been reported to spatially extend to approximately two orders of the original size of the object.Citation19 In addition, quantitative susceptibility map may be applied for estimating the susceptibility of the source and its iron concentration.Citation20,Citation21 However, the SNR of GRE and SWI sequences is relatively low for detecting USPIO-labeled cells with potential confounds from other susceptibility sources such as air and blood vessels. The bSSFP offers an appealing alternative to GRE/SWI for cell tracking using MRI,Citation22,Citation23 by taking advantage of 1) the high SNR efficiency; 2) the unique T2/T1 contrast ideally suited for detecting USPIOs that primarily generate negative T2 contrast with moderate effects on T1; and 3) the strong intravoxel magnetic gradients generated by an SPIO-labeled cell that cause multiple bands emanating from the cell.Citation24 It has been shown both theoretically and experimentally that bSSFP is able to detect single cells labeled with SPIOs.Citation22,Citation24
In the present study, phase-cycled bSSFP offered higher SNR and CNR efficiencies than SWI for detecting USPIO-labeled cells, while effectively removing banding artifact caused by (large-scale) field inhomogeneity and susceptibility effects as well as blood flow-related artifacts. A monotonic relationship between phase-cycled bSSFP (and SWI) signal changes and cell number was also demonstrated in the present study. The disadvantage of bSSFP is banding artifact, which requires phase-cycled measurements with lengthy scan time. We have proposed a highly efficient simultaneous multi-slice bSSFP techniqueCitation25 to acquire phase-cycled bSSFP images within the scan time of the standard single-phase bSSFP scan. Alternatively, an integrated SSFP techniqueCitation26,Citation27 may be applied for detecting USPIO-labeled cells by removing the sensitivity of bSSFP to large-scale field variations, while maintaining similar image contrast and SNR. In future studies, both simultaneous multi-slice bSSFP and integrated SSFP may be applied for cell tracking experiment without lengthening the scan time at high and ultrahigh magnetic fields.
Ultrahigh magnetic field for cellular imaging
Ultrahigh magnetic field is an emerging trend in neuroimaging that allows increased SNR, spatial and temporal resolutions, and enhanced sensitivity to susceptibility effects. Structural and functional MRI with a sub-millimeter spatial resolution is readily achievable at 7 T. The cell tracking results can be directly integrated with the high-resolution multi-contrast MRI to identify the fine brain structure to which the cells are delivered (eg, small blood vessels versus perivascular space). In addition, specific physiological and functional changes induced by USPIO-labeled cells can be simultaneously measured by MRI (eg, using arterial spin labeling and blood oxygenation level dependent functional MRI). The 7 T Terra MR system used in the present study is the first FDA-approved UHF MR system. It is equipped with high order (third) shimming and the performance gradient system with a maximal strength of 80 mT/m (also installed on 3 T Prisma MR system). All developed MR pulse sequences and imaging protocols can, therefore, be directly translated to human brain imaging.
Improved cell labeling efficiency using ferumoxytol nanocomplexes
Another challenge for existing USPIO-based cellular imaging is that the labeling efficiency of most immune or stem cells is relatively low. Ferumoxytol aloneCitation28 or in combination with protamineCitation29,Citation30 was found to not effectively label cells. Recently, self-assembling nanocomplexes by combining heparin, protamine, and ferumoxytol were introduced for efficient cell labeling with threefold increase in T2 relaxivity compared to ferumoxytol alone.Citation4 By utilizing HPF nanocomplex-labeled white blood cells (macrophages), we were able to achieve >90% labeling efficiency and demonstrate the feasibility for detecting a few tens (<100) of cells in serum-free medium and ex vivo tissue samples using phase-cycled bSSFP imaging at 7 T.
USPIO labeling of immune cells
In the present study, we used HPF nanocomplex-labeled macrophages as a proof-of-concept of cellular MRI, which has several potential advantages. First, most existing approaches for cell tracking suffer from the loss of labeling when the cell dies. For macrophages, even when the cell dies, the nanoparticles will still be cleared by other macrophages, which means that the nanoparticles will continue to stay in the reticuloendothelial system although the USPIO concentration may vary. Second, macrophage is the end stage of the reticuloendothelial system, which means it will not divide. The USPIO labeling will not dilute to undetectable levels as the cell divides. Third, as the most plastic cells of the hematopoietic system, macrophages play an important role in many diseases related to the human immune system.Citation31 A number of macrophage-pacifying therapies have been proposed for treatment of tumor. Therefore, the proposed cell labeling and imaging of macrophages may have applications in the early diagnosis and treatment of tumor.
The central nervous system (CNS) has an immune privilege protected by the blood–brain barrier (BBB) and maintained by the glia. Nevertheless, research in the field of neuroimmunology in the past 20 years has shown that in homeostatic conditions, peripheral immune cells are able to penetrate to the deepest regions of brain without altering the structural integrity of the BBB.Citation32,Citation33 Peripheral white blood cells may gain access to the brain through first transmigration from the endothelial wall to the perivascular spaces and then progression across the glia limitans into the parenchyma.Citation33 In healthy brain, macrophages primarily stay within the perivascular space for performing immune surveillance and profiling their differentiation programs accordingly.Citation34,Citation35 The second route for peripheral white blood cells to gain access to the CNS is through the blood–cerebrospinal fluid (CSF) barrier including the choroid plexus and the subarachnoid space. There is a consensus in assigning the choroid plexus as the most accessible yet selective gate for white blood cell or leukocyte transmigration into the brain.Citation36 As posited by the theory of “glymphatic system”, immune cells of CSF could have direct contact with extracellular brain proteins and solutes and, therefore, participate in their clearance or alternatively start to mount an effective immune response.Citation37 In summary, the various routes for peripheral immune cells to gain access to the CNS in homeostatic conditions open the door to deliver USPIO-labeled cells into a healthy brain without compromising the integrity of the BBB.
Potential clinical translations
Since HPF are all FDA-approved drugs, the proposed method for cell labeling with nanocomplexes bears considerable potential for translation to human brain imaging. The proposed method may have broad clinical applications that involve cell types with a primary phagocytic phenotype. In the future, HPF nanocomplex-labeled white blood cells (eg, macrophages and monocytes) may be delivered through intravenous infusion for in vivo cellular brain imaging at 7 T. Monocytes and macrophages have a relatively long life of days with a relatively large cell body of ~20 μm, facilitating in vivo cell tracking.Citation38 Unlike other immune cells such as T-cells, monocytes and macrophages do not divide; therefore, the cell labeling would not be diluted. Tracking peripheral white blood cells into the brain in vivo may address a number of fundamental neuroscientific questions (eg, to test the theory of “glymphatic system”) and may demonstrate the route by which blood-derived leukocytes enter the CNS and circulate within the perivascular space of CSF and/or through the brain parenchyma. The proposed method may also be ideal for tracking macrophages in neoplasms and may even have therapeutic value. Recent studies have shown that macrophages exposed to ferumoxytol can inhibit the growth of subcutaneous adenocarcinomas in mice.Citation39 With the recent FDA approval of cell-based chimeric antigen receptor T cell therapy that employs genetically engineered T-cells to target tumor cells,Citation40 we expect cell-based therapy, imaging methods, and associated labeling strategies will grow substantially in the coming years.
Limitations of the study
The proposed cell tracking application by the phase-cycled bSSFP of HPF nanocomplex-labeled macrophages at UHF MRI has several limitations. First, it may be challenging to inject macrophages into the vein or artery, given its large size. It means that this approach may require a local injection or specific injection method to avoid these side effects. Alternatively, we may label cells with smaller size (eg, monocytes) for intravenous delivery. In view of the technology translation to clinical use, we only use the recommended clinical dosage of ferumoxytol and do not discuss the signal change caused by the concentration changes of ferumoxytol. Second, although we tried to match the imaging parameters between SWI and bSSFP at 3 and 7 T, it is still impossible to make them identical. Due to technical limitations, no histologic comparison was performed for ex vivo imaging results. Third, USPIOs are not detected directly; rather, they are detected through the use of indirect microscopic disturbances in the magnetic field. As a result, it proves challenging to correlate the MRI signal with the number of cells present, although we demonstrated a monotonic relationship between MRI signal change and cell number. Magnetic particle imaging may offer an alternative approach for detecting and quantifying USPIOs.
Conclusion
The proposed cellular MRI with ferumoxytol nanocomplex-labeled macrophages at 7 T has a high sensitivity to detect, 100 cells. Since HPF as well as 7 T Terra are FDA approved, the proposed method has great translational potential and may have broad clinical applications that involve cell types with a primary phagocytic phenotype.
Acknowledgments
This work was supported by the US National Institute of Health (NIH) grants UH2-NS100614, R01EB014922, K25AG056594, the American Heart Association (AHA) grant 6SDG29630013, and the Shandong science and technology development plan 2015GSF118005. The authors thank Dr. Yuchuan Qiao for assistance with co-registration of the microscope image and MRI.
Supplementary material
Figure S1 AVE, MIP, and RMS combined phase-cycled bSSFP images of different concentrations of cells (0, 62, 125, 250, 500, and 1,000 cells in 10 μL medium including 500 cells in 5 μL medium) in the gelatin phantom.
Note: Phase-cycled bSSFP images were combined with three methods to minimize banding artifacts.
Abbreviations: AVE, average of the signal; bSSFP, balanced steady-state free precession; MIP, maximum intensity projection; RMS, root mean square.
Disclosure
The authors report no conflicts of interest in this work.
References
- KorchinskiDJTahaMYangRNathooNDunnJFIron oxide as an MRI contrast agent for cell trackingMagn Reson Insights20158Suppl 1152926483609
- MakelaAVMurrellDHParkinsKMKaraJGaudetJMFosterPJCellular imaging with MRITop Magn Reson Imaging201625517718627748707
- BulteJWIn vivo MRI cell tracking: clinical studiesAJR Am J Roentgenol2009193231432519620426
- ThuMSBryantLHCoppolaTSelf-assembling nanocomplexes by combining ferumoxytol, heparin and protamine for cell tracking by magnetic resonance imagingNat Med201218346346722366951
- TsuchiyaSYamabeMYamaguchiYKobayashiYKonnoTTadaKEstablishment and characterization of a human acute monocytic leuke-mia cell line (THP-1)Int J Cancer19802621711766970727
- StroberWTrypan blue exclusion test of cell viabilityCurr Protoc Immunol2001 Appendix 3:Appendix 3B
- ArbabASBashawLAMillerBRCharacterization of biophysical and metabolic properties of cells labeled with superparamagnetic iron oxide nanoparticles and transfection agent for cellular MR imagingRadiology2003229383884614657318
- BangerterNKHargreavesBAVasanawalaSSPaulyJMGoldGENishimuraDGAnalysis of multiple-acquisition SSFPMagn Reson Med20045151038104715122688
- YushkevichPAPivenJHazlettHCUser-guided 3D active contour segmentation of anatomical structures: significantly improved efficiency and reliabilityNeuroimage20063131116112816545965
- KleinSStaringMMurphyKViergeverMAPluimJPElastix: a toolbox for intensity-based medical image registrationIEEE Trans Med Imaging201029119620519923044
- Daldrup-LinkHEBraschRCMacromolecular contrast agents for MR mammography: current statusEur Radiol200313235436512599002
- HoehnMKüstermannEBlunkJMonitoring of implanted stem cell migration in vivo: a highly resolved in vivo magnetic resonance imaging investigation of experimental stroke in ratProc Natl Acad Sci U S A20029925162671627212444255
- DahnkeHSchaeffterTLimits of detection of SPIO at 3.0 T using T2* relaxometryMagn Res Med200553512021206
- KircherMFAllportJRGravesEEIn vivo high resolution three-dimensional imaging of antigen-specific cytotoxic T-lymphocyte trafficking to tumorsCancer Res200363206838684614583481
- Foster-GareauPHeynCAlejskiARuttBKImaging single mammalian cells with a 1.5 T clinical MRI scannerMagn Res Med2003495968971
- HeynCBowenCVRuttBKFosterPJDetection threshold of single SPIO-labeled cells with FIESTAMagn Res Med2005532312320
- LewinMCarlessoNTungCHTat peptide-derivatized magnetic nanoparticles allow in vivo tracking and recovery of progenitor cellsNat Biotechnol200018441041510748521
- ShichinoheHKurodaSKudoKVisualization of the superpara-magnetic iron oxide (SPIO)-labeled bone marrow stromal cells using a 3.0-T MRI-a pilot study for clinical testing of neurotransplantationTransl Stroke Res2012319910624323757
- LiuSBuchSChenYSusceptibility-weighted imaging: current status and future directionsNMR Biomed2017304
- BuchSChengYNHuJDetermination of detection sensitivity for cerebral microbleeds using susceptibility-weighted imagingNMR Biomed2017304
- ZhengWNicholHLiuSChengYCHaackeEMMeasuring iron in the brain using quantitative susceptibility mapping and X-ray fluorescence imagingNeuroimage201378687423591072
- HeynCRonaldJAMackenzieLTIn vivo magnetic resonance imaging of single cells in mouse brain with optical validationMagn Reson Med2006551232916342157
- Foster-GareauPHeynCAlejskiARuttBKImaging single mammalian cells with a 1.5 T clinical MRI scannerMagn Reson Med200349596897112704781
- HeynCBowenCVRuttBKFosterPJDetection threshold of single SPIO-labeled cells with FIESTAMagn Reson Med200553231232015678551
- WangYShaoXMartinTMoellerSYacoubEWangDJPhase-cycled simultaneous multislice balanced SSFP imaging with CAIPIR-INHA for efficient banding reductionMagn Reson Med20167661764177426667600
- SunKXueRZhangPIntegrated SSFP for functional brain mapping at 7T with reduced susceptibility artifactJ Magn Reson2017276223028092785
- MartinTWangYShamsRHighly Accelerated SSFP Imaging with Controlled Aliasing in Parallel Imaging and integrated-SSFP (CAIPI-iSSFP)Invest Magn Reson Imaging2017214210222
- Oude EngberinkRDvan der PolSMDoppEAde VriesHEBlezerELComparison of SPIO and USPIO for in vitro labeling of human monocytes: MR detection and cell functionRadiology2007243246747417456871
- NeuweltEAHamiltonBEVarallyayCGUltrasmall superpara-magnetic iron oxides (USPIOs): a future alternative magnetic resonance (MR) contrast agent for patients at risk for nephrogenic systemic fibrosis (NSF)?Kidney Int200975546547418843256
- JanicBIskanderARadAMSoltanian-ZadehHArbabASEffects of ferumoxides–protamine sulfate labeling on immunomodulatory characteristics of macrophage-like THP-1 cellsPLoS One200836e249918575575
- WynnTAChawlaAPollardJWMacrophage biology in development, homeostasis and diseaseNature2013496744644545523619691
- CorralizaIRecruiting specialized macrophages across the borders to restore brain functionsFront Cell Neurosci2014826225228859
- OwensTBechmannIEngelhardtBPerivascular spaces and the two steps to neuroinflammationJ Neuropathol Exp Neurol200867121113112119018243
- EngelhardtBRansohoffRMCapture, crawl, cross: the T cell code to breach the blood-brain barriersTrends Immunol2012331257958922926201
- LampronAElaliARivestSInnate immunity in the CNS: redefining the relationship between the CNS and its environmentNeuron201378221423223622060
- WilsonEHWeningerWHunterCATrafficking of immune cells in the central nervous systemJ Clin Invest201012051368137920440079
- IliffJJWangMLiaoYA paravascular pathway facilitates CSF flow through the brain parenchyma and the clearance of interstitial solutes, including amyloid betaSci Transl Med20124147147ra111
- HandinRILuxSEStosselTPBlood: Principles and Practice of Hematology2nd edPhiladelphia, PA, USALippincott Williams and Wilkins2003
- ZanganehSHutterGSpitlerRIron oxide nanoparticles inhibit tumour growth by inducing pro-inflammatory macrophage polarization in tumour tissuesNat Nanotechnol2016111198699527668795
- MaudeSLFreyNShawPAChimeric antigen receptor T cells for sustained remissions in leukemiaN Engl J Med2014371161507151725317870