
Abstract
Purpose
Icariin (ICA) is one of the main active constituents of Herba Epimedii for improving osteogenesis. It is necessary to create a simple and efficient method to load ICA onto the surface of titanium (Ti) implant. The purpose of this study was to establish a local ICA delivery system via a layer-by-layer (LbL) self-assembly system on phase-transited lysozyme (PTL)-primed Ti surface.
Materials and methods
A PTL nanofilm was first firmly coated on the pristine Ti. Then, the ICA-loaded hyaluronic acid/chitosan (HA/CS) multilayer was applied via the LbL system to form the HA/CS-ICA surface. This established HA/CS-ICA surface was characterized by scanning electron microscopy (SEM), X-ray photoelectron spectroscopy (XPS) and contact angle measurement. The ICA release pattern of the HA/CS-ICA surface was also examined. MC3T3-E1 osteoblast culture test and a rat model were used to evaluate the effects of the HA/CS-ICA surface in vitro and in vivo.
Results
SEM, XPS and contact angle measurement demonstrated successful fabrication of the HA/CS-ICA surface. The HA/CS-ICA surfaces with different ICA concentrations revealed a controlled release profile of ICA during a 2-week monitoring span. Osteoblasts grown on the coated substrates displayed higher adhesion, viability, proliferation and ALP activity than those on the polished Ti surface. Furthermore, in vivo histological evaluation revealed much obvious bone formation in the ICA-coated group by histological staining and double fluorescent labeling at 2 weeks after implantation.
Conclusion
The present study demonstrated that ICA-immobilized HA/CS multilayer on the PTL-primed Ti surface had a sustained release pattern of ICA which could promote the osteogenesis of osteoblasts in vitro and improve early osseointegration in vivo. This study provides a novel method for creating a sustained ICA delivery system to improve osteoblast response and osseointegration.
Introduction
Titanium (Ti) and its alloys are considered the most widely used biomaterials for dental implants.Citation1 However, the long time period required for osseointegration between Ti implant and surrounding tissue has limited the clinical applications of these materials.Citation2 Additionally, higher failure rates are observed in patients suffering from systematic problems including osteoporosis and diabetes mellitus (DM).Citation3,Citation4 Bioactive surfaces are important for the regulation of a range of cell behaviors, such as cell adhesion, proliferation and differentiation.Citation5 Therefore, it is essential to construct suitable bioactive surfaces and develop functional implants.Citation6 Different methods have been employed for surface modification, such as physical methods (freeze-drying, three-dimensional printing, sandblasting),Citation7–Citation9 chemical methods (anodic oxidation, acid etching, alkali treatment)Citation10–Citation12 and biological methods (functional proteins, growth factors, peptides).Citation13–Citation15 Nevertheless, these methods have many disadvantages such as pollution creation, expensive equipment, complexity of operation, high cost and short duration of bioactivity after exposure to the surrounding environment, limiting the clinical applications of these bioactive agents.Citation16,Citation17 To overcome such disadvantages, it is extraordinarily necessary to develop a new method for modifying dental implant surfaces.Citation5
In this study, we employed phase-transited lysozyme (PTL), a pretreated base layer on the Ti surface to provide an activated surface to achieve high binding force.Citation18 The one-step modification using PTL provides a new approach superior to the traditional method of using dopamine, which is characterized by simple and rapid preparation, green technology, less expensive and less discoloration.Citation19,Citation20 The transition process of lysozyme is based on the β-sheet of lysozyme microfibers.Citation21 An amyloid-like microfiber net, which tightly adheres to Ti surfaces, can form according to this transition. The surface of the PTL nanofilm is rich in a series of functional groups (carboxyl, amide, thiol, etc.), which provide great opportunities for subsequent modifications.
Active compounds have been widely used to improve bone regeneration ability.Citation13–Citation15 In the present study, icariin (ICA, the main active ingredient of Herba Epimedii) was chosen, because it is one of the widely used traditional Chinese medicines for treating osteoporosis and promoting bone healing.Citation22 It has been suggested that ICA could enhance pre-osteoblast proliferation, differentiation, mineralization and the expression of bone-related genes and proteins.Citation23–Citation25 Moreover, ICA possibly exerts its osteogenic effects through the induction of BMP-2 gene expression.Citation26 Thus, it is deemed that ICA has the potency to promote osteoblastic activities.
Several studies have investigated the modification of biomaterials with ICA. ICA could be mixed with chitosan (CS)/hydroxyapatite to develop a new bone repair scaffold, which showed great osteogenic activity and promoted new bone formation.Citation7 β-tricalcium phosphate (β-TCP) ceramic has been used extensively as substitution material for bone defect repair.Citation27,Citation28 ICA could also be loaded onto porous β-TCP using soaking method, and new bone formation in ICA-β-TCP scaffolds could be observed.Citation29 Although various methods have been used to incorporate ICA into biomaterials, it is mainly used as a bone tissue-engineering scaffold; few studies have reported its application in Ti implants. Although TiO2 nanotubes (TNTs) fabricated on Ti implant surfaces have been successfully exploited as a drug controlled release system for loading functional molecules such as BMP-2 and ICA,Citation10,Citation30 the fabrication process is relatively complicated and may create pollution. Moreover, for optimum local bone healing, ICA should be applied at a definite concentration. Thus, it is necessary to create a simple and clean method for loading ICA onto the surface of Ti implants and investigate the effects of the controlled release of ICA on osteoblast proliferation and differentiation.
Layer-by-layer (LbL) self-assembly system has recently been explored as a convenient and green drug controlled release system.Citation31,Citation32 The system is composed of negatively charged and positively charged polyelectrolytes that form a multilayer thin film through electrostatic attractions. However, it is necessary to pretreat the Ti surface to firmly immobilize such multilayers. A PTL nanofilm coated onto the Ti surface could link multilayers formed via the LbL system due to electrostatic interaction between positively charged PTL and negatively charged polyelectrolytes. Thus, in this study, natural, nontoxic and negatively charged hyaluronic acid (HA) and positively charged CS, which are both biocompatible and biodegradable, were used to fabricate the multilayer via the LbL system. Furthermore, CS layers were used to load ICA for prolonged drug release, because ICA can adhere to the surface of CS, be encapsulated by CS or be stored in micro-interspaces of the materials.Citation7,Citation33,Citation34 Thus, in the present study, the LbL system was used to load bone-active agent ICA onto the Ti surface to achieve sustained drug release for weeks.
The current study was designed to establish an ICA-loaded HA/CS multilayer on the Ti surface via the LbL system, with PTL as the novel interlayer for bonding. The aim of the present study was to test the hypothesis that the ICA delivery system fabricated on PTL-primed Ti surface via the LbL system could achieve sustained drug release and improve osteogenic activity. To test the hypothesis, the surface characterization and in vitro drug release of ICA on the PTL-primed ICA-immobilized HA/CS multilayer were evaluated by scanning electron microscopy (SEM), X-ray photoelectron spectroscopy (XPS), contact angle measurement and drug release test. MC3T3-E1 osteoblasts were used to examine the cell response in vitro. Cell morphology, viability, proliferation and differentiation ability were observed by immunofluorescence staining, cell cytotoxicity test, cell counting kit-8 (CCK-8) and ALP activity assay, respectively. Moreover, an in vivo rat animal experiment was performed, and histological analysis was used to examine the osseointegration ability of the aforementioned ICA-immobilized HA/CS multilayer on PTL-primed Ti rods. The approach presented in this study provides a new method for Ti surface modification to promote osteoblast function in vitro and improve bone formation in vivo.
Materials and methods
Materials
Commercial pure Ti (99.99% pure) was provided by Baoji Titanium Industry (Baoji, Shanxi, China). ICA was obtained from Shanghai Tauto Biotech (Shanghai, China). Lysozyme and Tris (2-carboxyethyl) phosphine hydrochloride (TCEP) were purchased from Sigma-Aldrich Co. (St Louis, MO, USA). CS, HA and HEPES buffer (pH =7.4, sterilized) were obtained from Solarbio (Beijing, China). Minimum essential medium eagle-alpha modification (α-MEM) and PBS were purchased from HyClone (South Logan, UT, USA). FBS, penicillin–streptomycin and trypsin were obtained from Thermo Fisher Scientific (Waltham, MA, USA).
Specimen preparation
Fabrication of the PTL nanofilm
Ti disks with a diameter of 14 mm and a height of 1 mm were sequentially polished with 320, 400, 800 and 1,200 grit sandpaper in turn. Then, the disks were successively washed with acetone, ethanol and deionized water. Subsequently, the disks were dried for 1 hour at room temperature.
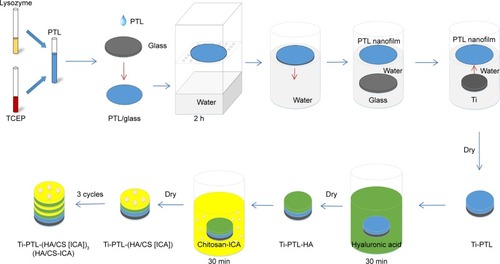
To functionalize the surface of the Ti disks with PTL nanofilm, lysozyme (10 mg/mL in 10 mM HEPES buffer, pH 7.4) was mixed with an equal volume of TCEP (50 mM in 10 mM HEPES buffer, pH 6.2) to obtain a PTL buffer. We used circular glass disks (Φ24 mm) and Ti disks (Φ14 mm) with different diameters. The PTL buffer was dropped onto the clean glass disk and incubated at room temperature for 2 hours to form a PTL nanofilm coating on the surface of the glass. To avoid evaporation, the glass disk with PTL buffer was kept inside a covered container with water at the bottom of the container during the incubation. Subsequently, the glass disk was placed into distilled water, allowing the PTL nanofilm to separate from the glass disk. Then, the floating PTL nanofilm (Φ24 mm) was attached to the surface of a Ti disk (Φ14 mm). Since the diameter of the Ti disk (Φ14 mm) was smaller than that of the glass disk (Φ24 mm), the film overcovered the Ti disk, and the excess was removed. After that, the Ti disk coated by the PTL nanofilm was dried at room temperature ().
Figure 1 Schematic diagram of in vitro sample preparation: the process of fabricating the HA/CS-ICA multilayer coatings on the PTL-primed Ti disk surfaces.
Abbreviations: CS, chitosan; HA, hyaluronic acid; ICA, icariin; PTL, phase-transited lysozyme; TCEP, Tris (2-carboxyethyl) phosphine hydrochloride; Ti, titanium.
Preparation of multilayer coatings on the PTL nanofilm-primed Ti substrates
CS solution was prepared by dissolving 0.1% (W/V) CS in a 1% (V/V) acetic acid solution under stirring. Next, ICA was dissolved in the CS solution under stirring. Four groups with different ICA concentrations of 0, 0.5×10⁻³ mol/L (ICA-low dose, ICA-L), 1×10⁻³ mol/L (ICA-middle dose, ICA-M) and 2×10⁻³ mol/L (ICA-high dose, ICA-H) were prepared. HA solution (1 mg/mL) was prepared with deionized water under stirring.
Briefly, Ti disks covered with PTL nanofilm were dipped into different polyelectrolyte solutions at room temperature. First, the treated Ti samples were immersed in the HA solution for 30 minutes and dried at room temperature for 4 hours, denoted as Ti-PTL-HA. Then, the samples were immersed in the CS solution with different concentrations of ICA, as mentioned earlier and dried at room temperature for 4 hours. After that, one cycle was completed to form Ti-PTL-HA-CS, Ti-PTL-(HA/CS [ICA-L]), Ti-PTL-(HA/CS [ICA-M]) and Ti-PTL-(HA/CS [ICA-H]). Then, the cycle was repeated three times until the desired multilayer coating was obtained, forming Ti-PTL-(HA/CS)3, Ti-PTL-(HA/CS [ICA-L])3, Ti-PTL-(HA/CS [ICA-M])3 and Ti-PTL-(HA/CS [ICA-H])3, designated as HA/CS, HA/CS-ICA-L, HA/CS-ICA-M and HA/CS-ICA-H, respectively ().
Surface characterization
The typical surface topography of Ti, Ti-PTL, Ti-PTL-HA, Ti-PTL-HA-CS, HA/CS and HA/CS-ICA-L was observed using SEM (S4800; Hitachi Ltd., Tokyo, Japan). The chemical composition of all the samples was measured by XPS (AXIS Nova; Kratos Analytical, Manchester, UK). The wettability of the specimen surface was assessed through contact angle measurements using the deionized water at room temperature. A drop volume of 2 µL was used, and the drop image was acquired using a digital camera (JGW-360A; Chongda Intelligent Technology, Xiamen, China). The data were analyzed using image analysis software (Anglem; Chongda Intelligent Technology).
Drug release profiles in vitro
To generate a standard curve, solutions of ICA in PBS, with known concentrations (0, 0.5, 1, 2, 4, 10 and 20 µg/mL), were characterized by High Performance Liquid Chromatography system (HPLC; 1,100 series; Agilent Technologies, Santa Clara, CA, USA). The drug concentration in the solution was calculated based on the standard curve. Drug release experiments were performed by immersing the samples in PBS (pH 7.4) at 37°C. At the predetermined time point, the supernatant was removed and the solution was analyzed by the HPLC system. Next, the samples were immersed in fresh PBS and incubated until the next time point. This test period lasted for 14 days. The percentage of drug release was calculated by dividing the accumulated amount of released drug by the total amount of drug loaded. The total amount of drug loaded was the amount of drug released at the end of experiment.
Cell culture
MC3T3-E1 cells (American Type Culture Collection [ATCC], Manassas, VA, USA) were cultured in α-MEM supplemented with 10% FBS and 1% penicillin–streptomycin in a 5% CO2incubator (Thermo Fisher Scientific) at 37°C. The samples (Ti, HA/CS, HA/CS-ICA-L, HA/CS-ICA-M and HA/CS-ICA-H) were sterilized using a 25 kGy dose of gamma radiation (cobalt-60; Huanming Gaoke Fuzhao Co., Tianjin, China).
Cell adhesion
Cells were seeded onto different samples at a density of 1×10⁴ cells/well. The samples were rinsed with PBS to remove non-adherent cells after being cultured for 24 hours. Then, the cells were fixed with paraformaldehyde (Solarbio) and permeabilized with 0.25% Triton X-100 (Solarbio). The nuclei were stained with DAPI (Thermo Fisher Scientific), and the cytoskeleton was stained with rhodamine-phalloidin (Thermo Fisher Scientific). Fluorescence imaging was performed using confocal laser scanning microscopy (CLSM; FV1000; Olympus Corporation, Tokyo, Japan). The nucleus was stained blue, and the cytoskeleton was red in color. The cell numbers in three random fields were counted under a fluorescence microscope (IX71; Olympus Corporation).
Live/dead assay
The viability of MC3T3-E1 cells on the prepared surfaces was determined by live/dead assay using acridine orange/ethidium bromide (AO/EB; Solarbio) double fluorescence staining. The AO and EB dyes were combined with the DNA of live and dead cells to show the cell viability of MC3T3-E1 cells, allowing one to distinguish live cells (green) and dead cells (red).Citation35 As described earlier, MC3T3-E1 cells were seeded onto the surfaces of the different groups. After 3 and 7 days of culture, the samples were rinsed with PBS and then stained with 1 mL PBS containing 10 µL AO solution and 10 µL EB solution for 5 minutes. The samples were observed by CLSM (FV1000; Olympus Corporation).
Cell proliferation assay
Cell proliferation was assessed by using CCK-8 according to the manufacturer’s instructions (Dojindo Molecular Technologies, Kumamoto, Japan). Cells were seeded onto different samples at a density of 1×10⁴ cells/well. At 3 and 7 days after seeding, 1 mL of α-MEM together with 100 µL of CCK-8 solution was added to each well and incubated at 37°C for 1.5 hours. Then, 110 µL of reserved solution was transferred to new 96-well plates, and the absorbance at 450 nm of each well was measured using a microplate reader (Cytation 5; BioTek, Winooski, VT, USA).
ALP activity test
ALP activity was evaluated after 3, 7 and 14 days of cultivation using an ALP activity kit (Jiancheng, Nanjing, China). Briefly, MC3T3-E1 cells were seeded onto different surfaces at a density of 1×10⁴ cells/well in 1 mL of culture medium. The cells were lysed in 1% Triton X-100 through the freeze– thaw cycles to obtain cell suspension after 3, 7 and 14 days of culture. The ALP activity was determined by measuring the absorption value at 520 nm at 37°C using a microplate reader (Cytation 5; BioTek). The protein concentrations were evaluated using the bicinchoninic acid (BCA) assay kit (Solarbio). The absorbance of the solution was measured at 562 nm, and the amount of total protein was calculated using a standard curve. To determine the ALP activity, the amount of ALP was normalized to the amount of total proteins synthesized.
In vivo experiments
Animal experiments were carried out in accordance with the Guide for the Care and Use of Laboratory Animals of the National Institutes of Health and were approved by the Animal Ethical and Welfare Committee (AEWC) of Tianjin Medical University. Twenty 12-week-old male Sprague Dawley rats (364±34 g) were obtained from the Model Animal Center of the Radiological Medicine Research Institute, Chinese Academy of Medical Science. The animals were randomly divided into the Ti group and ICA-loaded group. The animals were housed at 25°C with a humidity of 55% and allowed free access to tap water and standard rodent food on a 12-hour alternating light–dark cycle.
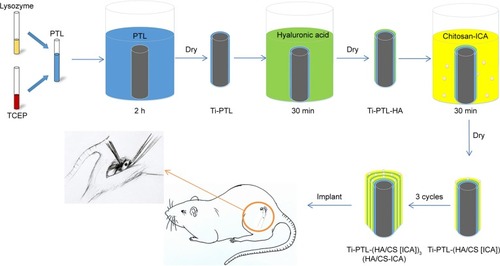
Cylindrical pure Ti rods, 2 mm in diameter and 2 mm in length, were used as implants in the animal experiments. The rods in the ICA-loaded group were prepared by immersion in 1×10⁻³ mol/L ICA solution, as shown in . After 1 week of acclimation, surgery was conducted under general anesthesia induced by the intraperitoneal administration of sodium pentobarbital (50 mg/kg body weight). The right hind limbs of rats were shaved, and the skin and muscle tissues were then incised. The midshafts of the femora were exposed. Then, holes were carefully made perpendicular to the surface of the femora using a motorized dental drill (Φ=2 mm). All steps were performed under isotonic saline solution irrigation to cool the operation site. The implant rods of the Ti and ICA-loaded groups were separately implanted into the femora of rats. After that, the skin and muscle tissues were cleaned and sutured.
Figure 2 Schematic diagram of in vivo sample preparation: the process of fabricating the HA/CS-ICA multilayer coatings on the PTL-primed Ti implant rods.
Abbreviations: CS, chitosan; HA, hyaluronic acid; ICA, icariin; PTL, phase-transited lysozyme; TCEP, Tris (2-carboxyethyl) phosphine hydrochloride; Ti, titanium.
To clearly reveal the dynamic process of new bone formation, we employed fluorescent labeling staining.Citation36 Briefly, the animals were intraperitoneally injected with 30 mg/kg body weight tetracycline hydrochloride (TCH; Sangon, Shanghai, China) 10 and 9 days before sacrifice to show the osteogenesis effect in the first week after the operation. In addition, calcein (CA; 10 mg/kg body weight; Sangon) was administered to the animals 3 and 2 days before sacrifice to show the osteogenesis effect during the second week after the operation.Citation37
Two weeks after implantation, the rats were sacrificed through an overdose of sodium pentobarbital. Then, the femora containing implants were harvested and fixed in 10% formalin solution (Solarbio) for 7 days. Subsequently, the samples were divided into two groups at random.
Undecalcified tissue blocks were treated as follows. The tissues were processed in Technovit 7200 VLC (Heraeus Kulzer GmbH, Wehrheim, Germany) and then embedded in a fresh solution of the same resin. After polymerization, the samples with implants were glued to microscope slides and cut along the long axis of the implant using a precision saw (E310CP; Exakt, Norderstedt, Germany) at approximately 100 µm. Grinding was performed with grinding machine (E400CS; Exakt) using abrasive paper (1,000, 2,500 and 4,000 grit) to achieve a sample thickness of 50 µm. After that, the fluorescence staining of the sections was observed using CSLM (IX83; Olympus Corporation). Then, new sections were further stained with H&E (Solarbio) and toluidine blue (TB; Solarbio). The histological sections were observed and imaged under an optical microscope with a digital camera (NI-E; Nikon Corporation, Tokyo, Japan).
For the decalcified group, specimens were treated with EDTA (Sangon) for decalcification. Then, the implantable rods of different groups were removed from the femora. After that, the samples were dehydrated and embedded in paraffin and sections were prepared. The sections were then stained with H&E and Masson’s trichrome (Solarbio) for observation using an optical microscope with a digital camera (NI-E).
Bone apposition analysis was performed using an image analyzer (Image Pro-Plus 6.0; Media Cybernetics, Silver Spring, MD, USA) to evaluate new bone formation in defined areas based on H&E staining of decalcified tissue sections. The results were expressed as the area percentage of bone formation (BF%). The BF% was defined as the area of newly formed bone divided by the defect area extending 100 µm from the implant surface.Citation38,Citation39
Statistical analyses
All quantitative data were expressed as mean ± SD, and statistical analyses were performed using SPSS software, version 17.0 (SPSS Inc., Chicago, IL, USA). Statistical significance was determined using a one-way ANOVA followed by the Student–Newman–Keuls post hoc test. The significance level for statistical tests was set at α=0.05. Values of P<0.05 were considered to indicate statistical significance.
Results
Surface characterization
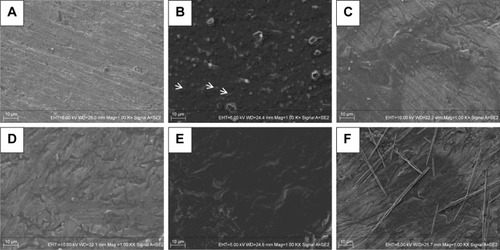
SEM images are shown in . The SEM images illustrated that the PTL nanofilm had a topography consisting of many nanosphere structures (indicated by arrows), which gathered together to form a homogeneous nanofilm and adhered stably to the Ti surface (). TCEP is a disulfide bond-reducing agent, and a high concentration of TCEP accelerated the reduction in disulfide bonds for local protein unfolding.Citation40 Lysozyme could be mixed with TCEP buffer to form a unique change called phase transition. The disulfide bonds of the native lysozyme chain were reduced by TCEP, causing the α-helix of lysozyme to unfold into a β-sheet structure, resulting in the formation of amyloid nanospheres.Citation41 Micro-holes (indicated by asterisks) were formed in the middle of the PTL nanofilm through the contraction of the nanofilm during the drying step. The HA-CS monolayer () was smoother than the initial PTL-primed Ti surface (). In addition, the multilayer coating of HA/CS formed by the LbL system () appeared to be much smoother than the monolayer (). shows that the ICA was successfully loaded, displaying needle-like configuration.
Figure 3 SEM images of different surfaces.
Notes: SEM images of (A) Ti; (B) Ti-PTL, Ti after PTL priming; (C) Ti-PTL-HA, Ti-PTL nanofilm after single HA coating; (D) Ti-PTL-HA-CS, Ti-PTL nanofilm after HA-CS coating; (E) HA/CS, Ti-PTL nanofilm coated with multilayer of HA-CS; (F) HA/CS-ICA-L, Ti-PTL nanofilm coated with multilayer of HA-CS with ICA immobilization. Arrow indicates nanosphere structure, asterisk indicates micro-holes.
Abbreviations: CS, chitosan; HA, hyaluronic acid; ICA, icariin; ICA-L, ICA-low dose; PTL, phase-transited lysozyme; SEM, scanning electron microscopy; Ti, titanium.
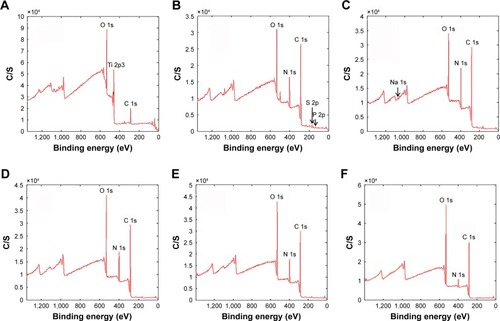
The XPS spectra of different samples are shown in . The wide scan spectrum of the smooth Ti () shows that the chief components included C 1s (284.8 eV), Ti 2p3 (458.5 eV) and O 1s (530.0 eV). The distinctive peaks of P 2p (132.0 eV) and S 2p (164.0 eV) originated from TCEP, and the peak of N 1s (400.0 eV) was derived from lysozyme. Since TCEP and lysozyme are both raw materials of PTL nanofilm, the first appearance of the P 2p, S 2p and N 1s peaks as shown in indicated the successful immobilization of the PTL nanofilm on the Ti surface. In addition, the disappearance of the Ti peak further suggested that the PTL nanofilm had covered the Ti base (). As shown in , the spectrum peak of Na 1s (1,072.0 eV) originated from HA indicating that the HA had been immobilized on the PTL-primed Ti surface. The disappearance of the Na 1s peak as shown in demonstrated that the CS attracted to the HA surface had covered the HA layer. As the number of HA-CS layers increased, the peaks of C 1s, O 1s and N 1s showed no obvious change (). The N 1s peak decreased and the O 1s peak increased after further modification with ICA. Since there are plentiful hydroxyl groups and no nitrogen in the ICA molecule (C33H40O15), these results provide evidence that the ICA had been successfully deposited on the Ti substrate ().
Figure 4 Surface chemical composition analyses by XPS.
Notes: XPS wide scan spectra of (A) Ti; (B) Ti-PTL, Ti after PTL priming; (C) Ti-PTL-HA, Ti-PTL nanofilm after single HA coating; (D) Ti-PTL-HA-CS, Ti-PTL nanofilm after HA-CS coating; (E) HA/CS, Ti-PTL nanofilm coated with multilayer of HA/CS; (F) HA/CS-ICA-L, Ti-PTL nanofilm coated with multilayer of HA-CS with ICA-L immobilization.
Abbreviations: CS, chitosan; HA, hyaluronic acid; ICA-L, icariin-low dose; PTL, phase-transited lysozyme; Ti, titanium; XPS, X-ray photoelectron spectroscopy.
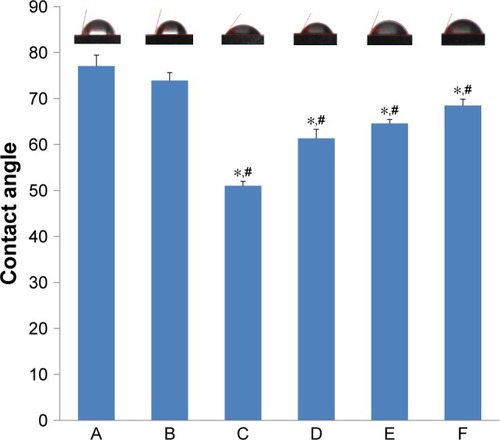
In addition to surface topography, hydrophilicity is an important factor that affects the biological behaviors of osteoblasts. The hydrophilicity of the Ti, Ti-PTL, HA/CS and HA/CS-ICA (including HA/CS-ICA-L, HA/CS-ICA-M and HA/CS-ICA-H) surfaces is shown in . It is demonstrated that PTL slightly increased the hydrophilicity of the Ti surface, with the contact angle decreasing from 77.1°±2.4° (Ti) to 73.9°±1.7° (Ti-PTL). Moreover, after the HA/CS multilayer was employed, the contact angle sharply decreased from 73.9°±1.7° (Ti-PTL) to 51.0°±1.0° (HA/CS). The contact angle of samples with different ICA concentrations gradually increased from 61.4°±2.0° (HA/CS-ICA-L) through 64.6°±0.9° (HA/CS-ICA-M) to 68.5°±1.4° (HA/CS-ICA-H) due to the hydrophobic property of ICA. Although the immobilization of ICA relatively increased the contact angle, the contact angles of HA/CS-ICA layers with three different ICA concentrations were all lower than those of the pure Ti surface and Ti-PTL surface, indicating an improvement in the hydrophilicity of the ICA-immobilized multilayer of HA/CS multilayer, with statistical significances (P<0.05).
Figure 5 Contact angles of various samples.
Notes: A, Ti; B, Ti-PTL; C, HA/CS; D, HA/CS-ICA-L; E, HA/CS-ICA-M; F, HA/CS-ICA-H. Data are expressed as mean ± SD (n=3). *A statistical significance compared to the Ti group (P<0.05). #A statistical significance compared to the Ti-PTL group (P<0.05).
Abbreviations: CS, chitosan; HA, hyaluronic acid; ICA-H, icariin-high dose; ICA-L, icariin-low dose; ICA-M, icariin-middle dose; PTL, phase-transited lysozyme; Ti, titanium.
In vitro ICA release profile
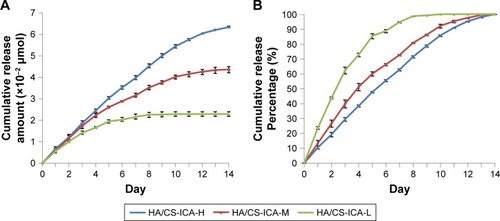
As shown in , the cumulative release amount of ICA follows the order of HA/CS-ICA-H>HA/CS-ICA-M>HA/CS-ICA-L. A sustained release was observed in the HA/CS-ICA-H and HA/CS-ICA-M groups during the 14-day period. On the other hand, ICA in the HA/CS-ICA-L group was released much faster and reached a plateau as early as day 10. shows the percentage of ICA release. The results indicated that the HA/CS-ICA-H group exhibited a cumulative drug release of 55.5%±0.7% during the first 7 days, whereas the HA/CS-ICA-M group showed 66.2%±0.8% release and the HA/CS-ICA-L group showed 88.5%±1.1% release within the same time span. The results indicated that the HA/CS-ICA-L group displayed a faster drug release pattern, while the HA/CS-ICA-M and HA/CS-ICA-H groups showed a better sustained drug release pattern.
Figure 6 In vitro release profile of HA/CS multilayer surfaces with different concentrations of ICA.
Notes: (A) Cumulative release amount. (B) Cumulative release percentage. Data are expressed as mean ± SD (n=3).
Abbreviations: CS, chitosan; HA, hyaluronic acid; ICA, icariin; ICA-H, ICA-high dose; ICA-L, ICA-low dose; ICA-M, ICA-middle dose.
Cell adhesion
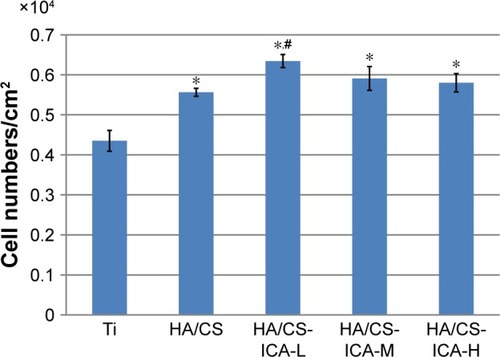
Cell adhesion is important for cell-implant interactions. Cell adhesion morphology was observed by immunofluorescence staining of cytoskeleton actin. The CLSM images of MC3T3-E1 cells seeded on different samples are shown in . After 24 hours of culture, MC3T3-E1 cells oriented parallel to the grinding marks on the Ti surface, which was attributed to contact guidance. However, on the HA/CS multilayer surface, the cells showed different morphology patterns compared to those on the Ti surface. In all the HA/CS-ICA groups, cells exhibited a spread-out appearance, with stretched filopodia. It was noteworthy that, on the HA/CS-ICA-L surface, much well-spread cell shape was observed with many filopodia growing into the surfaces as the cells became flattened, which suggested better cell adhesion of cells on the HA/CS-ICA-L surface among the three HA/CS-ICA groups. shows the cell numbers on different samples at 24 hours of culture. In this study, more cells were adhered to the HA/CS and HA/CS-ICA surfaces than the smooth Ti surface, with a statistical difference (P<0.05). These results displayed that both the HA/CS coating and ICA addition could promote cell adhesion. In addition, the significantly higher cell number on the HA/CS-ICA-L surface suggested that the HA/CS loaded with a certain concentration of ICA could further increase cell adhesion.
Figure 7 CLSM images of MC3T3-E1 cells cultured on different surfaces for 24 hours.
Note: Images of cells stained with DAPI to show the nuclei (blue) and rhodamine-phalloidin to show the cytoskeleton (red).
Abbreviations: CLSM, confocal laser scanning microscopy; CS, chitosan; HA, hyaluronic acid; ICA-H, icariin-high dose; ICA-L, icariin-low dose; ICA-M, icariin-middle dose; Ti, titanium.
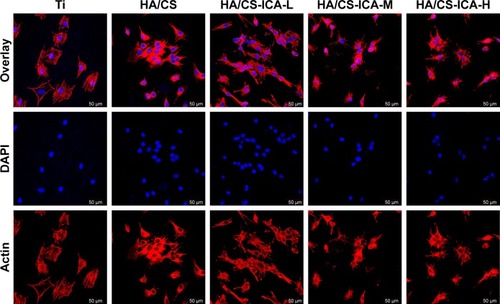
Figure 8 Cell counting of adherent MC3T3-E1 cells grown on different surfaces for 24 hours.
Notes: Data are expressed as mean ± SD (n=3). *A statistical significance compared to the Ti group (P<0.05). #A statistical significance compared to the HA/CS multilayer group (P<0.05).
Abbreviations: CS, chitosan; HA, hyaluronic acid; ICA-H, icariin-high dose; ICA-L, icariin-low dose; ICA-M, icariin-middle dose; Ti, titanium.
Cell viability
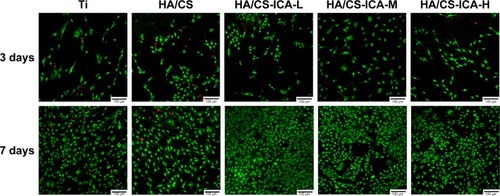
It is crucial to maintain cell survival and reduce cell death. The AO/EB staining was used to examine the viability of MC3T3-E1 cells by the DNA-binding dyes AO and EB ().Citation35 After 3 days of cultivation, the dead cells with red nuclei could be observed in all samples, especially with higher percentages of dead cells in the Ti and the HA/CS-only samples. Compared to the Ti and the HA/CS-only samples, the HA/CS-ICA samples had more viable cells. For the HA/CS-ICA samples, the number of living cells increased slightly further as the ICA concentration decreased. After 7 days of cultivation, the number of living cells further increased compared to that of the 3-day culture. More viable cells and fewer dead cells were observed in the HA/CS-ICA samples, especially in the HA/CS-ICA-L group. This finding suggests that although the viable cell numbers increased as the ICA concentration decreased, no cytotoxicity was detected in the high ICA concentration group.
Figure 9 Live/dead staining of MC3T3-E1 cells on different surfaces after 3 and 7 days of culture.
Note: MC3T3-E1 cells were stained with AO (live cells, green) and EB (dead cells, red) on the Ti, HA/CS, HA/CS-ICA-L, HA/CS-ICA-M and HA/CS-ICA-H surfaces for 3 and 7 days.
Abbreviations: AO, acridine orange; CS, chitosan; EB, ethidium bromide; HA, hyaluronic acid; ICA-H, icariin-high dose; ICA-L, icariin-low dose; ICA-M, icariin-middle dose; Ti, titanium.
Cell proliferation
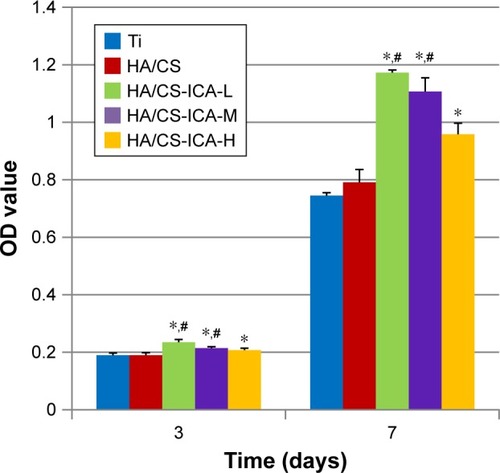
The CCK-8 assay was performed at day 3 and day 7 to evaluate the proliferation ability of MC3T3-E1 cells. As shown in , at 3 days after seeding, cells on the HA/CS-ICA surfaces presented a relatively higher level of proliferation ability than those on the Ti and HA/CS surfaces. Among the three ICA-immobilized groups, the cell proliferation ability tends to increase as the ICA concentration decreased, although no statistical differences were detected. It was observed that the OD values of MC3T3-E1 cells in all the groups increased with prolonged seeding time. After 7 days of cultivation, the OD values of the HA/CS-ICA samples were all higher than those of the Ti group (P<0.05). Moreover, the OD values of the HA/CS-ICA samples with low and middle ICA concentrations were also higher than those of the HA/CS samples, with the OD value being inversely proportional to the ICA concentration (P<0.05).
Figure 10 The CCK-8 assay results of MC3T3-E1 cells cultured on different surfaces for 3 and 7 days.
Notes: Data are expressed as mean ± SD (n=3). *A statistical significance compared to the Ti group (P<0.05). #A statistical significance compared to the HA/CS multilayer group (P<0.05).
Abbreviations: CCK-8, cell counting kit-8; CS, chitosan; HA, hyaluronic acid; ICA-H, icariin-high dose; ICA-L, icariin-low dose; ICA-M, icariin-middle dose; Ti, titanium.
Cell differentiation
ALP can be used as an early marker of osteogenic differentiation. The ALP activity of MC3T3-E1 cells cultured on different surfaces for 3, 7 and 14 days is shown in . Compared to the Ti samples, ALP activity was enhanced in the HA/CS samples at each denoted time points. More importantly, further improvement in ALP activity was observed in the HA/CS-ICA groups after 7 days of incubation, compared to the Ti group, with statistical significance (P<0.05). Additionally, cells in the HA/CS-ICA group also showed better cell differentiation on day 7, compared to those in the HA/CS group, with a statistical significance (P<0.05).
Figure 11 ALP activity of MC3T3-E1 cells cultured on different surfaces for 3, 7 and 14 days.
Notes: Data are expressed as mean ± SD (n=3). *A statistical significance compared to the Ti group (P<0.05). #A statistical significance compared to the HA/CS multilayer group (P<0.05).
Abbreviations: ALP, alkaline phosphatase; CS, chitosan; HA, hyaluronic acid; ICA-H, icariin-high dose; ICA-L, icariin-low dose; ICA-M, icariin-middle dose; Ti, titanium.
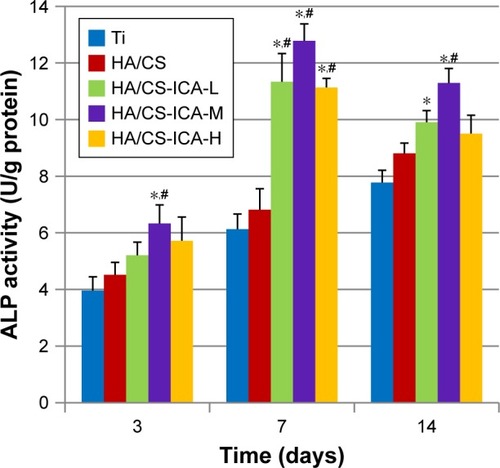
Among the HA/CS-ICA groups with different ICA concentrations, the cells in the HA/CS-ICA-M group exhibited the highest ALP activity on days 7 and 14. The ALP activity of cells cultured on all samples increased during incubation period up to 7 days. After 14 days of cell culture, the ALP activity in the HA/CS-ICA groups decreased than that at day 7; however, the ALP activity in the Ti and HA/CS groups was continuously increased, similar to previous report.Citation42
Histological assessments
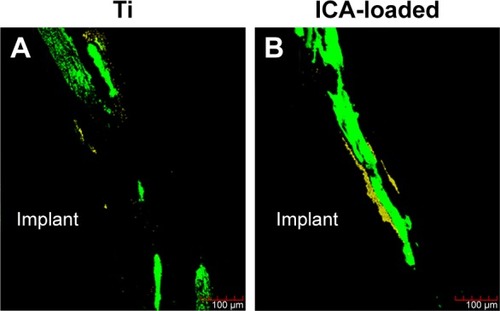
Subsequently, the ICA-loaded rods were implanted into rats to explore their effects on bone formation. At 2 weeks post implantation, new bone formation around the Ti and ICA-loaded implants was assessed by fluorescent labeling and staining. The tetracycline labeling (yellow) showed bone formation in the first week and CA staining (green) displayed the osteogenesis ability at the second week. As shown in , in both the Ti and ICA-loaded groups, the tetracycline labeling (yellow) was faint in peri-implant bone, while CA staining (green) was much easier to observe. Compared to the Ti group, the ICA-loaded group had a much wider area of CA labeling (green) and a stronger signal. The weaker CA labeling in the Ti group suggested that it had less bone formation than the ICA-loaded group at this early stage.
Figure 12 Fluorescence images of the rat femora after 2 weeks of implant placement in the Ti and ICA-loaded groups.
Notes: Images of bone combined with TCH were stained yellow and those combined with CA was stained green. The yellow (TCH) and green (CA) staining in the images indicates the bone formation and mineralization rates at 1 and 2 weeks after the operation, respectively.
Abbreviations: CA, calcein; ICA, icariin; TCH, tetracycline hydrochloride; Ti, titanium.
The undecalcified samples were also stained with H&E and TB. As shown by H&E staining (), the new bone appeared to extend from native bone to the implant in all the groups. Thin, newly formed, needle-shaped bone trabeculae were formed around the Ti implant. The gap-type interface between the implant and native bone in the Ti group was mainly connected by fibrous tissue. By contrast, a larger amount of new mineralized bone with the typical trabecular structure was detected in the ICA-loaded group. The woven bone was detected in an area close to the implant surface.
Figure 13 Histological sections of the Ti (A, B, E, F) and ICA-loaded (C, D, G, H) implants.
Notes: Bone morphology around Ti and ICA-loaded implants was observed at 2 weeks after implantation by H&E (A–D) and TB (E–H) staining. B, D, F and H depict zoomed areas of black box in A, C, E and G, respectively. Bars indicate 100 µm (A, C, E, G) and 50 µm (B, D, F, H). The black arrow denotes new bone formation; white asterisk indicates native bone; white arrow denotes collagen-rich matrix.
Abbreviations: ICA, icariin; TB, toluidine blue; Ti, titanium.
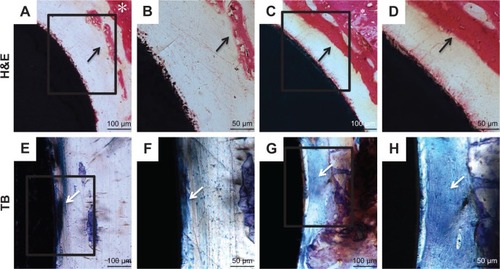
TB staining was able to reveal new bone formation by showing uniformly dark blue. shows that the implant in the ICA-loaded group was surrounded by large amounts of uniformly continuous calcified bone-like collagenous matrix, indicating bone formation on the surface of the ICA-loaded group.Citation41 In contrast, more loosely spindle-like fibrous tissue was observed on the surface of the implant in the blank Ti group.
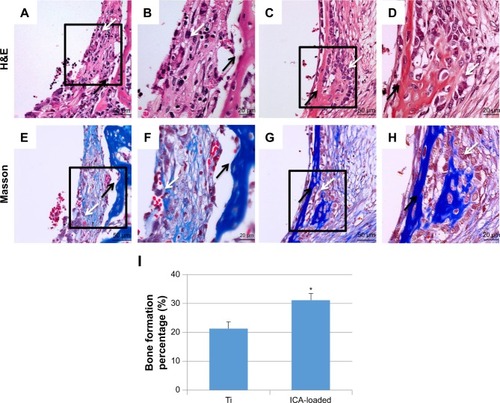
The decalcification samples were stained with H&E and Masson’s trichrome, as shown in . The newly formed bone around the Ti implant exhibited a small amount of remodeling of bone. In addition, non-mineralized fibrous tissue was observed around the Ti implants. In contrast, in the ICA-loaded group, more newly formed bone trabeculae and osteoid were observed. New bone was noted within the fibrous tissue and was characterized by globular or island-like appearance with numerous osteoblasts in the ICA-loaded group. BF% was quantified based on H&E staining of decalcified tissue sections. Bone histomorphometry revealed that the BF% of the ICA group was significantly higher than that of the Ti group after 2 weeks of implantation (). BF% was 21.3%±2.4% in the ICA group, higher than 31.2%±1.9% in the Ti group (P<0.05). The bone formation around the native bone in the ICA-loaded group was much more evident than that around the implant in the Ti group. These results indicate that the implants coated with ICA had a faster regeneration rate than the blank Ti implant.
Figure 14 Histological analysis of the decalcification samples around Ti (A, B, E, F) and ICA-loaded (C, D, G, H) implants was evaluated by H&E (A–D) and Masson (E–H) staining. Histological morphology analyses based on H&E staining after 2 weeks implantation was expressed as was BF % and shown in I.
Notes: B, D, F and H depict zoomed areas of black box in A, C, E and G, respectively. Bars indicate 50 µm (A, C, E, G) and 20 µm (B, D, F, H). The black arrow denotes new bone formation; white arrow denotes osteoblast cell. Data are expressed as mean ± SD (n=3). *A statistical significance compared to the Ti group (P<0.05).
Abbreviations: BF%, area percentage of bone formation; ICA, icariin; Ti, titanium.
Discussion
Various methods have been implemented to incorporate bioactive components onto implant surface to improve osteoinduction and bone tissue reconstruction ability.Citation43 In this study, we hypothesized that ICA loaded on PTL-primed Ti surface via the LbL system could achieve sustained ICA release and improve surface osteogenesis ability. Previous studies have shown that ICA potentially has an anabolic effect on bone to prevent osteoporosis, and ICA has been confirmed to be a bone-inductive factor.Citation44,Citation45 It has also been shown to promote osteoblast proliferation and differentiation and to increase ALP activity.Citation46,Citation47 Moreover, ICA has a high melting point (231°C), can be easily stored and can tolerate radiation sterilization without functionally changing.Citation7 All the abovementioned advantages lead us to explore the feasibility of employing ICA for surface modification of implants.
Local drug controlled release system can increase local drug effectiveness, avoid serious side effects and optimize bioavailability.Citation48 Some recent works have been published on ICA controlled release. In one study, ICA was combined with poly(lactic-co-glycolic acid) (PLGA) and β-calcium phosphate to form the PLGA/TCP/ICA scaffold to gain stable ICA release from the scaffold for bone regeneration.Citation49 ICA was also incorporated into small intestine submucosa scaffold, which showed the potential as an ICA delivery carrier for the enhancement of bone regeneration.Citation50 Another study further demonstrated that ICA could be incorporated into the nanofiber barrier by a coaxial electrospinning membrane and then could be released in a sustained and controlled manner to enhance bone regeneration.Citation51 In the abovementioned studies, ICA was either loaded into the bone tissue-engineering scaffold, encapsulated in the nanofibers or crosslinked and adhered onto nanofibers. However, to the best of our knowledge, there is little research on the direct loading of ICA onto Ti implants to improve their osteogenic property. In this study, we modified the Ti surfaces using PTL nanofilm combined with a HA/CS multilayer to load ICA onto the CS layer. PTL nanofilm is a green and simple method to pretreat the Ti surfaces for later drug loading.Citation21 CS has previously been used to load ICA as a drug controlled release system.Citation7,Citation34 In this study, the controlled release of ICA was realized because ICA can be adhered to the surface of CS, be encapsulated by CS and be stored in micro-interspaces of the materials which can be ascribed to electrostatic interaction between the reactive negative hydroxyl radical (−OH) of ICA and the positive amine groups (−NH2) of CS.Citation52 HA/CS multilayer coatings provide higher loading capacity and controlled release of osteogenic medicines to achieve a long-term effect.Citation53 The SEM and XPS results proved that the Ti surface was successfully coated with the PTL nanofilm and HA/CS-ICA multilayers.
The initial period (1–2 weeks) after implant insertion plays a critical role in guaranteeing desirable future osseointegration.Citation54,Citation55 In our study, the accumulative release amount curve of the HA/CS-ICA-L group displayed a fast release property and lasted for 10 days. On the other hand, the accumulative release amount curve of the HA/CS-ICA-M group, especially the HA/CS-ICA-H group, displayed a sustained and controlled release profile, which lasted more than 14 days. This controlled release pattern coordinates with the early postoperative osseointegration requirement.Citation56 These results suggested that it is possible to control the drug release pattern by changing the loading concentration of ICA.
In this study, we used the mouse preosteoblastic cells (MC3T3-E1), a well-established cell line, for in vitro study. It is interesting to note that the MC3T3-E1 cells that adhered to the HA/CS and HA/CS-ICA surfaces displayed an obvious difference in morphology pattern compared to that in the Ti group. Moreover, the significantly higher cell number on the HA/CS-ICA-L surface suggested that the HA/CS multilayer with certain concentration of ICA could further increase cell adhesion. These results indicated that the incorporation of HA/CS and ICA changes the cell adhesion pattern and could promote osteoblast adhesion to some extent.
CCK-8 and AO/EB assays were performed on days 3 and 7. It was observed that the number of MC3T3-E1 cells on all the samples increased with the prolonged culture indicating that HA/CS multilayers alone exhibited no cytotoxicity. Cells cultured on the HA/CS-ICA samples displayed higher viability than the HA/CS and Ti samples with the HA/CS-ICA-L samples showing the highest proliferation ability. It was observed that ICA loaded in scaffold was able to increase osteoblast proliferation at low doses (1.5×10⁻⁵ mol/L group), while samples with high doses (6×10⁻⁵ mol/L group) of ICA had lower proliferation activity.Citation57 As we know, the scaffold has a larger volume to load drugs, while the Ti implant has a smaller surface area and thickness to carry drugs. Therefore, it is reasonable to presume that the loaded drug concentration in the scaffold should be lower than that on the surface of the implant. Despite the ICA concentration used in the scaffold is relatively lower than that used in our study, similar trend is observed in both studies which displayed that the different loading concentrations lead to different effects on MC3T3-E1 cells. Several researchers have also reported that low doses (10−7, 10−8 and 10−9 mol/L) of ICA had the ability to increase MC3T3-E1 cell proliferation, although the optimal concentration remains unclear.Citation25,Citation58,Citation59 Similar to previous studies, our study revealed that the HA/CS-ICA-L samples had an appreciable effects on osteoblast proliferation and the effects were inversely proportional to the ICA concentration.
ALP is regarded as one of the early markers of osteoblast differentiation and plays an important role in bone mineralization.Citation57 The ALP activity was particularly high in the HA/CS-ICA-M group, demonstrating the highest cell differentiation ability of a certain concentration. Similar to previous study,Citation42 the ALP activities of MC3T3-E1 cells after 14 days of culture on all HA/CS-ICA surfaces were lower than those after 7 days of culture, indicating that the cell response stage shifted from the differentiation period to the next mineralization stage. The abovementioned results also demonstrated that bone growth was effectively increased on the HA/CS-ICA surfaces in the early stage of bone formation compared to that on the Ti surface.
As we know, proliferation and differentiation are contradictive aspects of cell life activity, with proliferation activity being inhibited when cells differentiate vigorously and vice versa.Citation60 Improved hydrophilicity after modification may play a significant role in facilitating cell adhesion and proliferation.Citation57 The HA/CS multilayer alone could improve surface hydrophilicity; however, the incorporation of ICA decreased the hydrophilicity to some extent, and the wettability further decreased with increasing ICA concentration, similar to previous studies.Citation30 In our study, the HA/CS-ICA-L surface showed the highest cell proliferation, while the HA/CS-ICA-M surface displayed the best differentiation ability. These results were attributed to the combined actions of the biological activity of surface hydrophilicity and the osteogenic effect of ICA.Citation26,Citation61
We next turned to in vivo experiments to explore whether ICA could induce bone formation. During the initial 1–2 weeks, inflammation and revascularization occur, which seem to be most critical processes for bone healing.Citation62 This is important because early osseointegration could provide a basis for the immediate loading of dental implants.Citation63 Other studies have also shown that woven bone appeared within the initial 2 weeks.Citation64,Citation65 Therefore, we chose 2 weeks after the operation as the observation period. Histological evaluation further confirmed the greater active deposition of mineralized bone matrix for the samples in the ICA groups than the Ti group in the animal experiments. Double fluorescence labeling was selected because this method can detect the dynamic process of new bone formation.Citation66 The faint yellow fluorescence which indicated the small amount of bone formation in the early process of implantation could be attributed to a body response including blood material interactions, inflammation and fibrosis development at the tissue/material interfaces.Citation67 The area between the implant and native bone was filled with newly formed osseous tissue in the second week, as evidenced by the presence of green fluorescence. It was shown that the area of bone calcification close to the bone side in the ICA group was higher than that of the Ti group in the second week.
Undecalcified samples stained with H&E showed more new bone around the implant surface in the ICA group than in the Ti group. TB staining also demonstrated that the region between the bone and the implant in the ICA-loaded group presented more highly aligned calcified bone-like collagen matrix than in the Ti group. The appearance of highly aligned compact collagen matrix in the ICA group indicated the potential for more bone formation in the future.Citation68
The images of decalcification samples and the BF% analysis showed that, in the ICA-loaded group, there were copious active osteoblasts and osteocytes lined on the bone trabeculae surface and increased areas of bone tissues compared to the Ti group. These may contribute to increased mechanical anchorage in the ICA-loaded group. All the abovementioned in vivo results strongly suggested the activation of bone mineralization with ICA. Our findings suggested that the ICA-loaded group increased osteogenesis, elevated new bone formation ability, accelerated the speed of local bone mineralization around the implant locally and enhanced implant stability.
Consequently, the hypothesis proven by the present study displayed that the ICA controlled release pattern was successfully formed by PTL and the HA/CS multilayer via the LbL system. Moreover, the surface modification of Ti with the ICA-loaded HA/CS multilayer could improve the osteogenic activity of osteoblast cells in vitro and enhance osseointegration in vivo. This study creates a novel principle suitable for future applications in the medical field. It would also initiate a new strategy to modify surface of Ti which has excellent osteoconductivity and osteoinductivity. Future studies are necessary to further investigate the expression patterns of osteogenesis-related proteins as well as the amount and quality of the peri-implant bone. This study will provide an improved understanding of ICA-loaded Ti surface, and it will be helpful in developing future technologies for the surface modification of dental implants.
Conclusion
This study provides information regarding the applicability of PTL nanofilm-primed HA/CS-ICA multilayer coating for dental implant modification to achieve sustained ICA delivery. It is demonstrated that controlled release of ICA can promote the adhesion, proliferation and differentiation of osteoblast cells in the early stage after implantation. Furthermore, the ICA-loaded implants also promote osseointegration in vivo. This study provides a green and controlled drug release methodology on Ti implant surface. Since the PTL nanofilm can modulate arbitrary materials, this strategy could be applied for surface modification of other implant grafts.
Acknowledgments
This study was supported by grants from the National Natural Science Foundation of China (No 31470920; No 81500886), Tianjin Natural Science Foundation (No 16JCYBJC28700) and Natural Science Foundation of Hebei Province of China (No E2017202032).
Disclosure
The authors report no conflicts of interest in this work.
References
- MiaoXWangDXuLThe response of human osteoblasts, epithelial cells, fibroblasts, macrophages and oral bacteria to nanostruc-tured titanium surfaces: a systematic studyInt J Nanomedicine2017121415143028260888
- LiXMaXYFengYFOsseointegration of chitosan coated porous titanium alloy implant by reactive oxygen species-mediated activation of the PI3K/AKT pathway under diabetic conditionsBiomaterials201536445425308520
- AlghamdiHSJansenJABone regeneration associated with non-therapeutic and therapeutic surface coatings for dental implants in osteoporosisTissue Eng Part B Rev201319323325323088597
- OztelMBilskiWMBilskiARisk Factors associated with Dental Implant Failure: A Study of 302 Implants placed in a Regional CenterJ Contemp Dent Pract201718870570928816194
- SurmenevRASurmenevaMAIvanovaAASignificance of calcium phosphate coatings for the enhancement of new bone osteogenesis – a reviewActa Biomater201410255757924211734
- DischerDEMooneyDJZandstraPWGrowth factors, matrices, and forces combine and control stem cellsScience200932459351673167719556500
- WuTNanKChenJA new bone repair scaffold combined with chitosan/hydroxyapatite and sustained releasing icariinChin Sci Bull2009541729532961
- GuanBWangHXuREstablishing Antibacterial Multilayer Films on the Surface of Direct Metal Laser Sintered Titanium Primed with Phase-Transited LysozymeSci Rep201663640827821857
- KimMHParkKChoiKHCell adhesion and in vivo osseointegration of sandblasted/acid etched/anodized dental implantsInt J Mol Sci2015165103241033625955650
- HuYCaiKLuoZTiO2 nanotubes as drug nanoreservoirs for the regulation of mobility and differentiation of mesenchymal stem cellsActa Biomater20128143944822040682
- LiLJKimSNChoSAComparison of alkaline phosphatase activity of MC3T3-E1 cells cultured on different Ti surfaces: modified sandblasted with large grit and acid-etched (MSLA), laser-treated, and laser and acid-treated Ti surfacesJ Adv Prosthodont20168323524027350860
- ReggenteMMassonPDollingerCNovel Alkali Activation of Titanium Substrates To Grow Thick and Covalently Bound PMMA LayersACS Appl Mater Interfaces20181065967597729338177
- ZhangYXiangQDongSLiCZhouYFabrication and characterization of a recombinant fibronectin/cadherin bio-inspired ceramic surface and its influence on adhesion and ossification in vitroActa Biomater20106377678519703596
- ParkJSYangHNWooDGJeonSYParkKHChondrogenesis of human mesenchymal stem cells in fibrin constructs evaluated in vitro and in nude mouse and rabbit defects modelsBiomaterials20113261495150721122912
- KangHKKimOBMinSKThe effect of the DLTIDDSYWYRI motif of the human laminin α2 chain on implant osseointegrationBiomaterials201334164027403723465831
- MengHWChienEYChienHHDental implant bioactive surface modifications and their effects on osseointegration: a reviewBiomark Res201642427999672
- WangQCaoLLiuYEvaluation of synergistic osteogenesis between icariin and BMP2 through a micro/meso hierarchical porous delivery systemInt J Nanomedicine2017127721773529089766
- YangJZhangKQueKSurface modification of titanium with hydroxyapatite layer induced by phase-transited lysozyme coatingMaterials Science and Engineering: C20189220621530184744
- MiyazakiCMPereiraTPMascagniDBde MoraesMLFerreiraMMonoamine oxidase B layer-by-layer film fabrication and characterization toward dopamine detectionMater Sci Eng C Mater Biol Appl20165831031526478315
- LiMLiuXXuZYeungKWWuSDopamine Modified Organic-Inorganic Hybrid Coating for Antimicrobial and OsteogenesisACS Appl Mater Interfaces2016849339723398127960367
- ZhongXSongYYangPTitanium Surface Priming with Phase-Transited Lysozyme to Establish a Silver Nanoparticle-Loaded Chitosan/Hyaluronic Acid Antibacterial Multilayer via Layer-by-Layer Self-AssemblyPLoS One2016111e014695726783746
- ZhangXLiuTHuangYWismeijerDLiuYIcariin: does it have an osteoinductive potential for bone tissue engineering?Phytother Res201428449850923824956
- ZhaoJOhbaSKomiyamaYShinkaiMChungUINagamuneTIcariin: a potential osteoinductive compound for bone tissue engineeringTissue Eng Part A201016123324319698057
- MaXNZhouJGeBFIcariin induces osteoblast differentiation and mineralization without dexamethasone in vitroPlanta Med201379161501150824072503
- SongLZhaoJZhangXLiHZhouYIcariin induces osteoblast proliferation, differentiation and mineralization through estrogen receptor-mediated ERK and JNK signal activationEur J Pharmacol20137141–3152223764463
- ZhaoJOhbaSShinkaiMChungUINagamuneTIcariin induces osteogenic differentiation in vitro in a BMP- and Runx2-dependent mannerBiochem Biophys Res Commun2008369244444818295595
- ParkJWKimJMLeeHJJeongSHSuhJYHanawaTBone healing with oxytocin-loaded microporous β-TCP bone substitute in ectopic bone formation model and critical-sized osseous defect of ratJ Clin Periodontol201441218119024256613
- SándorGKNumminenJWolffJAdipose stem cells used to reconstruct 13 cases with cranio-maxillofacial hard-tissue defectsStem Cells Transl Med20143453054024558162
- ZhangXGuoYLiDXThe effect of loading icariin on biocompatibility and bioactivity of porous β-TCP ceramicJ Mater Sci Mater Med201122237137921140197
- ZhangYChenLLiuCFengXWeiLShaoLSelf-assembly chitosan/gelatin composite coating on icariin-modified TiO2 nanotubes for the regulation of osteoblast bioactivityMater Des201692471479
- SmithRCRiollanoMLeungAHammondPTLayer-by-layer platform technology for small-molecule deliveryAngew Chem Int Ed Engl200948478974897719847838
- ShuklaAFlemingKEChuangHFControlling the release of peptide antimicrobial agents from surfacesBiomaterials20103182348235720004967
- WangQSWangGFZhouJGaoLNCuiYLColon targeted oral drug delivery system based on alginate-chitosan microspheres loaded with icariin in the treatment of ulcerative colitisInt J Pharm20165151–217618527713029
- YangCRChenJDPreparation and biological evaluation of chitosan-collagen-icariin composite scaffolds for neuronal regenerationNeurol Sci201334694194722833221
- ZhangEZhengLLiuJBaiBLiuCInfluence of Cu content on the cell biocompatibility of Ti-Cu sintered alloysMater Sci Eng C Mater Biol Appl20154614815725491971
- WuYCaoLXiaLEvaluation of Osteogenesis and Angiogenesis of Icariin in Local Controlled Release and Systemic Delivery for Calvarial Defect in Ovariectomized RatsSci Rep201771507728698566
- LiXFXuHZhaoYJIcariin Augments Bone Formation and Reverses the Phenotypes of Osteoprotegerin-Deficient Mice through the Activation of Wnt/β-Catenin-BMP SignalingEvid Based Complement Alternat Med2013201365231724348713
- MaïmounLBrennanTCBadoudIDubois-FerriereVRizzoliRAmmannPStrontium ranelate improves implant osseointegrationBone20104651436144120116464
- GaoYLuoEHuJXueJZhuSLiJEffect of combined local treatment with zoledronic acid and basic fibroblast growth factor on implant fixation in ovariectomized ratsBone200944222523219056525
- WuZYangPSimple Multipurpose Surface Functionalization by Phase Transited Protein AdhesionAdv Mater Interfaces2015221400401
- HaYYangJTaoFPhase-Transited Lysozyme as a Universal Route to Bioactive Hydroxyapatite Crystalline FilmAdv Funct Mater20182841704476
- JiangPLiangJSongREffect of Octacalcium-Phosphate-Modified Micro/Nanostructured Titania Surfaces on Osteoblast ResponseACS Appl Mater Interfaces2015726143841439626076385
- LeeJYNamSHImSYEnhanced bone formation by controlled growth factor delivery from chitosan-based biomaterialsJ Control Release2002781–318719711772460
- YangLLuDGuoJMengXZhangGWangFIcariin from Epi-medium brevicornum Maxim promotes the biosynthesis of estrogen by aromatase (CYP19)J Ethnopharmacol2013145371572123261485
- ZhouJChenYWangYGaoXQuDLiuCA comparative study on the metabolism of Epimedium koreanum Nakai-prenylated flavonoids in rats by an intestinal enzyme (lactase phlorizin hydrolase) and intestinal floraMolecules201319117720324368601
- MengFHLiYBXiongZLJiangZMLiFMOsteoblastic proliferative activity of Epimedium brevicornum MaximPhytomedicine200512318919315830840
- XiaoHHFungCYMokSKFlavonoids from Herba epimedii selectively activate estrogen receptor alpha (ERα) and stimulate ER-dependent osteoblastic functions in UMR-106 cellsJ Steroid Biochem Mol Biol201414314115124607839
- WuPGraingerDWDrug/device combinations for local drug therapies and infection prophylaxisBiomaterials200627112450246716337266
- LaiYCaoHWangXPorous composite scaffold incorporating osteogenic phytomolecule icariin for promoting skeletal regeneration in challenging osteonecrotic bone in rabbitsBiomaterials201815311329096397
- LiMGuQChenMZhangCChenSZhaoJControlled delivery of icariin on small intestine submucosa for bone tissue engineeringMater Sci Eng C Mater Biol Appl20177126026727987707
- YinLWangKLvXThe fabrication of an ICA-SF/PLCL nanofibrous membrane by coaxial electrospinning and its effect on bone regeneration in vitro and in vivoSci Rep201771861628819219
- ChenJPanPZhangYZhongSZhangQPreparation of chitosan/nano hydroxyapatite organic-inorganic hybrid microspheres for bone repairColloids Surf B Biointerfaces201513440140726218713
- MacdonaldMLSamuelREShahNJPaderaRFBebenYMHammondPTTissue integration of growth factor-eluting layer-by-layer polyelectrolyte multilayer coated implantsBiomaterials20113251446145321084117
- KalfasIHPrinciples of bone healingNeurosurg Focus2001104E1E4
- BastianOPillayJAlblasJLeenenLKoendermanLBlokhuisTSystemic inflammation and fracture healingJ Leukoc Biol201189566967321208896
- OffermannsVAndersenOZSillassenMA comparative in vivo study of strontium-functionalized and SLActive implant surfaces in early bone healingInt J Nanomedicine2018132189219729692613
- LiuHLiWLuoBChenXWenWZhouCIcariin immobilized electrospinning poly(l-lactide) fibrous membranes via polydopamine adhesive coating with enhanced cytocompatibility and osteogenic activityMater Sci Eng C Mater Biol Appl20177939940928629034
- LiuYHuangLHaoBUse of an Osteoblast Overload Damage Model to Probe the Effect of Icariin on the Proliferation, Differentiation and Mineralization of MC3T3-E1 Cells through the Wnt/β-Catenin Signalling PathwayCell Physiol Biochem20174141605161528355606
- HsiehTPSheuSYSunJSChenMHLiuMHIcariin isolated from Epimedium pubescens regulates osteoblasts anabolism through BMP-2, SMAD4, and Cbfa1 expressionPhytomedicine201017641442319747809
- SchmittBRingeJHäuplTBMP2 initiates chondrogenic lineage development of adult human mesenchymal stem cells in high-density cultureDifferentiation2003719–1056757714686954
- CaoHKeYZhangYZhangCJQianWZhangGLIcariin stimulates MC3T3-E1 cell proliferation and differentiation through up-regulation of bone morphogenetic protein-2Int J Mol Med201229343543922109711
- FörsterYRentschCSchneidersWSurface modification of implants in long boneBiomatter20122314915723507866
- SartorettoSCAlvesATResendeRFCalasans-MaiaJGranjeiroJMCalasans-MaiaMDEarly osseointegration driven by the surface chemistry and wettability of dental implantsJ Appl Oral Sci201523327928726221922
- KingSKlinebergILevingerIBrennan-SperanzaTCThe effect of hyperglycaemia on osseointegration: a review of animal models of diabetes mellitus and titanium implant placementArch Osteoporos20161112927637755
- KarazisisDBalloAMPetronisSThe role of well-defined nanotopography of titanium implants on osseointegration: cellular and molecular events in vivoInt J Nanomedicine2016111367138227099496
- LiXLiYPengSYeBLinWHuJEffect of zinc ions on improving implant fixation in osteoporotic boneConnect Tissue Res2013544–529029623971976
- AndersonJMRodriguezAChangDTForeign body reaction to biomaterialsSemin Immunol20082028610018162407
- NandiSKKunduBMahatoAThakurNLJoardarSNMandalBBIn vitro and in vivo evaluation of the marine sponge skeleton as a bone mimicking biomaterial. Integr Biol(Camb)201572250262