
Abstract
Background
Fluorescent carbon-based nanomaterials have promising properties such as biosensing, cell imaging, tracing and drug delivery. However, carbon dots (CDs) with specific inherent biological functions have not been investigated. Ginsenosides are the components with multiple bioactivities found in plants of the genus Panax, which have attracted a lot of attention for their anticancer effect.
Materials and methods
In this study, we prepared a kind of novel photoluminescent CDs from ginsenoside Re by one-step hydrothermal synthesis method. The conventional methods including transmission electron microscopy, Fourier transform infrared spectroscopy, HPLC and fluorescence spectrum were used for characterization of CDs. In vitro anticancer effect was investigated by cytotoxicity assay, flow cytometry and Western blot analysis.
Results
The as-prepared Re-CDs had an average diameter of 4.6±0.6 nm and excellent luminescent properties. Cellular uptake of Re-CDs was facilitated by their tiny nanosize, with evidence of their bright excitation-dependent fluorescent images. Compared with ginsenoside Re, the Re-CDs showed greater inhibition efficiency of cancer cell proliferation, with lower toxicity to the normal cells. The anticancer activity of Re-CDs was suggested to be associated with the generation of large amount of ROS and the caspase-3 related cell apoptosis.
Conclusion
Hopefully, the dual functional Re-CDs, which could both exhibit bioimaging and anticancer effect, are expected to have great potential in future clinical applications.
Introduction
Carbon dots (CDs), including graphene quantum dots and polymer dots, are zero-dimensional carbon-based nanomaterials which have interesting chemical and physical properties.Citation1–Citation3 As a kind of fluorescent material, CDs have superiorities such as excellent photostability without optical scintillation, high photoluminescence quantum yield (QY) and resistance to photobleaching.Citation4–Citation6 Besides, they have better biocompatibility, lower toxicity and environment risks in comparison with heavy metal nanomaterials, tombarthite and cadmium-containing quantum dots.Citation7–Citation10 Due to the various functional groups on the surface of CDs, they exhibit fine hydrophilicity and can also be easily chemically modified.Citation11,Citation12 All the prominent characters of CDs show promising applications in biosensing, substance analysis, photocatalysis, optoelectronics, drug delivery, in vivo diagnosis, targeted therapy, fluorescent labeling, bioimaging and so on.Citation13–Citation19
Table S1 HPLC-ESI-MS ion fragments of Re-CDs
The CDs synthesis methods are mainly of two modes: top-down and bottom-up.Citation20–Citation22 Bottom-up carbonization synthesis methods, which are represented by calcination, high-temperature pyrolysis, microwave and hydrothermal synthesis, are thought to have obvious advantages in adjusting the composition and physical properties of CDs by carefully selecting the precursor sources and carbonization conditions, compared with the top-down methods.Citation23,Citation24 When preparing CDs, organic carbon sources such as citric acid, glycerol, saccharides, amines, plants, fruit juice, protein-based biopolymer and so on are widely applied because of the low cost, relatively moderate reaction conditions and environmental friendliness.Citation25–Citation29 Most of the reported CDs have merits of luminescent properties and are widely used as drug nanocarriers and reagents for ion detection or bio-labeling. However, most of the synthetic CDs are lack of biological activities themselves. One aspect is that common carbon sources selected for CDs synthesis are not inherently bioactive. On the other hand, during the process of treating for a long time at quite a high temperature, the composition and structure of CDs may change a lot from those of carbon sources, so some of the bioactivities may disappear and the effects may be lost. Recently, researchers have found that some of the CDs using green carbon sources including green tea, garlic, pepper, lysine and so on or drugs such as aspirin may get both fluorescent characters and bioactivities such as anticancer, antioxidant and anti-inflammatory effects.Citation30–Citation34 These attractive CDs can show significant bioactivities when they are used for tracing and bioimaging in vivo or vitro. It is a fascinating challenge to form the CDs having both biological activities and fluorescent property after high temperature hydrothermal synthesis. It is hoped that CDs with inherent bioactivities can be used for both clinical diagnosis and treatment at the same time in future.
Ginsenosides are pharmacologically active compounds of plants of the genus Panax, such as Panax ginseng C. A. Mey., Panax quiquefolium L. and Panax notoginseng (Burk.) F. H. Chen.Citation35 Years of researches have shown that ginsenosides have significant effects on the nervous system and cardio-cerebrovascular protection, immunoenhancement, antiaging, antioxidant, antidiabetes as well as cancer inhibition effects.Citation36–Citation39 Among the >180 identified ginsenosides, some of the major ones such as ginsenoside Rb1, Rc, Rd, Re and so on have been proved to have multiple pharmacological activities, but do not show significant inhibition of cancer cells. Rare ginsenosides such as Rk3, Rh4, Rg5, Rg6, F4, Rg3, Rh2 and so on, which can degrade from the major ones by thermal and acid or alkali treatments, have been confirmed to have extremely high cancer inhibition effect.Citation40–Citation43 Therefore, inspired from the thermal degradation of ginsenoside Re leading to the formation of Re-derived anticancer compositions, we selected Re as carbon source to obtain CDs functioning both as imaging reagents and effective anticancer drugs through the hydrothermal process. During the hydrothermal synthesis of ginsenoside Re-based CDs (Re-CDs), the original materials would be probably destructed and reconstructed to form more novel constituents and active functional groups. Also, rare ginsenosides derived from ginsenoside Re, such as Rg6, Rh1, Rk3 and protopanaxatriol, would possibly generate and combine with Re-CDs. This might give rise to the anticancer effect of prepared Re-CDs.
In this study, we tried to obtain the fluorescent Re-CDs by classical hydrothermal synthesis method. Physicochemical properties of the as-prepared Re-CDs were characterized by transmission electron microscopy (TEM), Fourier transform infrared (FT-IR) spectroscopy, laser scanning confocal microscopy, fluorescence spectrophotometry and so on. The obtained Re-CDs exhibited nanostructures with a narrow size distribution at 4.6 nm and displayed stable, bright, multicolor fluorescent images under different excitation light irradiation. Anticancer activity was proved at the cellular and molecular levels. The attractive results demonstrated that the Re-CDs could inhibit the proliferation and induce apoptosis of different cancer cell lines and did not exhibit any significant toxicity to non-cancerous cells. So, Re-CDs with good biocompatibility and solubility could possibly achieve dual functions in both cancer treatment and direct bioimaging or tracing. The excellent features would make Re-CDs as a safe and effective nanomedicine that possesses good potential for applications in clinical therapy. Since ginsenosides belong to the Traditional Chinese Medicines with high pharmacological effects, this research also intends to provide the theoretical basis of screening more feasible Traditional Chinese Medicine–based CDs with high fluorescence intensity and pharmacological activities simultaneously.
Materials and methods
Chemicals and reagents
Ginsenoside Re (>98%) was obtained from the natural pharmaceutical analysis laboratory (College of Chemistry, Jilin University) and identified with the standard by HPLC method.Citation44 Anhydrous citric acid (CA, >99.5%; Aladdin Co., Shanghai, P. R. China) and ethylenediamine (EDA, >99.5%, Analytical grade; Dow Chemical Company, Midland, MI, USA) were also used in this experiment. Other chemicals including quinine sulfate, sodium chloride, sodium dodecyl sulfate, tris(hydroxymethyl) aminomethane (Tris) and ammonium persulfate were purchased from Sangon Biotech Co. (Shanghai, P. R. China). HPLC grade solvents such as methanol and acetonitrile were bought from Sigma-Aldrich Co. Ltd (St Louis, MO, USA).
DMEM, FBS, and antibiotic–antimycotic were obtained from Thermo Fisher Scientific (Waltham, MA, USA). Trypsin with 0.02% EDTA was purchased from Biosharp Company (Beijing, P. R. China). Ultrapure water (18.20 MU/cm) from a Milli-Q ultrapure system was used in this study. PBS (1×, 1 L, pH 7.4) which was equilibrated at 37°C for 30 minutes beforehand was used in this experiment.
Synthesis of Re-based CDs
Since we tried to prepare medicative fluorescent CDs with herbal content ginsenoside Re, we first took the pharmaceutical effect into consideration. Then we optimized the synthesis conditions, including hydrothermal temperature, reaction time and purification. In order to get much strong fluorescence for bioimaging, we decided to add a little amount of CA and EDA for improving the fluorescent property. Based on the results shown in Figure S1 and the literatures reported,Citation45,Citation46 we finally confirmed the optimized procedure. In brief, 100 mg of ginsenoside Re was added into 10 mL of ultrapure water. Anhydrous CA (0.1 mmol, 19.21 mg) and EDA (0.1 mmol, 6.01 mg) were used in this system for improving the luminescent properties. When the mixed solution was transferred to the airtight synthesis reactor, temperature of the system was set at 200°C for 10 hours. After the reaction, the system was cooled to room temperature naturally and the colorless liquid changed to dark brown. Then, the prepared solution was centrifuged to remove agglomerated particles and filtered through a 0.22 µm membrane before dialysis. For further purification, the Re-CDs were dialyzed in ultrapure water for 3 hours with replacement of the dialysis milieu every hour, using the dialysis membrane (molecular weight cut-off=3.5 kDa, MD34-3500D; Solarbio Science & Technology Co., Beijing, P. R. China). Finally, the CDs were frozen to dry with a lyophilizer (Martin Christ Corporation, Osterode am Harz, Switzerland) and redissolved in PBS, and then diluted to different working concentrations in the culture medium. For comparison, we also prepared the CDs which were composed of CA and EDA (1:1, moles ratio) at the same condition and purified the same as mentioned before.
Characterization of Re-CDs
Prior to conducting TEM measurements, the original as-prepared Re-CDs solution was diluted with water and deposited on 400-mesh C-coated Cu grids. The excess solvent was evaporated at room temperature. Then TEM test was conducted using a Hitachi H-800 electron microscope at an acceleration voltage of 200 kV with a charge coupled device camera to record the size and shape of the Re-CDs. FT-IR spectroscopy was performed for the identification of characteristic chemical bonds and functional groups with a Nicolet AVATAR 360 type FT-IR spectrometer from Thermo Fisher Scientific. Ultraviolet (UV)–vis absorption and photoluminescent (PL) spectra were recorded by Shimadzu 3100 UV–Vis spectrometer (Shimadzu Co., Tokyo, Japan) and Shimadzu RF-5301-PC fluorescence spectrophotometer to characterize the fluorescent performances of CDs in liquid, respectively.Citation30 The excitation wavelength of PL spectra was operated at a range from 320 to 540 nm. The QY values of Re-CDs and ginsenoside Re were estimated at room temperature using quinine sulfate in 0.1 mol/L H2SO4 aqueous solution as the reference. In order to minimize reabsorption effects, the solutions in 10 mm cuvettes were kept under 0.1 at the excitation wavelength. Excitation and emission slit widths were set at 5.0 nm when recording the PL spectra.Citation34 Dynamic light scattering (DLS) was recorded using 802DLS Nano-ZS particle size analyzer (Malvern Panalytical Ltd, Malvern, UK).
Cell uptake of Re-CDs and bioimaging
Human renal epithelial cells 293T and normal breast epithelial cells MCF-10A, as well as different cancer cell lines MCF-7 (human breast adenocarcinoma), HepG2 (liver hepatocellular carcinoma) and A375 (malignant melanoma) were obtained from American Type Culture Collection (ATCC, Manassas, VA, USA). Normal human liver cells HL-7702(L-02) were purchased from the cell bank of Chinese Academy of Sciences (Shanghai, P. R. China). Human normal skin flbroblasts (NSFbs) were separated from a healthy person and identified by several physiological characterizations.Citation47 All the cancer cell lines and normal cells were cultured in DMEM supplemented with high glucose, FBS (10%) and antibiotic–antimycotic (1%). The incubation was carried out in a fully humidified atmosphere at 37°C with 5% CO2.
Before detection, the cells were seeded in 24-well plates at an initial cell density of 5×10⁴ cells/well. After 24 hours of incubation, we removed the culture supernatant. Then, 500 µL of mixed culture medium with Re-CDs at a concentration of 0.5 mg/mL was added to each well. After culturing for 4 hours, the adherent cells were washed thrice with PBS and then fixed in 4% formaldehyde at room temperature for 30 minutes to analyze the PL imaging under FLUOVIEW FV3000 confocal laser scanning microscopy (Olympus, Tokyo, Japan). Leica DMI 3000B inverted fluorescence microscope (Leica Microsystems GmbH, Wetzlar, Germany) was also used for observation of cells. The excitation wavelengths were set in the range of 510–530, 460–480 and 360–380 nm.
HPLC analysis of Re-CDs solution
HPLC was used for the qualitative analysis of Re-CDs solution. Referring to a previous study,Citation43 the conditions of HPLC analysis were as follows. Briefly, the Agilent 1200 series HPLC system (Agilent Technologies, Santa Clara, CA, USA) equipped with a quaternary pump (G1311A), a thermostat-ted column compartment (G1316A) and an UV detector (G1315A) was used to detect and analyze the results. The analytical column was an Agilent Eclipse XDB-C18 column (4.6×250 mm, 5 µm). Column temperature was maintained at 30°C, and detection wavelength was set at 203 nm. The mobile phase consisted of acetonitrile (A) and water (B). For detecting the content of ginsenosides in Re-CDs solution after hydrothermal process, the gradient elution conditions of rare ginsenosides were set as follows: 0–10 minutes, 29(A):71(B); 10–25 minutes, 29(A):71(B)–40(A):60(B); 25–50 minutes, 40(A):60(B)–60(A):40(B); 50–60 minutes, 60(A):40(B)–70(A):30(B). Flow rate of this method was 0.8 mL/min. We also detected the Re-CDs solution by HPLC-mass spectroscopy (HPLC-MS). The MS was run at the negative ion mode.
The ion source temperature was set to 480°C. The curtain gas and nebulizer gas were 35 and 40 psi, respectively. Spray voltage was −4,500 V and the mode of collision gas was high. Samples were detected under −30 V declustering potential and −10 V entrance potential to obtain fragment ion information. MS data were collected between 200 and 1,700 m/z with the collision energy of −10 V for qualitative analysis.
Cell viability assay (Cell Counting Kit-8 method)
The cell viability was detected using Cell Counting Kit-8 (CCK-8; Dojindo Laboratories, Kumamoto, Japan). It reflected the influence of the as-prepared CDs and ginsenosides on cell proliferation. Briefly, human renal epithelial cells 293T and other cancer cell lines including MCF-7, HepG2 and A375 were seeded in 96-well plates. Different concentrations of samples were added in the plates and incubated for 24 hours. PBS and dimethyl sulfoxide served as solvent control if needed. After treatment, the medium of each well was replaced with a fresh one which contained 10% of CCK-8 solution. The 96-well plates were continuously incubated at 37°C, 5% CO2 for 1 hour.
Release of LDH
Cell damage could be reflected by assay of the released LDH. As a stable cytoplasmic enzyme present in all types of cells, LDH is released into the culture medium through damaged plasma membrane. The amount of the formazan dye thus formed is proportional to the amount of LDH released into the cell supernatant, which indicates cell membrane integrity or cytotoxicity. We used the Cytotoxicity LDH Assay Kit-WST from Dojindo laboratories to perform this detection. In brief, cancer cells in 96-well plates were incubated with different concentrations of Re-CDs for 24 hours. Then 20 µL of the Lysis Buffer was added to each well of the high control and then the plate was incubated at 37°C for 30 minutes in a CO2 incubator. After centrifuging the plate at 250×g for 3 minutes to precipitate the cells, 100 µL of the supernatant was transferred from each well to a new clear 96-well plate and 100 µL of the working solution was added to each well. After incubating in dark at room temperature for 30 minutes, 50 µL of the stop solution was added to each well. Then, the absorbance was measured at 490 nm by a microplate reader.
Quantification of the ROS
The ROS level of the A375 cells was detected by a flow cytometer, which was used for cell analysis (Beckman Coulter Inc., Fullerton, CA, USA). In brief, cell suspension with the concentration of 2.5×10⁵ cells/mL was seeded in six-well plates. Re-CDs with different concentrations were incubated with cells for 24 hours. Then the cells were collected and ROS were detected with fluorescent 2′,7′-dichlorodihydrofluorescein diacetate kit (Beyotime Biotechnology, Jiangsu, P. R. China). The 2′,7′-dichlorodihydrofluorescein diacetate detection probes were separately added to the samples and incubated for 30 minutes at 37°C in a dark place. Then we washed the samples with serum-free medium three times for removing excessive detection probes and measured the generation of ROS by flow cytometry.
High-content imaging analysis about cell apoptosis and necrosis
Logarithmic growth phase cancer cells were treated with different concentrations of Re-CDs in 96-well plates for 24 hours. Then, high-content cell imaging analysis was undertaken to visually reflect the anticancer effect of Re-CDs. An apoptosis and necrosis assay kit (Beyotime Biotechnology) was used in the experiment and the staining assay was carried out as follows. Cells were seeded in 96-well plate and treated with different concentrations of Re-CDs. After 24 hours of incubation, the supernatant was removed and cells were washed with cold PBS. Cancer cells were labeled with Hoechst 33342 and propidium iodide (PI) for 30 minutes at 4°C under working concentration. Cells were washed with PBS three times to remove redundant dye liquors. Images were obtained with the Operetta CLS™ high-content cell imaging analysis system (PerkinElmer Inc., Waltham, MA, USA). The 20× objective lens was applied in each treatment condition. Results were represented by over 40 fields per plate, leading to fields overall acquired for each condition. As we tried to investigate the effect of ROS on apoptosis, the antioxidant N-acetyl-l-cysteine (NAC)- and Re-CDs-treated groups were taken as comparison.
Detection of apoptosis by Western blot
Caspase-3 is an indicator protein activated in apoptosis process. For in vitro studies, the activity of caspase-3 was determined by Western blot. In brief, cancer cells treated with different concentrations of Re-CDs were lysed in RIPA lysis buffer (Beyotime Biotechnology). Total protein of each sample was extracted and detected by Bradford method using Bio-Rad protein assay (Bio-Rad Laboratories Inc., Hercules, CA, USA). Equal amounts of proteins were loaded and separated by 12% SDS-PAGE and transferred to polyvinylidene difluoride membranes (Sigma Aldrich Chemie Gmbh, Munich, Germany). After blocking with 5% skim milk, the membranes were incubated with primary antibodies against caspase-3 (1:1,000; Cell Signaling Technology, Danvers, MA, USA) overnight at 4°C. After washing with TBS-T three times, Alexa Fluor® Plus 488 fluorescent-labeled secondary antibody (Thermo Fisher Scientific) was further incubated; the protein band was visualized by Odyssey infrared imaging system (LI-COR Biosciences, Lincoln, NE, USA). β-Actin (1:5,000; Proteintech Group Inc., Rosemont, IL, USA) was used as an internal load to normalize the expression patterns of each sample. The gray scale values of samples were measured by ImageJ software (National Institutes of Health, Bethesda, MD, USA). Three separate experiments were performed to show the protein expression.
Statistical analyses
For continuous responses, data were expressed as mean±SD based on triplicate observations from three independent experiments. Statistical significance was determined by one-way ANOVA followed by Tukey–Kramer multiple comparison tests. The value of P<0.05 was considered statistically significant. All analyses were conducted using the SPSS software 17.0 (SPSS Inc., Chicago, IL, USA).
Results and discussion
Characterization of Re-based CDs
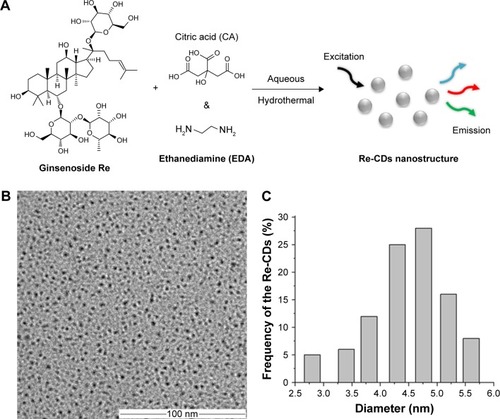
In this investigation, Re-CDs were synthesized by a one-step hydrothermal strategy through condensation of ginsenoside Re, CA and EDA. CA and EDA helped ginsenoside Re to resolve in water and get superior luminescent properties (). The TEM image of Re-CDs () revealed that Re-CDs were spherical dots which had uniform-sized nanostructures and were well dispersed in water. Most of the Re-CDs had diameters ranging from 2.8 to 5.6 nm (). According to the count and calculation of certain amount of Re-CDs, we determined the average diameter of the CDs to be 4.6±0.6 nm. We also obtained the DLS spectrum of Re-CDs. The results showed that Re-CDs had a diameter of around 100 nm particle size distribution in solution (in Figure S2).
Figure 1 Schematic illustration of Re-based CDs via hydrothermal method (A), and the TEM image (B) with the size distribution (C) of Re-CDs.
Abbreviations: CA, citric acid; EDA, ethylenediamine; Re-CDs, Re-based carbon dots; TEM, transmission electron microscopy.
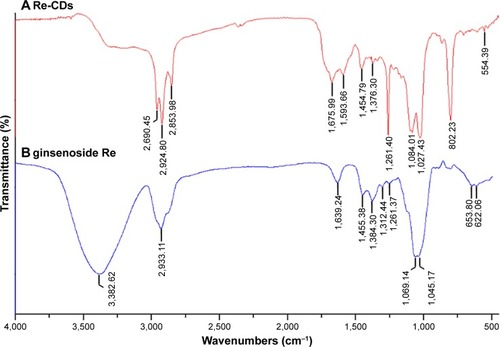
FT-IR spectra were adopted to further analyze the chemical structure of Re-CDs (). The data illustrated that the FT-IR spectrum of ginsenoside Re exhibited stretching vibration of alcoholic hydroxyl (R-OH) at 3,382 cm−1. A characteristic peak at 1,312 cm−1 showed the bending vibration of C–H in unsaturated alkene structure (C=C). Also, according to a previous report,Citation48 the characteristic peaks of ginsenoside Re at 1,384 and 1,069 cm−1 belonged to asymmetric and symmetric stretching vibration of C–O–C structure. Compared with ginsenoside Re, peaks at 2,960 and 1,375 cm−1 of Re-CDs in belonged to the asymmetric stretching vibration and symmetric bending vibration of methyl group, respectively. Also, both ginsenoside Re and Re-CDs showed the characteristic stretching vibration peaks of methylene (–CH2–) at 2,933, 2,924 and 2,854 cm−1 respectively. In both the spectra, peaks at 1,455 and 1,261 cm−1 indicated the C–H bending vibration of saturated alkane structures (such as –CH3 or –CH2–) and that of C–O stretching vibration, respectively. But the peak of Re-CDs at 1,261 cm−1 was sharper than that of the original ginsenoside. The peak at 1,676 cm−1 of Re-CDs was characteristic of the stretching vibration of unsaturated bond (C=C or C=O). Also, the peak at 1,594 cm−1 exhibited the bending vibration of N–H probably. The spectrum of Re-CDs also had vibrational coupling peaks at 1,084 and 1,027 cm−1, which were different from those shown in . It indicated that there were functional groups with similar position and vibration frequency in the synthetic product. The new sharp peak that appeared at 802 cm−1 may be assigned to the out-of-plane bending vibration of N–H. We had also prepared the CDs without ginsenoside Re, which were only synthesized from mixture of CA and EDA. The FT-IR spectrum was shown in Figure S3. In the FT-IR analysis of CDs, the following were observed: stretching vibration of C–OH was around 3,500 cm−1, asymmetric stretching vibration of C–NH–C was at 1,130 cm−1, bending vibration of N–H was at 1,570 cm−1 and the vibrational absorption band of C=O was at 1,675 cm−1. FT-IR results demonstrated that Re-CDs had the characteristic functional groups of ginsenoside, as well as CDs prepared from CA and EDA. So, we speculated that ginsenoside Re combined with EDA and CA to form Re-CDs. Also, there were still ginsenoside structures and several remained or were newly formed functional groups on the surface of Re-CDs, which were probably attributed to the anticancer bioactivity.
Figure 2 The FT-IR spectra of the (A) as-prepared Re-CDs and (B) ginsenoside Re.
Abbreviations: FT-IR, Fourier transform infrared; Re-CDs, Re-based carbon dots.
Fluorescent properties and cell imaging of Re-CDs in vitro
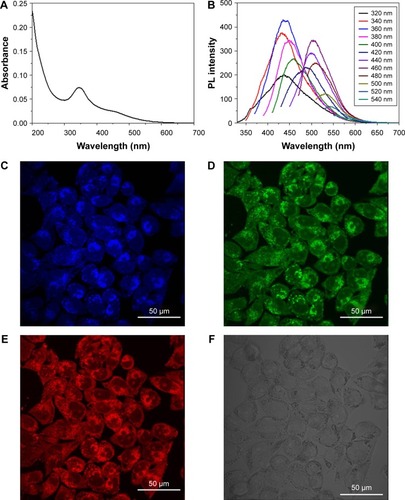
The fluorescent properties and bioimaging performance of Re-CDs in A375 cancer cells are shown in . According to the UV–vis absorption spectrum, the maximum absorption peak was at 350 nm and there was a flat peak at around 460 nm. The QY of Re-CDs was calculated to be 15.4% by using quinine sulfate in 0.1 mol/L H2SO4 aqueous solution as the reference at the excitation wavelength of 360 nm. The refractive indexes of the two kinds of solutions compared were thought to be the same, referring to previous reports.Citation30,Citation46,Citation49 There was scarcely any fluorescence of the original compound ginsenoside Re at the same condition. shows the fluorescence emission spectra of Re-CDs. Results showed that Re-CDs displayed excitation-dependent PL behavior when excited at wavelengths ranging from 320 to 540 nm. The strong PL intensity of the as-prepared Re-CDs occurred at 360 and 460 nm. The fluorescent properties of Re-CDs were suggested to arise from the recombination of electron–hole pairs in localized spCitation2- hybridized carbon clusters with crystalline and amorphous structures, according to other similar reports.Citation49–Citation51 Also, the excitation dependence mainly results from different sizes of Re-CDs (quantum effect) and/or different emissive traps on the Re-CDs surface mechanism. It was also understandable in terms of two or more PL centers induced by the complicated structures of Re-CDs.Citation52,Citation53 shows the cellular uptake and bioimaging of Re-CDs in A375 cancer cells. Re-CDs possessed excitation-dependent emission PL properties. Blue, green and red light would be emitted when excited under UV, blue and green laser, respectively. In order to prove that the fluorescence was from Re-CDs, we took untreated A375 cells as the illustration. Control images are shown in Figure S4. We also quantified the fluorescent signals using the ImageJ program. Values of the signal intensity/pixel were 0.077, 0.070 and 0.067, which corresponded to red, green and blue, respectively. Results were consistent with the fluorescence spectra. The excellent luminescent properties of Re-CDs are the basis of widespread applications in biological fields.
Figure 3 Fluorescent properties and cell imaging of Re-CDs.
Notes: (A) UV–vis spectrum of Re-CDs. (B) The PL emission spectra of Re-CDs with progressively longer excitation wavelengths from 320 to 540 nm in 20 nm increments. (C–F) Cell imaging of A375 cells treated with Re-CDs under ultraviolet (C, 360–380 nm), blue (D, 460–480 nm), green (E, 510–530 nm) light excitation and bright field (F).
Abbreviations: PL, photoluminescence; Re-CDs, Re-based carbon dots; UV–vis, ultraviolet–visible.
HPLC analysis of Re-CDs solution
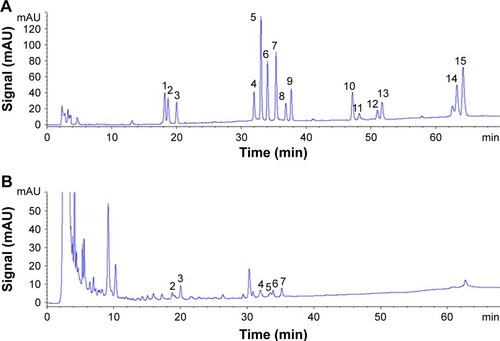
We tested the Re-CDs solution under the condition of rare ginsenosides analysis to investigate the possible existence of constituents derived from ginsenoside Re. HPLC results, which could illustrate the anticancer effect of Re-CDs in one aspect, are displayed in . Combining with the retention time of peaks in HPLC spectra and the mass spectrum information presented in , we could do qualitative analysis of the Re-CDs solution. Results indicated that rare ginsenoside Rg2, 20(R)-Rh1, Rg6, F4, Rk3 and Rh4 could be detected in a solution of Re-CDs. It demonstrated that under the hydrothermal synthesis condition, glycosyl elimination and dehydration would happen in a closed system and a part of the ginsenoside Re was degraded to several kinds of Re-derived rare ginsenosides during the process. These rare ginsenosides were proved to have extremely high bioactivity including anticancer effect.Citation54,Citation55 So, we suggest that the existence of rare ginsenosides which may absorb on the surface of Re-CDs and can release in Re-CDs solution is responsible for the anticancer effect.
Figure 4 The HPLC analysis of standard solution of (A) different rare ginsenosides and Re-CDs (B).
Notes: The kind of ginsenoside the number represents is as follows: (1) 20(S)-Rh1; (2) Rg2; (3) 20(R)-Rh1; (4) Rg6; (5) F4; (6) Rk3; (7) Rh4; (8) 20(S)-Rg3; (9) 20(S)-Rg3; (10) Rk1; (11) Rg5; (12) 20(S)-Rh2; (13) 20(R)-Rh2; (14) Rk2; (15) Rh3. There were six kinds of rare ginsenosides derived from ginsenoside Re in Re-CDs solution.
Abbreviation: Re-CDs, Re-based carbon dots.
Inhibition effect of cells treated with Re-CDs in vitro
shows the in vitro inhibition of Re-CDs which were cultured with cells for 24 hours. There was a dose-dependent relationship between cell viability of cancer cells (MCF-7, A375 and HepG2) and the concentration of Re-CDs. The viability of cancer cells significantly decreased with the increasing concentration of Re-CDs, while that of normal cells (293T) remained above 90%. We also took other normal cells such as normal human liver cells HL-7702(L-02), human NSFbs and normal breast epithelial cells MCF-10A into consideration. Results are shown in Figure S5. The figure demonstrates that Re-CDs showed excellent inhibition activity on cancer cells and little effect on normal cells. The IC50 values of HepG2, MCF-7 and A375 were 1.05, 0.529 and 0.223 mg/mL, respectively. Among the cancer cell lines, A375 treated with Re-CDs showed the most significant inhibition. The results also indicated that compared with some commercial drugs, including cisplatin, methotrexate, and doxorubicin for cancer therapy, Re-CDs showed efficient inhibition of cancer cells with lower toxicity to normal cells. We prepared the CDs only constituting CA and EDA. The cytotoxicity results by CCK-8 assay are shown in Figure S6A. There was no significant inhibition of both normal cells 293T and other cancer cell lines. So, we thought other constituents of Re-CDs, including CA and EDA, had no contribution to the anticancer effect. On the other hand, ginsenoside Re also showed no influence on cancer cells under the same concentration of Re-CDs (Figure S6B), but the hydrothermal synthesis process of Re-CDs had changed their properties and improved the anticancer effect. This might provide an extensive application prospect of CDs in cancer therapy.
Figure 5 (A) Cytotoxicity results of Re-CDs obtained from different kinds of treated cells at various doses and (B) the LDH release of normal and cancer cells induced by different concentrations of Re-CDs.
Notes: Data are represented as mean±SD from three parallel tests. (n=3, *P<0.05). Re-CDs significantly inhibited different cancer cell lines, but had little influence on the cell viability of normal cells.
Abbreviations: 293T, human renal epithelial cell line; A375, malignant melanoma cell line; HepG2, human liver hepatocellular carcinoma cell line; MCF-7, human breast adenocarcinoma, Michigan cancer foundation-7; Re-CDs, Re-based carbon dots.
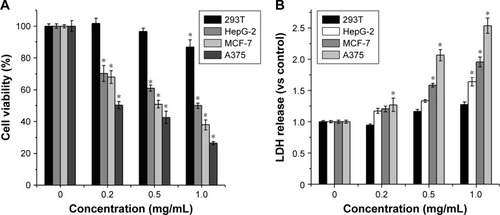
LDH release assay of cancer and normal cells treated with Re-CDs
As LDH is a cytoplasmic enzyme, it is released to the culture media when cell damage occurs and it is a stable enzyme.Citation30 In order to further support that the Re-CDs induced apoptosis and cell damage, determination of LDH release by cancer cells cultured with different concentrations of Re-CDs was necessary. So, we studied the released LDH as an indicator to reflect the cell state. After 24 hours of incubation, the supernatant medium of each group was collected and the absorbance was determined at 490 nm by a microplate reader after treating it with an LDH Assay Kit. Results are displayed in . Compared with the LDH release of the control group, which was in the absence of Re-CDs (0 mg/mL), the content of LDH in the medium increased with increasing Re-CDs concentration. It also revealed that Re-CDs had specific anticancer effect.
Effect of Re-CDs on ROS generation in cancer cells
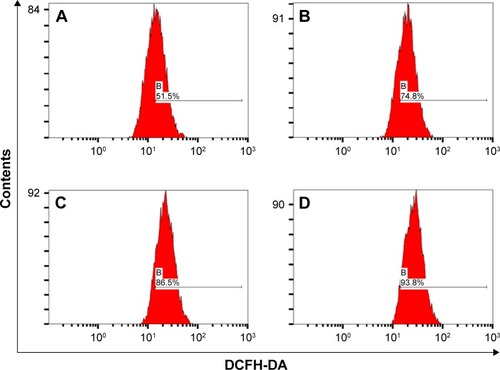
Many investigations have found that the ROS levels in cancer cells are significantly associated with anticancer effect including proliferation inhibition and apoptosis induction.Citation30,Citation56–Citation59 In order to explore the effect of Re-CDs on the inhibition of cancer cells, we measured the ROS level in A375 cells after they were treated with Re-CDs, by a flow cytometer. Results are displayed in . The ROS levels of normal cells 293T and other kinds of cancer cells HepG-2 and MCF-7 are shown in Figures S7–S9. Compared with the ROS level in the control group (0 mg/mL), we could obviously find that the ROS in cancer cells were significantly increased after incubation with Re-CDs. In normal cells, the ROS level also increased, but not significantly. Increase in the level of ROS in cancer cells after treatment with Re-CDs was apparently higher than that in normal cells. High content of the ROS generated in cancer cells caused oxidative damage and apoptosis, therefore the Re-CDs showed desirable anticancer effect.Citation30,Citation59,Citation60 Different influences on the cell viabilities of cancer and normal cells might be related to the existence of Re-derived rare ginsenoside and the intracellular ROS level. Increase in ROS levels is not the only pathway to induce cell apoptosis. Further investigations and intensive mechanistic studies of the anticancer effect of Re-CDs are meaningful and in great need.
Figure 6 Analysis of ROS generation by A375 cancer cells treated with different concentrations of Re-CDs.
Notes: (A) 0 mg/mL; (B) 0.2 mg/mL; (C) 0.5 mg/mL; and (D) 1.0 mg/mL. ROS generation in cancer cells A375 was enhanced on treatment with increasing concentration of Re-CDs.
Abbreviations: A375, malignant melanoma cell line; DCFH-DA, 2′,7′-dichlorodihydrofluorescein diacetate; Re-CDs, Re-based carbon dots.
High-content imaging analysis for apoptosis and necrosis of cancer cells treated with Re-CDs
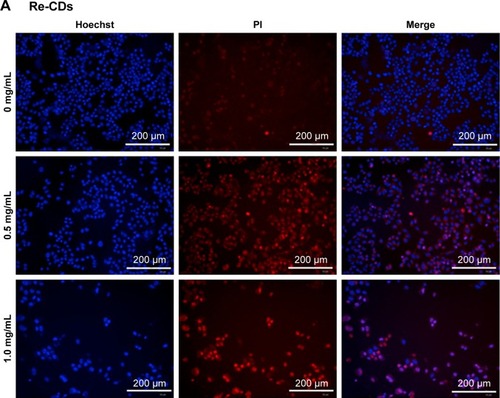
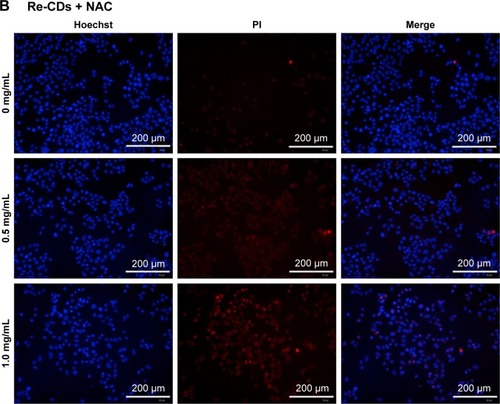
For further research about cell apoptosis and necrosis, after treating the cells with Re-CDs, Hoechst/PI double-staining method was applied in this experiment.Citation61 Hoechst 33342 could penetrate the cell membrane into cells, while PI could not enter the cells with normal construction of the cell membrane. When cell apoptosis occurred, bright blue and weak red fluorescence was observed. Necrosis was thought to have occurred when cells showed weak blue and bright red fluorescence. High-content cell imaging analysis was successfully completed to get pictures by the Operetta CLS™ system from PerkinElmer Inc. Results are shown in . When incubated with different concentrations of Re-CDs for 24 hours, cell apoptosis and damage enhancement could be observed obviously with increasing concentration of Re-CDs, as shown in . We also tried to investigate the correlation between ROS and apoptosis. The ROS scavenger NAC at 10 mmol/L and different concentrations of RE-CDs were incubated with A375 for 24 hours. The images in reveal that apparently, cell apoptosis was inhibited when NAC was added in the Re-CDs–treated system. It indicates that NAC decreased the generation of ROS and thus influenced cell apoptosis of A375. Results suggest that Re-CDs were capable of inhibiting cancer cell proliferation and inducing apoptosis through the ROS-mediated pathway. But some extent of apoptosis was still found in Re-CDs+NAC groups, which suggests that Re-CDs might also cause apoptosis in other ways. For reflecting the apoptosis of cancer cells more specifically, we also used the Annexin V-fluorescein isothiocyanate/PI double-staining kit. Results are shown in Figure S10. Annexin V was bound to the apoptosis cell membrane, while FITC showed green fluorescence. The trends of results were consistent with those presented in .
Figure 7 High-content imaging analysis of cell apoptosis and necrosis by Hoechst/PI double-staining method.
Notes: (A) Samples only treated with different concentrations of Re-CDs. (B) Samples treated with Re-CDs and NAC simultaneously. There were clear cell apoptosis and necrosis phenomena in the group treated with Re-CDs. When co-incubated with NAC, cell apoptosis and necrosis had decreased.
Abbreviations: NAC, N-acetyl-L-cysteine; PI, propidium iodide; Re-CDs, Re-based carbon dots.
Western blot analysis for cell apoptosis
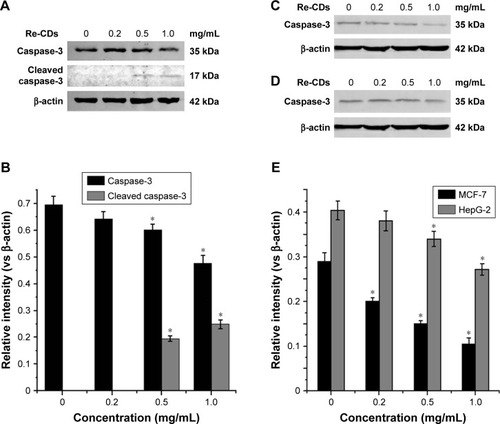
In an attempt to elucidate if the anticancer effect of Re-CDs was associated with cell apoptosis at a protein level, caspase-3 expression was detected by Western blot analysis. As shown in , on treating A375 cells with Re-CDs, the expression of caspase-3 was decreased and cleaved caspase-3 could be detected with increasing concentration of Re-CDs. The gray scale values of samples are displayed in . The results presented in also show decreased expression of caspase-3 with increasing concentration of Re-CDs. demonstrates the quantitative results of Western blot. Results would be more accurate and direct to illustrate the existence of cell apoptosis by comparing the gray value ratios of caspase-3 related objective protein vs internal reference (β-actin), which were calculated by the ImageJ program. Based on the Western blot result, we suggest that Re-CDs are able to induce cancer cell apoptosis by caspase-mediated pathway.
Figure 8 Effects of Re-CDs on caspase-3 expression related to apoptosis of cancer cells.
Notes: (A) Western blot analysis of the expression of apoptosis protein caspase-3 in A375 cells. (B) The relative gray intensity (vs internal reference) of caspase-3 with different concentrations of Re-CDs in A375 cells. (C) Western blot analysis of the expression of apoptosis protein caspase-3 in MCF-7. (D) Western blot analysis of the expression of apoptosis protein caspase-3 in HepG-2. (E) The relative gray intensity (vs internal reference) of caspase-3 with different concentrations of Re-CDs in MCF-7 and HepG-2 cells. Data in histogram are represented as mean±SD (*P<0.05). Decrease in caspase-3 and the increasing expression of cleaved caspase-3 indicate the apoptosis of A375 cancer cells. While in MCF-7 and HepG-2, we can also observe the decreased expression of caspase-3.
Abbreviations: A375, malignant melanoma cell line; Re-CDs, Re-based carbon dots.
Conclusion
To summarize, we followed a simple one-step hydrothermal strategy to obtain a kind of PL CDs based on ginsenoside Re. The water-soluble Re-CDs had stable fluorescent properties and could be internalized by cells for tracing and bioimaging. The Re-CDs exhibited excellent inhibition efficiency for the cancer cells A375, HepG2 and MCF-7, while they expressed no or only minor cytotoxicity to the healthy cells 293T, HL-7702(L-02), MCF-10A and NSFbs. We speculated the desirable pharmacological activity and tolerability in normal cells mainly depended on specific functional groups on the surface and generation of Re-derived rare ginsenosides with high anticancer effect during the hydrothermal process. The investigation not only demonstrated the biocompatibility and biosafety of Re-CDs, but also revealed that the Re-CDs could inhibit the proliferation of cancer cells and induce apoptosis by caspase-mediated pathway. It was also proved to be related to increasing ROS levels. Finally, we suggested that the Re-CDs were dual functional nanoparticles, which could diagnose existence of tumor through bioimaging and treat cancer by growth-inhibiting and apoptosis-promoting effects on cancer cells. The results provide novel ideas for combining pharmacologically active traditional Chinese medicines with nanoscience and technology and also open an exciting view to explore the biomedical applications of bioactive CDs. Moreover, as a kind of safe and effective multifunctional biomedical nanoagents, the promising Re-CDs would find further potential clinical application values in future.
Acknowledgments
This work was supported by NSFC (51703077), Natural Science Foundation of Jilin Province (20180520023JH) and the Fundamental Research Funds for the Central Universities.
Supplementary material
Disclosure
The authors report no conflicts of interest in this work.
References
- XuXRayRGuYElectrophoretic analysis and purification of fluorescent single-walled carbon nanotube fragmentsJ Am Chem Soc200412640127361273715469243
- BourlinosABStassinopoulosAAnglosDZborilRGeorgakilasVGiannelisEPPhotoluminescent carbogenic dotsChem Mater2008201445394541
- ChengCShiYLiMXingMWuQCarbon quantum dots from carbonized walnut shells: structural evolution, fluorescence characteristics, and intracellular bioimagingMater Sci Eng C Mater Biol Appl20177947348028629043
- QiBPBaoLZhangZLPangDWElectrochemical methods to study photo-luminescent carbon nanodots: preparation, photoluminescence mechanism and sensingACS Appl Mater Interfaces2016842283722838226906145
- ShiHWeiJQiangLChenXMengXFluorescent carbon dots for biolmaging and biosensing applicationsJ Biomed Nanotechnol201410102677269925992414
- BakerSNBakerGALuminescent carbon nanodots: emergent nano-lightsAngew Chem Int Ed Engl201049386726674420687055
- MaoXJZhengHZLongYJStudy on the fluorescence characteristics of carbon dotsSpectrochim Acta A Mol Biomol Spectrosc201075255355720022294
- WangYHuACarbon quantum dots: synthesis, properties and applicationsJ Mater Chem C Mater201423469216939
- MiaoPHanKTangYWangBLinTChengWRecent advances in carbon nanodots: synthesis, properties and biomedical applicationsNanoscale2015751586159525510876
- WangKGaoZGaoGSystematic safety evaluation on photo-luminescent carbon dotsNanoscale Res Lett20138112213123497260
- WangXWangDGuoYImidazole derivative-functionalized carbon dots: using as a fluorescent probe for detecting water and imaging of live cellsDalton Trans201544125547555425697218
- ZhangHQiaoXCaiTChenJLiZQiuHPreparation and characterization of carbon dot-decorated silica stationary phase in deep eutectic solvents for hydrophilic interaction chromatographyAnal Bioanal Chem201740992401241028084509
- ZhengXTAnanthanarayananALuoKQChenPGlowing graphene quantum dots and carbon dots: properties, syntheses, and biological applicationsSmall201511141620163625521301
- LuQWangHLiuYHouYLiHZhangYGraphitic carbon nitride nanodots: as reductant for the synthesis of silver nanoparticles and its biothiols biosensing applicationBiosens Bioelectron201789Pt 141141627241178
- ParkSYLeeHUParkESPhotoluminescent green carbon nanodots from food-waste-derived sources: large-scale synthesis, properties, and biomedical applicationsACS Appl Mater Interfaces2014653365337024512145
- LiuMChenWGreen synthesis of silver nanoclusters supported on carbon nanodots: enhanced photoluminescence and high catalytic activity for oxygen reduction reactionNanoscale2013524125581256424173664
- WangHYiJYuYZhouSNIR upconversion fluorescence glucose sensing and glucose-responsive insulin release of carbon dot-immobilized hybrid microgels at physiological pHNanoscale20179250951627942663
- LeeCKwonWBeackSBiodegradable nitrogen-doped carbon nanodots for non-invasive photoacoustic imaging and photothermal therapyTheranostics20166122196220827924157
- GongXZhangQGaoYShuangSChoiMMDongCPhosphorus and nitrogen dual-doped hollow carbon dot as a nanocarrier for doxorubicin delivery and biological imagingACS Appl Mater Interfaces2016818112881129727088972
- SunHJiHJuEGuanYRenJQuXSynthesis of fluorinated and nonfluorinated graphene quantum dots through a new top-down strategy for long-time cellular imagingChemistry20152193791379725614445
- YangYWuDHanSHuPLiuRBottom-up fabrication of photoluminescent carbon dots with uniform morphology via a soft–hard template approachChem Commun (Camb)201349434920492223598552
- PillersMGossVLiebermanMElectron-beam lithography and molecular liftoff for directed attachment of DNA nanostructures on silicon: top-down meets bottom-upAcc Chem Res20144761759176724716716
- NiuFXuYLiuMSunJGuoPLiuJBottom-up electrochemical preparation of solid-state carbon nanodots directly from nitriles/ionic liquids using carbon-free electrodes and the applications in specific ferric ion detection and cell imagingNanoscale20168105470547726891173
- WangJLiuGLeungKCLoffroyRLuPXWangYXOpportunities and challenges of fluorescent carbon dots in translational optical imagingCurr Pharm Des201521375401541626377656
- HillSGalanMCFluorescent carbon dots from mono- and polysaccharides: synthesis, properties and applicationsBeilstein J Org Chem20171367569328503203
- KonwarAGogoiNMajumdarGChowdhuryDGreen chitosan-carbon dots nanocomposite hydrogel film with superior propertiesCarbohydr Polym201511523824525439891
- HanBWangWWuHPolyethyleneimine modified fluorescent carbon dots and their application in cell labelingColloids Surf B Biointerfaces201210020921422766299
- GaoQHanJMaZPolyamidoamine dendrimers-capped carbon dots/Au nanocrystal nanocomposites and its application for electrochemical immunosensorBiosens Bioelectron2013491032332823792654
- ZhangZHaoJZhangJZhangBTangJProtein as the source for synthesizing fluorescent carbon dots by a one-pot hydrothermal routeRSC Adv201222385998601
- HsuP-CChenP-COuC-MChangH-YChangH-TExtremely high inhibition activity of photoluminescent carbon nanodots toward cancer cellsJ Mater Chem B201311317741781
- ZhaoSLanMZhuXGreen synthesis of bifunctional fluorescent carbon dots from garlic for cellular imaging and free radical scavengingACS Appl Mater Interfaces2015731170541706026193082
- VasimalaiNVilas-BoasVGalloJGreen synthesis of fluorescent carbon dots from spices for in vitro imaging and tumour cell growth inhibitionBeilstein J Nanotechnol2018953054429527430
- LiDNaXWangHFluorescent carbon dots derived from Mail-lard reaction products: their properties, biodistribution, cytotoxicity, and antioxidant activityJ Agric Food Chem20186661569157529360356
- XuXZhangKZhaoLAspirin-based carbon dots, a good bio-compatibility of material applied for bioimaging and anti-inflammationACS Appl Mater Interfaces2016848327063271627934165
- ShinBKKwonSWParkJHChemical diversity of ginseng saponins from Panax ginsengJ Ginseng Res201539428729826869820
- RuWWangDXuYChemical constituents and bioactivities of Panax ginseng (C. A. Mey.)Drug Discov Ther201591233225788049
- AhmedTRazaSHMaryamAGinsenoside Rb1 as a neuroprotective agent: a reviewBrain Res Bull2016125304327060612
- ShiYWanXShaoNYeRZhangNZhangYProtective and anti-angiopathy effects of ginsenoside Re against diabetes mellitus via the activation of p38 MAPK, ERK1/2 and JNK signalingMol Med Rep20161454849485627748921
- SunMYeYXiaoLDuanXZhangYZhangHAnticancer effects of ginsenoside Rg3 (review)Int J Mol Med201739350751828098857
- QuanKLiuQWanJYRapid preparation of rare ginsenosides by acid transformation and their structure–activity relationships against cancer cellsSci Rep20155859825716943
- JangHJHanIHKimYJAnticarcinogenic effects of products of heat-processed ginsenoside Re, a major constituent of ginseng berry, on human gastric cancer cellsJ Agric Food Chem201462132830283624666263
- KimYJYamabeNChoiPLeeJWHamJKangKSEfficient thermal deglycosylation of ginsenoside Rd and its contribution to the improved anticancer activity of ginsengJ Agric Food Chem201361389185919123984628
- YaoHLiXLiuYWuQJinYAn optimized microwave-assisted extraction method for increasing yields of rare ginsenosides from Panax quinquefolius LJ Ginseng Res201640441542227746695
- KuangPWangGYuanQLiangHSeparation and purification of ginsenoside Re from ginseng bud by selective adsorption of active carbon and preparative high-performance liquid chromatographyNat Prod Res201226328629021848370
- ZhuSMengQWangLHighly photoluminescent carbon dots for multicolor patterning, sensors, and bioimagingAngew Chem Int Ed Engl201352143953395723450679
- SchneiderJReckmeierCJXiongYMolecular fluorescence in citric acid-based carbon dotsJ Phys Chem C2017121320142022
- FerenacMPolancecDHuzakMPereira-SmithOMRubeljIEarly-senescing human skin fibroblasts do not demonstrate accelerated telomere shorteningJ Gerontol A Biol Sci Med Sci200560782082916079203
- ShangXHHuiGZhaoYStructure and vibrational spectroscopy of ginsenoside Re: density functional theory studyGuang Pu Xue Yu Guang Pu Fen Xi200929102765276820038056
- LiuCZhangPZhaiXNano-carrier for gene delivery and bioimaging based on carbon dots with PEI-passivation enhanced fluorescenceBiomaterials201233133604361322341214
- HuXAnXLiLEasy synthesis of highly fluorescent carbon dots from albumin and their photoluminescent mechanism and biological imaging applicationsMater Sci Eng C Mater Biol Appl20165873073626478365
- WangXQuKXuBRenJQuXMicrowave assisted one-step green synthesis of cell-permeable multicolor photoluminescent carbon dots without surface passivation reagentsJ Mater Chem201121824452450
- ChenYZhengMXiaoYA self-quenching-resistant carbon-dot powder with tunable solid-state fluorescence and construction of dual-fluorescence morphologies for white light-emissionAdv Mater201628231231826568431
- StraussVMargrafJTDolleCCarbon nanodots: toward a comprehensive understanding of their photoluminescenceJ Am Chem Soc201413649173081731625372278
- ChenBJiaXBApoptosis-inducing effect of ginsenoside Rg6 on human lymphocytoma JK cellsMolecules20131878109811923839115
- DuanZWeiBDengJThe anti-tumor effect of ginsenoside Rh4 in MCF-7 breast cancer cells in vitro and in vivoBiochem Biophys Res Commun2018499348248729596831
- LinSLiYZamyatninAAWernerJBazhinAVReactive oxygen species and colorectal cancerJ Cell Physiol201823375119513229215746
- SypniewskiDSzkaradekNLochTContribution of reactive oxygen species to the anticancer activity of aminoalkanol derivatives of xanthoneInvest New Drugs201836335536929116476
- DingYWanJZhangZWangFGuoJWangCLocalized Fe(II)-induced cytotoxic reactive oxygen species generating nanosystem for enhanced anticancer therapyACS Appl Mater Interfaces20181054439444929337533
- DingYFLiSLiangLHighly biocompatible chlorin e6-loaded chitosan nanoparticles for improved photodynamic cancer therapyACS Appl Mater Interfaces201810129980998729498260
- GaoCTangFGongGpH-responsive prodrug nanoparticles based on a sodium alginate derivative for selective co-release of doxorubicin and curcumin into tumor cellsNanoscale2017934125331254228819666
- WangFPangSWangLLiQKreiterMLiuC-YOne-step synthesis of highly luminescent carbon dots in noncoordinating solventsChem Mater2010221645284530