
Abstract
Purpose
Liposomal drug delivery can improve the therapeutic index of treatments for multiple myeloma. However, an appropriate 3D model for the in vitro evaluation of liposomal drug delivery is lacking. In this study, we applied a previously developed 3D bone marrow (BM) myeloma model to examine liposomal drug therapy.
Material and methods
Liposomes of different sizes (~75–200 nm) were tested in a 3D BM myeloma model, based on multipotent mesenchymal stromal cells, endothelial progenitor cells, and myeloma cells cocultured in hydrogel. The behavior and efficacy of liposomal drug therapy was investigated, evaluating the feasibility of testing liposomal drug delivery in 3D in vitro. Intracellular uptake of untargeted and integrin α4β1 (very late antigen-4) targeted liposomes was compared in myeloma and supporting cells, as well as the effectivity of free and liposome-encapsulated chemotherapy (bortezomib, doxorubicin). Either cocultured myeloma cell lines or primary CD138+ myeloma cells received the treatments.
Results
Liposomes (~75–110 nm) passively diffused throughout the heterogeneously porous (~80–850 nm) 3D hydrogel model after insertion. Cellular uptake of liposomes was observed and was increased by targeting very late antigen-4. Liposomal bortezomib and doxorubicin showed increased cytotoxic effects toward myeloma cells compared with the free drugs, using either a cell line or primary myeloma cells. Cytotoxicity toward supporting BM cells was reduced using liposomes.
Conclusion
The 3D model allows the study of liposome-encapsulated molecules on multiple myeloma and supporting BM cells, looking at cellular targeting, and general efficacy of the given therapy. The advantages of liposomal drug delivery were demonstrated in a primary myeloma model, enabling the study of patient-to-patient responses to potential drugs and treatment regimes.
Introduction
Multiple myeloma is a malignancy of the plasma cells that preferentially reside in the bone marrow (BM). The BM microenvironment contains various cell types including hematopoietic cells, bone cells, stromal cells, and endothelial cells. Myeloma cells interact with the BM cells present, and adhere to extracellular matrix proteins. These myeloma–BM interactions, as well as soluble cytokines and growth factors, stimulate the survival, growth, and migration of myeloma cells and may induce resistance to (chemo)therapy.Citation1,Citation2 Several new therapies aim at targeting these interactions, to potentially overcome the resistance of myeloma cells to therapy.
Systemic therapies, targeting myeloma in its tumor microenvironment, have improved patient outcomes over the last decades.Citation3,Citation4 Nevertheless, these treatments still have disadvantages, most important being off-target toxicity leading to side effects.Citation5 Drug delivery systems have been developed to overcome these disadvantages, aiming at higher concentrations of drugs at the tumor/target sites while reducing off-target effects in healthy tissue.Citation6 One of the best studied drug delivery systems is liposomes, nanoparticles composed of a bilayer of lipids, which surrounds an aqueous core.Citation6 This dual nature of liposomes allows encapsulation of both hydrophilic and lipophilic drug molecules in the aqueous core and in the bilayer, respectively.Citation7 Moreover, the feasibility to manipulate liposomes by introducing polyethylene glycol (PEG) moieties on their surface (PEGylated, stealth or long circulating liposomes), and by coupling functional targeting ligands (targeted liposomes), makes them an attractive tool for drug delivery.Citation8 The latter can be achieved by coupling a peptide or antibody that specifically binds to surface receptors extensively expressed on the tumor cells of interest.Citation9 In hematological malignancies including myeloma, adhesion molecules like integrin α4β1 (very late antigen-4 [VLA-4]) mediate interactions with BM stromal cells, leading to secretion of factors (eg, IL-6) known to be involved in therapy resistance.Citation3 Targeting cell–matrix and cell–cell interactions is therefore an attractive strategy both in terms of selective targeting of myeloma cells, and for inhibition of cell-adhesion-mediated drug resistance (CAM-DR).Citation10,Citation11
At present, the therapeutic potential of novel drugs is mainly tested either in vitro using 2D cell cultures or, at a later stage, in vivo using animal models for myeloma. Cell lines used for 2D culture have been developed from myeloma cells isolated from the blood of advanced stage patients, which are no longer dependent on the BM for their survival and growth. Inherently, these 2D cell cultures do not fully reflect the myeloma cells found in earlier stage patients, which still rely on the surrounding BM for their survival.Citation12 Also, the surrounding BM environment (ie, other cell types and extracellular matrix) is not taken into account in these in vitro models. Animal models do offer the possibility to assess therapeutic responses of novel drugs on human primary myeloma cells grown in a xenogeneic or humanized 3D environment.Citation13,Citation14 However, animal models are time-consuming, expensive, and have limited capacity for drug sensitivity testing. 3D in vitro models offer the possibility to culture myeloma cells in a system that resembles the human BM environment closely, in which both therapeutic impact and nonspecific effects can be analyzed. When using primary patient cells, therapeutic responses can be studied for each patient individually, enabling screening for variability in patient response to potential treatments.
Previously developed 3D myeloma models have investigated the effects of conventional chemotherapeutic agents within their models, but not liposomal drug delivery systems.Citation15–Citation19 Liposomal drugs have been studied in other cancers using tumor spheroids, where it was observed that nanoparticle delivery was hindered by poor penetration into the artificial cancer mass.Citation20–Citation22 Nevertheless, not all 3D models share the same characteristics in terms of porosity and penetration ability. Our previously developed 3D myeloma–BM model allows the penetration and migration of a cellular immunotherapy using modified T cells.Citation23 This hydrogel-based model contains prevascular networks supporting myeloma survival and in contrast to dense spheroid cultures of carcinomas, does not develop into one solid cancer mass, but multiple dispersed small tumor masses.
In this study, the behavior and efficacy of liposomal drug therapy was investigated using a 3D BM model for multiple myeloma. We evaluated the feasibility of testing liposomal drug delivery of various sizes within the 3D model. Intracellular uptake of untargeted and VLA-4 targeted liposomes was compared in both myeloma cells and supporting cells (multipotent mesenchymal stromal cells [MSCs] and endothelial progenitor cells [EPCs]) within the 3D model, and the effectivity of free and liposome-encapsulated chemotherapy was determined, as well as off-target effects. A myeloma-specific (bortezomib) and nonmyeloma-specific anticancer drugs (doxorubicin) were included in this study. Within the 3D BM model, either a myeloma cell line or primary myeloma cells cocultured with supporting BM cells received the treatments. The used model mimics relevant aspects of the BM microenvironment, with the primary myeloma model also reflecting the heterogeneity of the myeloma patient population.
Material and methods
Additional details can be found in the Material and methods in the Supplementary material.
Liposome preparation
Liposomes were prepared as described previously.Citation24 In brief, appropriate amounts of DPPC, mPEG2000-DSPE, and cholesterol were dissolved in chloroform at a molar ratio of 1.85:0.15:1, respectively. LissRhod PE or DiD was added to the lipid solutions at a final concentration of 0.2% (v/v) or 0.1% (v/v) of total lipids, respectively. A lipid film was prepared under reduced pressure on a rotary evaporator and dried under a stream of nitrogen until complete dryness. The resulting lipid film was hydrated with HEPES buffered saline at pH 7.4. The liposome dispersion was then extruded (Lipex high pressure extruder, Northern Lipids) ten times using Whatman® Anodisc Inorganic Membranes (Sigma Aldrich, Darmstadt, Germany) of pore size 100 nm to get intermediate-sized liposomes (~100 nm), and subsequently extruded with two staked Whatman® Nucleopore™ polycarbonate membrane filters (Sigma Aldrich) with 50 nm pores to get small-sized liposomes (~75 nm). For larger liposomes, extrusion was performed five times with Whatman Anodisc Inorganic Membranes pore size 200 nm. Liposomes were stored at 4°C until use, either on the same day or the day following preparation.
Size distribution of liposomes was determined by using NanoSight NS500 (Malvern Panalytical, Royston, UK). The methods of loading liposomes with doxorubicin or bortezomib, and preparation of VLA-4 targeted liposomes can be found in the Materials and methods in the Supplementary material. Characterization of all batches of liposomes can be found in .
Table 1 Liposome characteristics describing the fluorescent label and mean/mode diameter (nm) of each prepared liposome batch, and if applicable, the VLA-4 coupling efficiency and loaded drug concentration
Cell lines and primary cells
Human myeloma cell lines L363 and MM1S were purchased from the American Type Culture Collection and were retro-virally transduced (L363-GFP and MM1S-mCherry) as described previously.Citation25,Citation26 Human MSCs were obtained from the acetabular BM of patients undergoing hip replacement surgery as described previously.Citation23 Primary EPCs were obtained from umbilical cord blood collected from full-term pregnancies as described previously.Citation27 Human BM was obtained from the spina iliaca posterior superior of myeloma patients. The CD138+ cell population was isolated from the mononuclear cells of the myeloma BM by microbeads (Miltenyi Biotec, Bergisch Gladbach, Germany) according to manufacturer’s protocol, and used immediately in the coculture system. Used protocols were approved by the local ethics committee of the University Medical Center Utrecht in accordance with the Declaration of Helsinki; all samples were obtained after written informed consent. Culture conditions can be found in the Materials and methods in the Supplementary material.
3D cocultures
All 3D cocultures were performed as described previously.Citation23 In short, cells were cultured at 37°C in growth factor-reduced Matrigel (Corning, Corning, NY, USA) diluted by an equal volume of α-minimal essential media. For cell labeling, the Vybrant Multicolor Cell-Labeling Kit was used (DiO, DiI, DiD, ThermoFisher, Waltham, MA, USA) according to manufacturer’s protocol. MSCs, EPCs, and myeloma cells were mixed in a 4:1:1 ratio. Cultures were maintained in mixed medium (containing equal amounts of MSC medium, EPC medium, and MM medium) which was changed twice a week.
Free vs liposomal drug treatment in 3D
3D cocultures of L363-GFP or MM1S-mCherry, MSCs and EPCs were precultured for 7 days. At day 7, free or liposomal (DiD labelled, small) bortezomib and doxorubicin were inserted into the center of the 3D coculture using a micropipette. Bortezomib was added in the final concentration of 0, 2.5, and 7.5 nM. Doxorubicin was added in the final concentration of 0, 0.3, and 3 µM. The total dose per construct was equal in both the free drug and liposomal drug conditions. All cultures were live imaged at 0, 24, and 48 hours.
After 48 hours, the 3D cultures were washed three times with PBS and were fixed overnight using 4% formaldehyde (VWR Chemicals, Lutterworth, UK). The fixed cocultures were stained with phalloidin and DAPI (both FAK100 kit, Merck Millipore, Burlington, NJ, USA) according to the manufacturer’s protocol.
Primary CD138+ myeloma cells were isolated from the BM of two newly diagnosed patients. The CD138+ myeloma cells of both donors were cocultured with MSCs-DiO and EPCs-DiO for 14 days to allow tumor mass formation. At day 14, free or liposomal (DiD labelled, small) doxorubicin was added at the final concentration of 0 and 3 µM. All cultures were live imaged at 0, 24, and 48 hours. All images were taken using an SPX8 Laser Scanning Confocal Microscope (Leica, Wetzlar, Germany).
Statistical analysis
All experimental groups were handled in technical duplicates. Results are presented as mean ± standard deviation. P-values are based on Student’s t-tests (two-tailed) for two-way comparisons or ANOVA for multiple hypotheses testing using post hoc Bonferroni correction. Data analysis was performed using Prism GraphPad Software. P-values are considered statistically significant when P<0.05; *=P<0.05, **=P<0.01, ***=P<0.001.
Results
Higher resistance to therapy of myeloma cells when cultured in the 3D bone marrow model
To confirm the added value of the 3D BM–myeloma model over traditional 2D cultures, treatment effects of chemotherapeutic agents on myeloma cell lines cultured in 2D were compared to those cultured in the 3D model. When adding the drugs 1 day after assembling the 3D cultures, no differences in survival of the myeloma cells were observed after 48 hours of treatment, comparing 2D vs 3D cultures (). Increased cell survival in 3D was seen when adding treatments after 5–7 days of preculture. The difference was most pronounced in the 7 days precultured cells. Here, a significant treatment resistance of the 3D cultured myeloma cells was observed at all concentrations of bortezomib and at the highest concentration of doxorubicin ().
Figure 1 Myeloma cell survival when treated with different concentrations of bortezomib or doxorubicin in 2D vs 3D (n=2).
Notes: (A) L363 and MM1S cells were cultured in 2D, or cocultured in 3D with MSCs and EPCs. One day after preparing the cultures, both bortezomib and doxorubicin were added for 48 hours. (B) L363 and MM1S cells were cultured in 2D, or cocultured in 3D with MSCs and EPCs. Seven days after preparing the cultures, both bortezomib and doxorubicin were added for 48 hours. Data are presented as mean ± SD. *P<0.05, **P<0.01. (C) Confocal images of a 3D coculture (7 days precultured) containing L363-GFP (green) and both MSCs and EPCs (DiD, cyan) 48 hours after treatment addition (top: untreated control, bottom: 7.5 nM bortezomib). After 48 hours, ethidium homodimer-1 (red) was added to identify dead cells. Colocalization of the GFP signal and ethidium homodimer-1 identifies dead myeloma cells. Colocalization of DiD and ethidium homodimer-1 identifies dead supporting cells (white arrows). The scale bars represent 150 µm.
Abbreviations: EPCs, endothelial progenitor cells; MSCs, mesenchymal stromal cells.
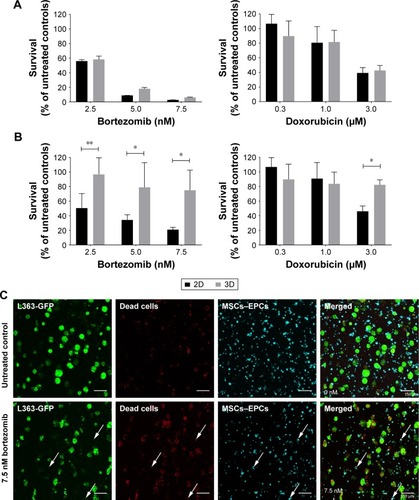
In the 3D BM–myeloma model, not only therapeutic effects toward the myeloma cells but also the nonspecific effects toward the supporting cells could be visualized and quantified using confocal microscopy. With increasing drug concentrations, increased myeloma cell death was observed, as well as increased MSCs and EPCs cell death ().
Heterogeneous pore sizes in Matrigel meshwork
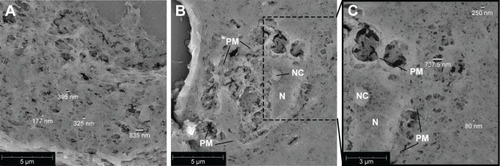
Matrigel 50% (v/v) plugs, with or without incorporated cells, were analyzed using scanning electron microscopy (SEM). Pores of various sizes could be visualized in the cross-sections, ranging betweeñ80 and 850 nm (). Also cells incorporated into the gel were visualized (). Cellular structures could be identified (plasma membrane, nucleus, and nucleolus). As the supporting cells are capable of adhering to the surrounding gel, cell–matrix interaction could be visualized, and on the sites of these interactions, larger pores could be observed within the gel. More distant from the encapsulated cell, smaller pores (~80 nm) were visualized in the gel ().
Figure 2 Scanning electron microscopy images of 5 µm cross-sections of 50% Matrigel containing myeloma cells, EPCs and MSCs cultured for 14 days.
Notes: (A) Gel meshwork with various pore sizes with the majority <200 nm. The scale bar represents 5 µm. (B) Cross-section of a cell incorporated into the gel. The scale bar represents 5 µm. (C) Zoom of (B), showing more details of the cell and meshwork of the surrounding gel. The scale bar represents 3 µm. Abbreviations: EPCs, endothelial progenitor cells; MSCs, mesenchymal stromal cells; N, nucleus; NC, nucleolus; PM, plasma membrane.
Diffusion and intracellular uptake of different sized liposomes in the 3D bone marrow model
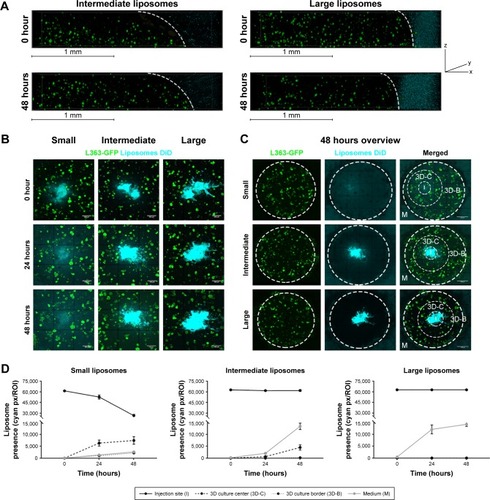
Liposomes of different sizes; small (~75 nm), intermediate (~100 nm), and large (~180 nm, ), were added to the 3D BM–myeloma model. The liposomes were added either to the medium, or were inserted into the center of the 3D culture. Diffusion of the liposomes was followed for 48 hours. Liposomes added to the medium on top of the gel for 48 hours at 37°C displayed no diffusion into the 3D BM–myeloma model for either particle size (). The small and intermediate liposomes were capable of diffusing through the 3D culture after insertion, while the large liposomes were not. An overview of the diffusion of the inserted liposomes after 48 hours is shown in . The presence of liposomes throughout the 3D culture was quantified using the mean fluorescence intensity of the liposomes at the insertion site (I), the center of the 3D culture surrounding the insertion site (3D-C), the border of the 3D culture next to the medium (3D-B) and in the medium (M) next to the culture over time. Only the small liposomes displayed a clear decreasing number of liposomes at the insertion site, with elevated numbers of liposomes throughout the 3D culture after 48 hours. The intermediate liposomes displayed a high retention at the insertion site, with elevated numbers of liposomes throughout the 3D culture after 48 hours, however, lower than for the small liposomes. The large liposomes displayed a constant presence at the insertion site; with no detectable liposomes throughout the 3D culture. Lastly, an increased fluorescence signal was detected in the medium over time in all conditions, presumably caused by liposomes diffusing from the insertion site into the medium upon administration ().
Figure 3 Diffusion of different sized liposomes in the 3D model: small (~75 nm), intermediate (~100 nm), and large (~180 nm).
Notes: (A) 3D confocal images showing 3D cocultures containing L363-GFP (green) and MSC/EPCs (unstained). DiD labeled intermediate or large liposomes (cyan) were added to the medium for 48 hours. The scale bars represent 1 mm. (B) Confocal images showing 3D cocultures into which DiD labeled liposomes (small, intermediate, or large) were inserted (cyan). The liposomes were followed directly after insertion (0 hours), after 24 hours, and after 48 hours. The scale bars represent 500 µm. (C) Confocal images showing an overview of the entire 3D culture after 48 hours for all three liposome sizes. The scale bars represent 1,000 µm. (D) The presence of liposomes was quantified on all time points at the insertion site (I), the center of the 3D culture next to the insertion site (3D-C), the border of the 3D culture next to the medium (3D-B), and inside the medium (M). Data are presented as mean ± SD.
Abbreviations: EPCs, endothelial progenitor cells; MSCs, mesenchymal stromal cells.
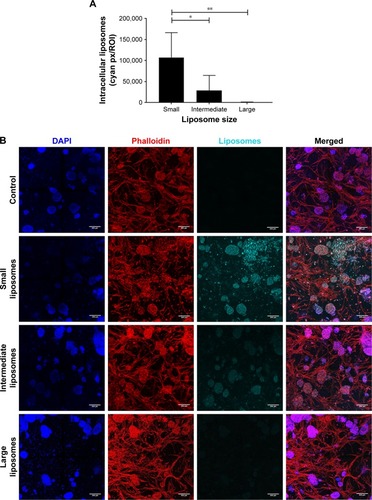
Simultaneously with diffusion, the intracellular uptake of liposomes by all present cell types was also quantified at 48 hours after insertion into the 3D BM–myeloma model. The uptake of the small liposomes was significantly higher than the intermediate and large liposomes by all cell types in the 3D culture. The intermediate liposomes also showed uptake by the cells throughout the culture, whereas the large liposomes showed low association with cells, which is consistent with their restrained distribution throughout the culture ().
Figure 4 Intracellular uptake of liposomes, 48 hours after insertion.
Notes: (A) More intracellular uptake was observed in cultures with the small liposomes (~75 nm), compared with cultures with the intermediate (~100 nm) and large liposomes (~180 nm). Intracellular liposome uptake is present both in the small and intermediate liposome plugs. Data are presented as mean ± SD. *P<0.05, **P<0.01. (B) Confocal images of intracellular liposomes in 3D, showing nuclei (DAPI, blue), f-actin (phalloidin, red), and liposomes (DiD, cyan). All cultures were washed extensively before imaging, to remove all noninternalized liposomes. The scale bars represent 200 µm.
Enhanced uptake of VLA-4 liposomes in the myeloma cells cultured in the 3D bone marrow model
The diffusion of liposomes could be hindered by increasing the volume of the 3D culture (and thus total distance to the border of the model). On the other hand, cellular uptake could be potentially enhanced using VLA-4 targeting (Figure S1). To analyze the effect of different volumes of the 3D cultures (30 or 50 µL) on the diffusion of liposomes, and the effect of VLA-4 targeting on the interaction with myeloma cells, intermediate-sized (~110 nm) liposomes were used. This size of liposomes allows them to diffuse through the model, but is less optimal than when compared with smaller-sized liposomes, providing a window to study the enhancing effect of VLA-4 targeted liposomes.
Incubation for 48 hours showed that the untargeted liposomes diffused throughout the entire larger-sized model, which means that particle migration was equivalent to about 3,000 µm from the insertion site (). However, when quantifying intracellular liposomes after 48 hours of incubation, relatively low numbers of liposomes could be found at the edges of the cultures. A gradient of intracellular liposome presence was observed from the insertion site to the borders of the culture (), showing an effect of the diffusion distance (and thus an effect of culture volume/size) on the amount of intracellular liposomes throughout the culture.
Figure 5 Enhanced liposomal uptake in myeloma cell clusters when using VLA-4 targeted liposomes.
Notes: (A) I. Confocal microscopy overview picture showing the regions that were quantified in each culture, I = insertion site. The scale bar represents 1,000 µm. II. Quantification of intracellular liposomes (~110 nm), in all regions, for both untargeted and VLA-4 targeted liposomes, 48 hours after insertion. All cultures were washed extensively before quantification, to remove all noninternalized liposomes. Data are presented as mean ± SD. **P<0.01, ***P<0.001. (B) Confocal images at the border of the plug, showing L363 cells (GFP, green), MSCs, and EPCs (DiD, red) and intracellular liposomes (rhodamine, cyan). The scale bars represent 150 µm.
Abbreviations: EPCs, endothelial progenitor cells; MSCs, mesenchymal stromal cells; VLA-4, very late antigen-4.
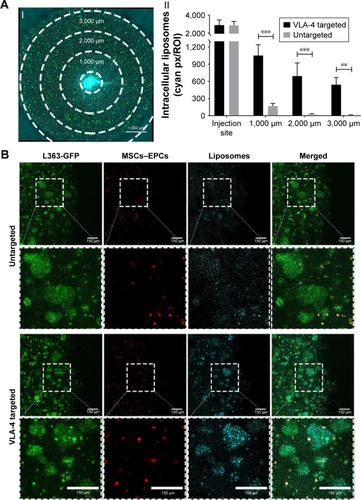
No differences were observed in the diffusion capacity of untargeted vs VLA-4 targeted liposomes over the course of 48 hours (data not shown). However, the intracellular uptake of VLA-4 targeted liposomes was significantly higher than untargeted liposomes (). The targeted liposomes showed higher accumulation in myeloma cells than supporting cells, which was demonstrated by the colocalization of GFP-positive myeloma cells and rhodamine-labeled liposomes ().
Increased myeloma cell killing and protection of the supporting environment using untargeted or VLA-4 targeted liposomes
3D myeloma–BM cultures were treated with free or liposomal (untargeted or VLA-4 targeted, ~75 nm) doxorubicin or bortezomib. Forty-eight hours after adding the treatments, cytotoxicity on supporting cells as well as on myeloma cells was analyzed. Overviews of the results are shown in .
Figure 6 Free and liposomal chemotherapy tested in the 3D myeloma–BM model.
Notes: (A) Confocal overview pictures showing 3D cocultures 48 hours after treatment. MSCs, EPCs, and myeloma cells were visualized staining f-actin (phalloidin, red). The border of each plug is indicated by a white dashed circle. The insertion site of each culture is indicated by a dotted white circle. The scale bars represent 1,000 µm. Cultures were treated with doxorubicin (six left images) or bortezomib (six right images) both with free drug, untargeted liposomes, and VLA-4 targeted liposomes (both ~75 nm). Controls were taken along with no treatments or sham treatments (PBS or empty liposomes). (B) Quantification of viable myeloma cells, 48 hours after doxorubicin treatment and (C) bortezomib treatment. (D) Quantification of viable supporting cells, 48 hours after doxorubicin treatment and (E) bortezomib treatment. Data are presented as mean ± SD (n=3). **P<0.01, ***P<0.001.
Abbreviations: EPCs, endothelial progenitor cells; MSCs, mesenchymal stromal cells; VLA-4, very late antigen-4.
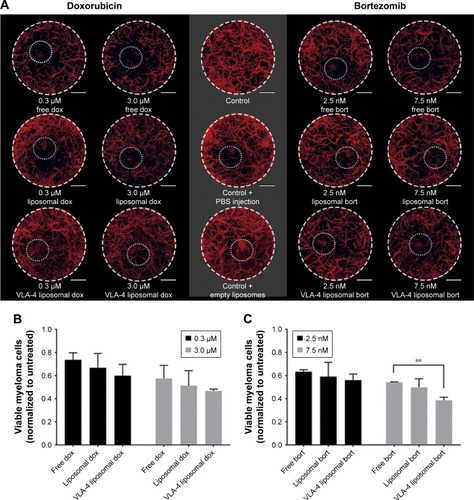
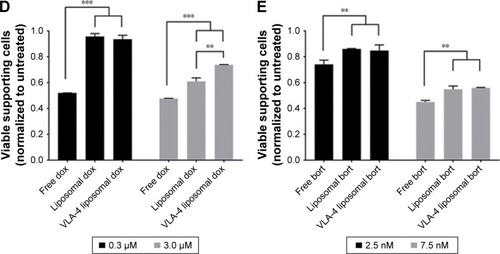
Doxorubicin, both free and liposomal, showed a dose response on myeloma cell viability for all tested conditions. No significant difference on myeloma cell survival was observed when comparing free doxorubicin, untargeted, and VLA-4 targeted liposomal doxorubicin. Nevertheless, a trend was seen showing less viable myeloma cells using liposomal doxorubicin, and the lowest number of myeloma cells using VLA-4 targeted liposomes (). Interestingly, an opposite effect was seen when analyzing the viability of supportive cells at 48 hours after doxorubicin addition; significantly less supportive cells were present in the free drug groups, when compared with the liposomal treated cultures ().
Bortezomib showed a similar trend for myeloma cell survival, with significantly lower viability when comparing free drug and VLA-4 targeted liposomal bortezomib treated cultures, at a concentration of 7.5 nM (). Also, here, an opposite effect was seen when analyzing viable supporting cells after bortezomib addition ().
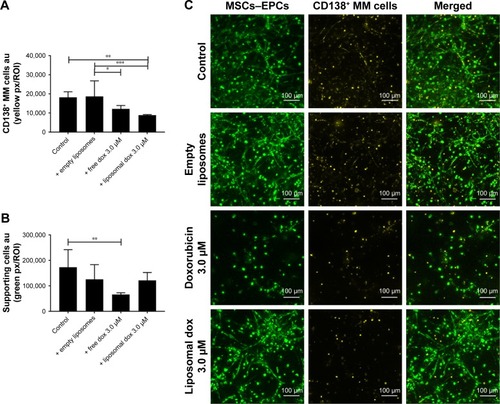
In addition, primary CD138+ cells isolated from two myeloma patients were treated with either free doxorubicin or (untargeted) liposomal doxorubicin, after culturing within the 3D myeloma–BM model for 14 days. Similar results were obtained when comparing primary myeloma cells to the myeloma cell lines used. Also, here, increased myeloma cell death was observed with liposomal doxorubicin compared with free doxorubicin, while cytotoxicity toward the supporting cells was higher using free drug ().
Figure 7 Free and liposomal doxorubicin tested on primary CD138+ myeloma cells cultured in the 3D BM model.
Notes: (A) Quantification of primary CD138+ myeloma cells, 48 hours after doxorubicin treatment. (B) Quantification of supporting cells, 48 hours after doxorubicin treatment. Data are presented as mean ± SD (n=2). *P<0.05, **P<0.01, ***P<0.001. (C) Confocal images of the 3D cocultures 48 hours after treatment, showing MSCs/EPCs (green) and primary CD138+ myeloma cells (yellow). The scale bars represent 100 µm.
Abbreviations: EPCs, endothelial progenitor cells; MSCs, mesenchymal stromal cells.
Discussion
A previously developed 3D BM–myeloma model, which mimics the BM microenvironment using prevascular MSC–EPC networks, facilitates the in vitro culture of (primary) myeloma cells.Citation23,Citation28 Interactions between the myeloma cells and the supporting BM cells improve the proliferation and survival of the myeloma cells, and induce drug resistance through CAM-DR.Citation1,Citation2 Here, we show that the 3D BM–myeloma model allows studying the behavior of nanoparticle-encapsulated molecules within its engineered 3D tumor microenvironment. The porous hydrogel system supported passive diffusion of liposomes up to ~110 nm. The ability to “deliver” liposomes throughout the 3D model enabled analysis of both passive and active cellular targeting and therapeutic efficacy of the added (encapsulated) drugs by analyzing on- and off-target effects. The ability to culture primary myeloma cells within the model enables the future study of variability in patient responses to treatments given. Next to liposomal drug therapies directly affecting the primary myeloma cells, the model can also be used to study myeloma responses to treatments targeting the tumor microenvironment or BM–myeloma interactions.
Myeloma cells are known to be more resistant to treatment when cultured in a 3D BM environment compared with classical 2D cultures.Citation17–Citation19,Citation29 Similar effects were observed when comparing 2D cultures to our 3D model. Interestingly, the resistance was seen only when adding the treatments 5–7 days after assembling the 3D model, and not when adding the treatment directly after assembling the 3D cultures. Previous studies did show differences in resistance to therapy between 2D and 3D cultured myeloma cells, when adding the drugs directly after assembling the models.Citation17–Citation19,Citation29 However, the described models vary in multiple aspects: the use of only MSCs,Citation17,Citation19 the use of other scaffolds and hydrogels,Citation17–Citation19,Citation29 and the preculture of the MSC scaffolds before the addition of myeloma cells.Citation17,Citation19,Citation29 In our model, the cells incorporated into the Matrigel still had a rounded phenotype after 1 day of culture, with no visible cell–cell interactions. After both 5 and 7 days of culture, the supporting cells had spread within the Matrigel forming networks, displaying cell–cell interactions. These results indicate a necessity to wait for myeloma–BM interactions to establish within the model before testing efficacy of potential treatments.
SEM has previously shown a pore size of ~5–200 nm within Matrigel meshworks.Citation30,Citation31 In our model, 50% (v/v) Matrigel was used, resulting in a larger variety in pore sizes (~80–850 nm) than previously reported. Most pores were in the range of 80–100 nm, which was further confirmed by an observed diffusion of small- and intermediate-sized (~75–110 nm) liposomes, and a lack of detectable diffusion when using larger liposomes (>180 nm). In vivo, particles of up to 150 nm are taken up into the BM, whereas particles of 250 nm and above are taken up to a much smaller extent.Citation32,Citation33 This suggests a biologically relevant porosity of this model, capable of mimicking the behavior of the delivered liposomes after extravasation to the BM. Other in vivo mimicking aspects of the model include the facilitation of cell–cell and cell–matrix interactions in Matrigel, which activate signaling pathways controlling cell survival, proliferation, and differentiation, modulating therapeutic responses.Citation34,Citation35 The importance of using physiologically relevant in vitro models for the evaluation of liposomal drug delivery has been emphasized previously. These complex 3D models generate results better predictive for further in vivo studies, as they more reliably evaluate chemotherapeutic agents and their delivery systems.Citation36,Citation37
Liposomal drug delivery has been tested previously in vitro in 3D, using mainly tumor spheroids. The nanoparticles delivered to the medium penetrated poorly into the solid artificial cancer mass,Citation20–Citation22 as the spheroids do not mimic the enhanced permeability and retention effect caused by leaky vasculature within tumors, allowing extravasation of nanoparticles.Citation38 The in vivo distribution of nanoparticles into the myeloid BM occurs via reticuloendothelial sinusoidal blood capillaries and the phagoendocytic route,Citation39 which is also not simulated in our 3D in vitro model. Therefore, liposomes had to be delivered to the engineered BM environment in a different manner. The insertion of liposomes into the center of the 3D culture enabled their diffusion throughout the 3D hydrogel matrix, facilitating the in vitro analysis of liposomes in a 3D BM environment, mimicking the behavior of in vivo delivered nanoparticles after distribution within the BM.
In our model, bortezomib and doxorubicin were tested, both extensively studied and used for the treatment of hematological malignancies.Citation40,Citation41 For both drugs, liposomal formulations have been shown to increase cytotoxicity toward myeloma cells in 2D cultures,Citation42,Citation43 which can be further increased using VLA-4 targeted liposomes.Citation44–Citation46 Similar results were obtained toward myeloma cells in our 3D model. Cytotoxicity toward the BM cells was reduced using a liposomal formulation of both drugs, but most pronounced for doxorubicin, known to be toxic to a wide variety of tumors as well as healthy cells.Citation47,Citation48 The occurrence of systemic toxicity caused by novel therapies is mainly tested in vivo using animal models. The utilization of 3D models to replace animal models could enable a high throughput screening system that is capable of looking at both on- and off-target effects of these novel therapies, however, only within the context of the engineered environment. Complex in vitro models containing multiple tissues would be necessary to look at distant tissue toxicities.
Although liposomes have previously been tested using 3D in vitro models, most studies focus on the on-target effect of the given therapy and not on the off-target effects.Citation20–Citation22,Citation49 These off-target effects or consequences for cell–cell interactions are equally important, as they are involved in CAM-DR.Citation10,Citation11 The 3D BM–myeloma model can be used to study therapies targeting these interactions, as shown by selectively targeting myeloma cells using VLA-4 targeted liposomes, to overcome CAM-DR. Also other novel therapies or drug delivery strategies targeting the tumor microenvironment can potentially be tested within the 3D BM–myeloma model, such as gamma secretase inhibitors, or the co-delivery of cytotoxic agents.Citation50–Citation52
In contrast to 2D culture systems, the 3D BM–myeloma model provides the possibility to test therapies on patient-derived myeloma cells. Currently available treatment options for myeloma have improved patient outcomes,Citation4 but do not achieve optimal treatment responses for a substantial proportion of patients.Citation53 Through personalized testing of experimental therapies, a genetic base for the function or dysfunction of novel therapies could be unraveled, evaluating the most optimal therapy for each individual patient. The 3D model also offers the possibility to be further extended, adding a separate endosteal environment,Citation28 or including healthy hematopoietic (stem and progenitor) cells. This would enable the analysis of treatment effects within more complex and realistic BM environment, looking at on- and off-target effects, and the involvement of indirect mediators of therapy resistance.
Conclusion
Liposomal drug delivery can be studied in vitro using a 3D BM–myeloma model, looking at cellular targeting and general efficacy of the given therapy, within the context of the engineered BM environment. The advantages of liposomal drug delivery were demonstrated in a primary myeloma model, enabling the study of patient-to-patient responses to potential drugs and treatment regimes. The analysis of treatment effects within a more complex 3D environment enables the study of on- and off-target effects, and the involvement of indirect mediators of therapy resistance.
Acknowledgments
The authors would like to thank Stavroula Zagkou for her contributions to the preparation of liposomes. This study was partially supported by NWO-HTSM grant 13312, a University Utrecht Seed grant 2013, Celgene and the Dutch Arthritis Foundation.
Disclosure
The authors report no conflicts of interest in this work.
References
- HideshimaTMitsiadesCTononGRichardsonPGAndersonKCUnderstanding multiple myeloma pathogenesis in the bone marrow to identify new therapeutic targetsNat Rev Cancer20077858559817646864
- KumarSKRajkumarVKyleRAMultiple myelomaNat Rev Dis Primers201731704628726797
- BianchiGRichardsonPGAndersonKCPromising therapies in multiple myelomaBlood2015126330031026031917
- FairfieldHFalankCAveryLReaganMRMultiple myeloma in the marrow: pathogenesis and treatmentsAnn N Y Acad Sci201613641325127002787
- de La PuentePAzabAKNanoparticle delivery systems, general approaches, and their implementation in multiple myelomaEur J Haematol201798652954128208215
- VisaniGLoscoccoFIsidoriANanomedicine strategies for hematological malignancies: what is next?Nanomedicine20149152415242825413858
- LamichhaneNUdayakumarTSD’SouzaWDLiposomes: clinical applications and potential for image-guided drug deliveryMolecules2018232E28829385755
- Martínez-JotharLDoulkeridouSSchiffelersRMInsights into maleimidethiol conjugation chemistry: conditions for efficient surface functionalization of nanoparticles for receptor targetingJ Control Release201828210110929526739
- KoningGASchiffelersRMWaubenMHTargeting of angiogenic endothelial cells at sites of inflammation by dexamethasone phosphate-containing RGD peptide liposomes inhibits experimental arthritisArthritis Rheum20065441198120816575845
- MitsiadesCSMitsiadesNSMunshiNCRichardsonPGAndersonKCThe role of the bone microenvironment in the pathophysiology and therapeutic management of multiple myeloma: interplay of growth factors, their receptors and stromal interactionsEur J Cancer200642111564157316765041
- MichigamiTShimizuNWilliamsPJCell-cell contact between marrow stromal cells and myeloma cells via VCAM-1 and alpha(4) beta(1)-integrin enhances production of osteoclast-stimulating activityBlood20009651953196010961900
- SchülerJEwerthDWaldschmidtJWäschREngelhardtMPreclinical models of multiple myeloma: a critical appraisalExpert Opin Biol Ther201313Suppl 1S111S12323742200
- LwinSTEdwardsCMSilbermannRPreclinical animal models of multiple myelomaBonekey Rep2016577226909147
- GroenRWNoortWARaymakersRAReconstructing the human hematopoietic niche in immunodeficient mice: opportunities for studying primary multiple myelomaBlood20121203e9e1622653974
- KirshnerJThulienKJMartinLDA unique three-dimensional model for evaluating the impact of therapy on multiple myelomaBlood200811272935294518535198
- FerrariniMSteimbergNPonzoniMCorrection: ex-vivo dynamic 3-D culture of human tissues in the RCCS™ bioreactor allows the study of multiple myeloma biology and response to therapyPLoS One2013810
- ReaganMRMishimaYGlaveySVInvestigating osteogenic differentiation in multiple myeloma using a novel 3D bone marrow niche modelBlood2014124223250325925205118
- de La PuentePMuzBGilsonRC3D tissue-engineered bone marrow as a novel model to study pathophysiology and drug resistance in multiple myelomaBiomaterials201573708426402156
- JakubikovaJCholujovaDHideshimaTA novel 3D mesenchymal stem cell model of the multiple myeloma bone marrow niche: biologic and clinical applicationsOncotarget2016747773267734127764795
- EetezadiSDe SouzaRVythilingamMLessa CataldiRAllenCEffects of doxorubicin delivery systems and mild hyperthermia on tissue penetration in 3D cell culture models of ovarian cancer residual diseaseMol Pharm201512113973398526394060
- PattniBSNagelliSGAryasomayajulaBTargeting of micelles and liposomes loaded with the pro-apoptotic drug, NCL-240, into NCI/ADR-RES cells in a 3D spheroid modelPharm Res201633102540255127351426
- López-DávilaVMagdeldinTWelchHDwekMVUchegbuILoizidouMEfficacy of DOPE/DC-cholesterol liposomes and GCPQ micelles as AZD6244 nanocarriers in a 3D colorectal cancer in vitro modelNanomedicine201611433134426786002
- BrahamMVJMinnemaMCAartsTCellular immunotherapy on primary multiple myeloma expanded in a 3D bone marrow niche modelOncoimmunology201876e143446529872571
- DeshantriAKKooijmansSAKuijpersSALiposomal prednisolone inhibits tumor growth in a spontaneous mouse mammary carcinoma modelJ Control Release201624324324927773734
- RozemullerHvan der SpekEBogers-BoerLHA bioluminescence imaging based in vivo model for preclinical testing of novel cellular immunotherapy strategies to improve the graft-versus-myeloma effectHaematologica20089371049105718492693
- McmillinDWDelmoreJWeisbergETumor cell-specific bioluminescence platform to identify stroma-induced changes to anticancer drug activityNat Med201016448348920228816
- PoldervaartMTGremmelsHvan DeventerKProlonged presence of VEGF promotes vascularization in 3D bioprinted scaffolds with defined architectureJ Control Release2014184586624727077
- BrahamMVJAhlfeldTAkkineniAREndosteal and perivascular subniches in a 3D bone marrow model for multiple myelomaTissue Eng Part C Methods201824530031229652626
- BelloniDHeltaiSPonzoniMModeling multiple myeloma-bone marrow interactions and response to drugs in a 3D surrogate microenvironmentHaematologica2018103470771629326121
- GelainFBottaiDVescoviAZhangSDesigner self-assembling peptide nanofiber scaffolds for adult mouse neural stem cell 3-dimensional culturesPLoS One20061e11917205123
- Ventura FerreiraMSBergmannCBodensiekIAn engineered multicomponent bone marrow niche for the recapitulation of hematopoiesis at ectopic transplantation sitesJ Hematol Oncol20169426810307
- PorterCJMoghimiSMIllumLDavisSSThe polyoxyethylene/polyoxypropylene block co-polymer poloxamer-407 selectively redirects intravenously injected microspheres to sinusoidal endothelial cells of rabbit bone marrowFEBS Lett1992305162661633861
- DavisSSIliumLMoghimiSMMicrospheres for targeting drugs to specific body sitesJ Control Release1993241–3157163
- LanghansSAThree-dimensional in vitro cell culture models in drug discovery and drug repositioningFront Pharmacol20189629410625
- XuXFarach-CarsonMCJiaXThree-dimensional in vitro tumor models for cancer research and drug evaluationBiotechnol Adv20143271256126825116894
- XuXSabanayagamCRHarringtonDAFarach-CarsonMCJiaXA hydrogel-based tumor model for the evaluation of nanoparticle-based cancer therapeuticsBiomaterials201435103319333024447463
- CharoenKMFallicaBColsonYLZamanMHGrinstaffMWEmbedded multicellular spheroids as a biomimetic 3D cancer model for evaluating drug and drug-device combinationsBiomaterials20143572264227124360576
- NgouneRPetersAvon ElverfeldtDWinklerKPützGAccumulating nanoparticles by EPR: a route of no returnJ Control Release2016238587027448444
- SarinHPhysiologic upper limits of pore size of different blood capillary types and another perspective on the dual pore theory of microvascular permeabilityJ Angiogenes Res201021420701757
- OrlowskiRZVoorheesPMGarciaRAPhase 1 trial of the proteasome inhibitor bortezomib and pegylated liposomal doxorubicin in patients with advanced hematologic malignanciesBlood200510583058306515626743
- CiolliSLeoniFCasiniCBreschiCSantiniVBosiAThe addition of liposomal doxorubicin to bortezomib, thalidomide and dexamethasone significantly improves clinical outcome of advanced multiple myelomaBr J Haematol2008141681481918410447
- AshleyJDStefanickJFSchroederVASuckowMAKiziltepeTBilgicerBLiposomal bortezomib nanoparticles via boronic ester prodrug formulation for improved therapeutic efficacy in vivoJ Med Chem201457125282529224897555
- MalamYLoizidouMSeifalianAMLiposomes and nanoparticles: nanosized vehicles for drug delivery in cancerTrends Pharmacol Sci2009301159259919837467
- KiziltepeTAshleyJDStefanickJFRationally engineered nanoparticles target multiple myeloma cells, overcome cell-adhesion-mediated drug resistance, and show enhanced efficacy in vivoBlood Cancer J201224e6422829966
- StefanickJFAshleyJDBilgicerBEnhanced cellular uptake of peptide-targeted nanoparticles through increased peptide hydrophilicity and optimized ethylene glycol peptide-linker lengthACS Nano2013798115812724003770
- AshleyJDStefanickJFSchroederVALiposomal carfilzomib nanoparticles effectively target multiple myeloma cells and demonstrate enhanced efficacy in vivoJ Control Release201419611312125312543
- PatelAGKaufmannSHHow does doxorubicin work?Elife20121e0038723256047
- TahoverEPatilYPGabizonAAEmerging delivery systems to reduce doxorubicin cardiotoxicity and improve therapeutic index: focus on liposomesAnticancer Drugs201526324125825415656
- JaganathanHGageJLeonardFThree-dimensional in vitro co-culture model of breast tumor using magnetic levitationSci Rep20144646825270048
- GoldeTEKooEHFelsensteinKMOsborneBAMieleLγ-Secretase inhibitors and modulatorsBiochim Biophys Acta20131828122898290723791707
- PisklakovaAGrigsonEOzerovaMChenFSullivanDMNefedovaYAnti-myeloma effect of pharmacological inhibition of Notch/gamma-secretase with RO4929097 is mediated by modulation of tumor microenvironmentCancer Biol Ther201617547748526934342
- BhavsarCMominMKhanTOmriATargeting tumor microenvironment to curb chemoresistance via novel drug delivery strategiesExpert Opin Drug Deliv201815764166329301448
- MitsiadesCSDaviesFELaubachJPFuture directions of next-generation novel therapies, combination approaches, and the development of personalized medicine in myelomaJ Clin Oncol201129141916192321482978