
 ?Mathematical formulae have been encoded as MathML and are displayed in this HTML version using MathJax in order to improve their display. Uncheck the box to turn MathJax off. This feature requires Javascript. Click on a formula to zoom.
Abstract
Background
The sensitivity of ELISA for biomarker detection can be significantly increased by integrating fluorescence with plasmonics. In surface-plasmon-coupled emission, the fluorophore emission is generally enhanced through the so-called physical mechanism due to an increase in the local electric field. Despite its fairly high enhancement factors, the use of surface-plasmon-coupled emission for high-throughput and point-of-care applications is still hampered due to the need for expensive focusing optics and spectrometers.
Methods
Here, we describe a new chemiplasmonic-sensing paradigm for enhanced emission through the molecular interactions between aromatic dyes and C60 films on Ag substrates.
Results
A 20-fold enhancement in the emission from rhodamine B-labeled biomolecules can be readily elicited without quenching its red color emission. As a proof of concept, we demonstrate two model bioassays using: 1) the RhB–streptavidin and biotin complexes in which the dye was excited using an inexpensive laser pointer and the ensuing enhanced emission was recorded by a smartphone camera without the need for focusing optics and 2) high-throughput 96-well plate assay for a model antigen (rabbit immunoglobulin) that showed detection sensitivity as low as 6.6 pM.
Conclusion
Our results show clear evidence that chemiplasmonic sensors can be extended to detect biomarkers in a point-of-care setting through a smartphone in simple normal incidence geometry without the need for focusing optics. Furthermore, chemiplasmonic sensors also facilitate high-throughput screening of biomarkers in the conventional 96-well plate format with 10–20 times higher sensitivity.
Introduction
The realization of highly sensitive, portable, rapid, and inexpensive biosensors is necessary to improve patient care through real-time disease monitoring and diagnosis at the point of care (POC).Citation1–Citation4 The recent advances in genomics and proteomics have led to the identification of many potential biomarkers for complex diseases. However, the widespread use of these biomarkers has been limited due to the lack of efficient POC biosensors.Citation1 For example, the WHO estimated that only 67% of tuberculosis cases were diagnosed in time in 2014, which is a mere 4% improvement over the global detection rate of 63% in 2009.Citation1,Citation5 The WHO and the US National Institutes of Health clearly emphasize that fundamental breakthroughs in POC biosensing are imperative for realizing nearly 100% early disease detection and treatment.Citation6
In the last two decades, surface plasmons from metallic nanoparticles (NPs) have been widely used to improve the detection limits for many biomarkers through fluorescence enhancements.Citation7–Citation15 Metallic NPs are known to alter fluorescence emission of dyes by influencing the radiative of dye molecules within their vicinity.Citation16 The radiative decay rate (γ) of a dye molecule, from an excited state |k > of energy Ek to a lower state |n > of energy En, through the emission of a photon of energy ℏω, may be understood in terms of the Fermi’s golden rule given by
In EquationEquation 1(1) , ℏ is reduced Planck’s constant,
is the dipole moment of the fluorescent molecule,
is the total electric field. The term ρ(r,ω) in EquationEquation 1
(1) is the photonic mode density (PMD), which is defined as the ratio of photon flow per unit area per second (ie, power flow per photon) to the velocity of photons. Similar to the electronic density of states in solid-state physics, PMD provides the density of photonic states and describes the strength of interaction between a fluorescent molecule and its photonic environment. The PMD for a dipole
aligned along the direction
can be expressed in terms of the field term
containing the dyadic Green’s function
of the system in which the dye is embedded.Citation17 The presence of metallic NPs is known to change the decay rate and enhance fluorescence emission by increasing PMD.Citation18,Citation19 Previously, we and others have demonstrated surface-plasmon-coupled emission sensors that enhance the fluorescence of dyes by increasing PMD in the presence of Ag/Au NPs and thin films.Citation7–Citation15 Here, we posit that it is also plausible to enhance fluorescence through chemical interactions between the fluorescent molecule and the photonic environment that change the matrix element (ME)
in EquationEquation 1
(1) in addition to increasing PMD.
In this article, we describe a stacked Ag/C60 POC platform to increase fluorescence emission through a new chemiplasmonic mechanism that simultaneously increases both ME and PMD. We achieved emission enhancement factors as high as 20 without the need for any lenses or other focusing optics, which are used extensively in surface-plasmon-coupled emission-based sensors. Unlike the physical mechanism that enhances only PMD, the chemiplasmonic mechanism also influences ME by selectively restricting the nonradiative rotational modes of dye molecules through π–π interactions with the C60 film. We show that the emission from the dye molecules on a chemiplasmonic platform can be excited via normally incident unpolarized light from an inexpensive laser pointer and efficiently captured using a smartphone camera. We further demonstrate that the spectra captured through the smartphone can be analyzed via an inbuilt app for obtaining quantified data for a specific biomarker. We validate a POC model assay using biotin–streptavidin (SA) complex on vertically stacked Ag/C60 layers. Lastly, we demonstrate that chemiplasmonics when integrated into a high-throughput 96-well plate model assay for a model antigen (rabbit immunoglobulin or IgG), a 10-fold enhancement in emission can be elicited, resulting in a detection limit as low as 6.6 pM.
Methods
RhB (>95%) was purchased from Sigma-Aldrich, St. Louis, MO, USA. B-BSA was obtained from Thermo Scientific, Waltham, MA, USA, while SA–RhB was from Bio-Synthesis, Inc (Lewisville, TX, USA). Glass coverslips (Sigma-Aldrich) were used as the base substrate. As described in the study by Mulpur et al,Citation26 coverslips were coated with either 25 nm of Ag using a home built thermal evaporator or 10–35 nm C60 (99.9%; SES Research, Houston, TX, USA). For studying the emission characteristics, 1 mM solution of RhB was spin coated onto the substrates at 3,000 rpm (KW-4A; Chemat Technology, Northridge, CA, USA). For physical adsorption isotherm studies, glass slides with Ag and different thickness of C60 were incubated in different concentrations of RhB in de-ionized water (0.1 M, 0.01 M, 1 mM, 0.1 mM, 0.01 mM) for 24 hours after which they were taken out and washed in de-ionized water thrice and dried in an air stream. For studies with b-BSA, substrates were prepared as detailed in the study by Ray et al.Citation27 Briefly, ~2.5 µM b-BSA solution was made in 10 mM PBS (Sigma-Aldrich) solution. Glass, glass-Ag, C60, and glass-Ag-C60 substrates were then incubated in this solution for 24 hours at 51°C. The substrates were taken out and washed in PBS solution at least three times to remove any unattached b-BSA. The samples were then incubated in 2 nM solution of SA–RhB in PBS solution at 51°C for 2 hours. They were then taken out and washed several times in PBS solution and dried in air. The photoluminescence spectra were collected by exciting the samples using an Ar+ 514.5 nm excitation (laser power ~0.1 mW) coupled to a Renishaw inVia spectrometer. All the spectra were normalized by the incident laser intensity. The spectra were fit using IGOR Pro by deconvoluting each spectrum into multiple Lorentzian functions with similar widths. A fit was deemed good for R2 (coefficient of determination) values >0.95. All the enhancement values for different substrates were obtained by dividing the peak enhancement intensity by RhB peak emission intensity on glass slide (). Perkin Elmer Lambda 950 was used to collect UV-Vis absorption spectra of the samples. Fluorescence microscopy images were taken using Zeis AXIO Imager A1 coupled to X-cite series 120 W Xe lamp at 20× magnification. The samples were excited using 532 nm light from 120 W Xe lamp, and the emission was collected through 532 nm high-pass filter. For smartphone camera sensing, the samples were excited using a 10 mW green laser pointer (HK-E00187; Laserpointer Pro, North Brunswick, NJ, USA). A long-pass filter with a cut-on wavelength ~550 nm (FEL0550; Thorlabs, Newton, NJ, USA) was taped on to the smartphone (iPhone 5s) for capturing the emitted light through the camera. The obtained pictures of emitted light were analyzed using ImageJ software to obtain the RGB content. The DFT calculations were performed using Gaussian 09 package. We used a hybrid Becke-3-Lee-Yang-Parr (B3LYP) exchange correlation with Lanl2DZ basis set (a pseudopotential approach) for the ground state calculations.
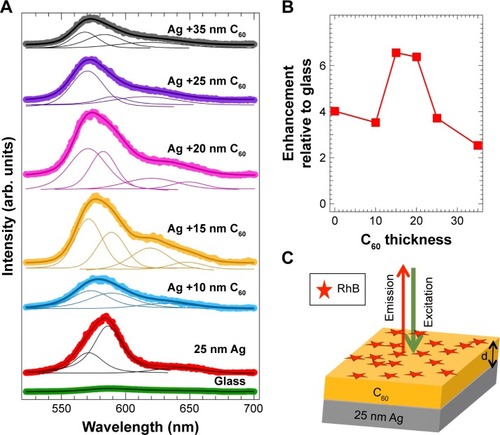
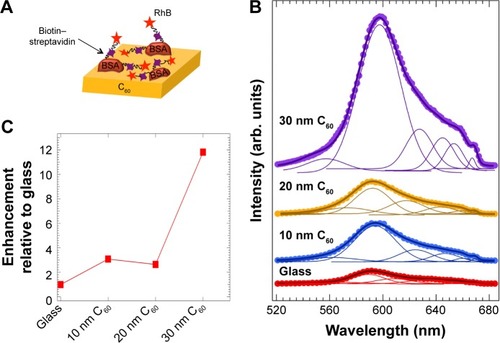
Figure 1 (A) The emission spectra of rhodamine B (RhB) adsorbed on bare glass and 25 nm Ag-coated glass with increasing thicknesses of C60 (0–35 nm). The solid traces represent fits to the spectra, from which the deconvoluted peaks for each spectrum were obtained. The area under the spectra was used to calculate the enhancement factors (relative to glass) as a function of C60 thickness shown in (B). (C) Schematic of the chemiplasmonic substrate used in this study for obtaining the emission spectra in (A).
The 96-well plate was noncovalently coated with rabbit IgG. A coating solution of IgG (10–30 µg/mL of IgG dissolved in Na-phosphate buffer, 50 mM, pH 7.4) was added to each well (25 µL/well), and slides were incubated for 2–4 hours at room temperature in a humid chamber. Slides were then rinsed with de-ionized water, washing solution (0.05% Tween 20 in water), and de-ionized water. Blocking was performed by adding blocking solution (1% BSA, 1% sucrose, 0.05% NaN3, and 0.05% Tween-20 in 50 mM Tris–HCl buffer, pH 7.4, 35 µL per well) and incubating at room temperature for 2–4 hours (or overnight at 4°C) in a humid chamber. The plate was then rinsed with de-ionized water, washing solution (0.05% Tween-20 in water), and de-ionized water, covered with Na-phosphate buffer (50 mM, pH 7.4) or blocking solution, and stored at 4°C until use. Dye-labeled conjugate dye antirabbit IgG (diluted to 10 µg/mL with Na-phosphate buffer, 50 mM, pH 7.4) was added to the wells (coated with rabbit IgG) and incubated at room temperature in a humid chamber for 1–2 hours. The plate was then rinsed with de-ionized water, washing solution (0.05% Tween 20 in water), and de-ionized water, coated with blocking buffer, and stored at 4°C before measurement. A scheme of the model immunoassay is presented in .
Results and discussion
As shown in , the emission of rhodamine B (RhB) on Ag/C60 layers evolves with the thickness of C60. Indeed, the emission intensity was found to be maximum when the C60 thickness is ~10–20 nm (). Such enhancement can be understood in terms of the well-known metal-enhanced fluorescence (MEF) model, which describes changes in emission or quenching of a fluorophore near the surface of a thin metal film.Citation15,Citation20 In the MEF framework, excited fluorophores are modeled as oscillating dipoles and their interaction with a metal surface is described through two concomitant mechanisms. The first of these is the metal-induced damping of the dipole oscillators that quenches the emission.Citation15,Citation21 The strength of such damping decreases with increasing distance (d) from the metal surface () and follows a 1/d3 dependence.Citation15,Citation21 The second mechanism is the plasmon-assisted increase in the electric field, which enhances emission and decreases with a 1/d6 dependence.Citation15,Citation21 Collectively, these mechanisms result in a distance-dependent enhancement in the fluorescence emission of the dye, as evidenced in . A maximum of six-fold enhancement in the RhB emission on Ag (25 nm)/C60 was recorded when the C60 film thickness was ~10–20 nm ().
Interestingly, the line shape and width of the fluorescence spectrum are significantly influenced by the C60 film thickness. Although many previous studies explained the emission enhancements through the MEF model, changes in the spectral features, such as in , were partly ignored.Citation8,Citation9,Citation12,Citation13,Citation22,Citation23 While the emission spectrum of RhB on 25 nm Ag required a two-peak fit, at least three to four peaks were necessary to fit the emission spectrum of RhB on Ag/C60 layers. This important fact is also reflected in , which show fluorescence microscope images of RhB coated on bare glass, 25 nm Ag, and 25 nm Ag/20 nm C60. Clearly, the emission of RhB present on Ag appears orange unlike the emission of RhB on either glass or Ag/20 nm C60 substrates that display a distinct red color. A closer examination of the emission spectra () revealed that the red emission (above 600 nm), which is otherwise present in RhB coated on glass, is 1) completely quenched when RhB is coated on a 25 nm thick Ag substrate and 2) remains unaffected when RhB is coated on 20 nm bare C60 film (without Ag). These observations suggest that in the former case (ie, case 1) the Ag films strongly quenched RhB emission in the red region. Similar to bare Ag films, the emission spectrum was found to shift to higher wavelengths for conventional spacer layers such as SiO2 (Figure S1). We hypothesize that C60 is able to retain the original features of RhB emission spectrum through π–π stacking, which is discussed later in .
Figure 2 Fluorescence microscope images of rhodamine B (RhB)-coated glass (A), glass +25 nm Ag (B), and glass +25 nm Ag +20 nm C60 (C). The bright spots arise from accumulated RhB. The figures are 100×100 microns. The magnification is 10×. (D) The corresponding RhB emission spectra from different substrates (glass, 25 nm Ag, 20 nm C60, and 25 nm Ag +20 nm C60) clearly show that the Ag layer quenches the red emission from RhB (shown by green hatched area in 25 nm Ag spectrum). The gray colored circles in the top two spectra show the magnified (×10) RhB spectrum on the glass for comparison.
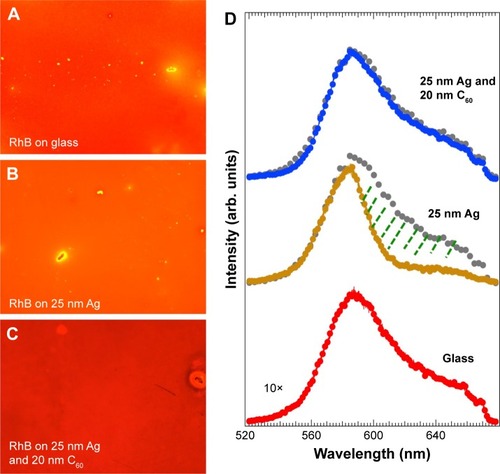
Figure 3 (A) The emission spectra of rhodamine B (RhB) adsorbed on a bare glass substrate with increasing thickness of C60 (0–30 nm). The solid lines show the fits to the spectra along with the deconvoluted peaks under each spectrum. (B) When the C60 film thickness reached 20 nm, an emission enhancement of ~1.5 was observed due to the π–π interactions between the RhB molecules and C60. (C) The adsorption isotherms for RhB on C60 show an increasing trend unlike 25 nm Ag or bare glass substrates, suggesting the presence of strong π-orbital interactions between C60 and RhB.
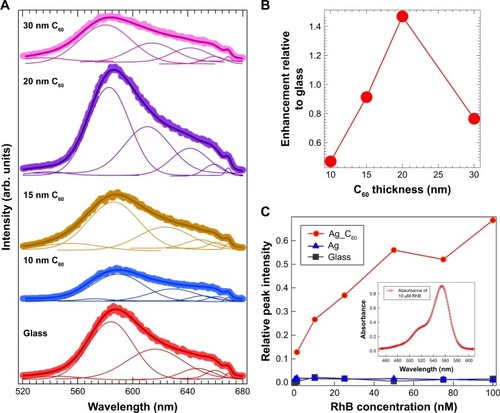
Remarkably, RhB on bare C60 (without Ag) also exhibited a non-negligible thickness-dependent enhancement (). This enhancement, unlike the physical mechanism in case of Ag-RhB, arises due to the chemical interactions between C60 and RhB molecules. We surmise that the π-orbitals in C60 and RhB can result in π–π stackingCitation8 and thereby influence the ME in EquationEquation 1(1) by restricting those rotational/vibrational modes of RhB molecules that would otherwise participate in the nonradiative decay of excited electrons. We obtained adsorption isotherms of RhB on Ag/C60 substrates to confirm the presence of π–π interactions (). Using the maximum peak intensity in the absorption spectrum of RhB (inset in ) as an indicator for the amount of RhB adsorbed on the substrates, it is evident from that the adsorption of RhB on Ag/C60 is stronger and follows a Freundlich-like behavior (indicative of multilayered adsorption) unlike RhB on glass or Ag. More importantly, as shown in Figure S2, the emission of RhB on C60 substrates was found to be predominantly p-polarized (unlike RhB on glass or Ag), indicating that the RhB molecules assume a preferred orientation on C60 due to π–π interactions.
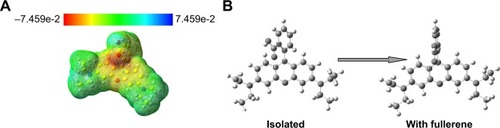
To further examine the nature of these interactions, we investigated the molecular electrostatic potential of RhB (). We found that the dangling oxygen of carboxylic group (in benzoic acid present below the xanthene ring) has electron-rich regions and may serve as a donor. It should be noted that the highest-occupied and lowest unoccupied molecular orbital levels of RhB (/C60) are located at 5.6 eV (/6.2 eV) and −3.5 eV (/−4.1 eV) with respect to vacuum indicating that C60 is a suitable acceptor.Citation24,Citation25 Such charges transfer interactions and the mixing of RhB molecular orbitals with C60 electronic states could result in an enhanced emission through the so-called chemical mechanism due to an increase in ME in EquationEquation 1(1) . Our density functional theory (DFT) calculations () showed that the benzoic acid group rotates by 32° upon interaction with C60 and thereby restricts some of the rotational modes in RhB. Our DFT results further suggest that the observed chemical enhancement in RhB emission on bare C60 could possibly result from changes to ME (EquationEquation 1
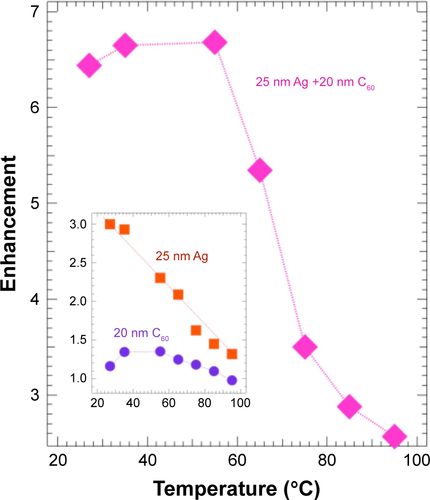
(1) ) through both charge transfer between RhB and C60 and the restriction of rotational motion of the benzoic acid group. Figure S3 shows the temperature dependence of enhancement factor of RhB on Ag, 20 nm C60, and Ag/20 nm C60. As expected, the enhancement factor reduces with increasing temperature due to the increased molecular vibrations, which rapidly decrease the radiative lifetime. While Ag film showed a linear decrease in the enhancement factor with temperature, C60 films (both bare C60 and Ag/C60) exhibited a stable enhancement factor up to 55°C followed by a sudden decrease above 55°C. This suggests that at higher temperatures (>55°C) the ben-zoic acid groups in RhB on C60 overcome the restriction imposed () by its binding with C60. The maximum observed chemical enhancement of RhB emission on bare C60 was ~1.4, which is consistent with thê1.5 enhancement in . These low enhancement factors are attributed to self-quenching, which possibly arises from multilayer adsorption of RhB molecules on C60, akin to the behavior of the adsorption isotherms in .
Figure 4 (A) The molecular electrostatic potential for rhodamine B (RhB) shows that its carboxylic group is electron rich (yellow color). (B) The interaction of RhB with C60 results in the rotation of its carboxylic group in the benzoic acid above the xanthene ring by 32°.
We alleviated the problems associated with RhB multilayer adsorption through the use of the biotin–SA complex. We first covered the bare C60 surface (without Ag) with biotinylated BSA (b-BSA) and then coated it with RhB-labeled SA (). Biotin and SA have strong nonspecific interactions that lead to binding of four biotin molecules to each SA. Such selective binding between biotin and SA mitigates multilayer adsorption of dye molecules when RhB-labeled SA attaches exclusively to b-BSA. As depicted in , the bare C60 films (without Ag) showed a 12-fold enhancement in the emission upon lessening the aggregation-induced self-quenching of RhB. This enhancement is rather intriguing particularly because the RhB molecules are not directly present on the C60 surface unlike in . It may be rationalized that the biotin–SA complex is sufficiently flexible due to its noncovalent nature and supports chemical interaction between RhB and C60 ().
Figure 5 (A) A schematic showing the model biotin–streptavidin assay on pure C60 layers of varying thickness. The biotin–streptavidin is flexible to allow the direct interaction between rhodamine B (RhB) attached to streptavidin with the underlying C60 layers. (B) The emission spectrum of the biotin–streptavidin–RhB complex on C60 layers with varying thickness displays a clear enhancement (shown in (C)) due to the chemical interactions between C60 and RhB. The solid lines in (B) show the fits to the spectra along with the deconvoluted peaks under each spectrum.
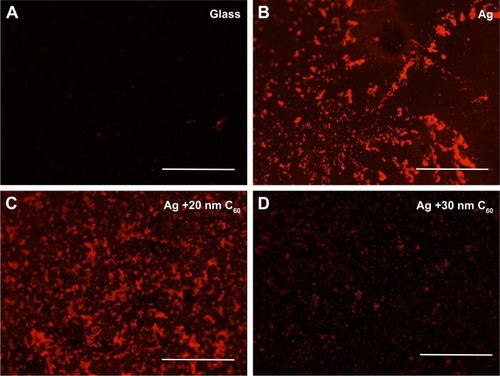
We combined the chemical enhancement observed in C60–biotin–SA–RhB system with the physical mechanism by incorporating a 25 nm thick Ag layer (). This synergistic combination displayed much higher enhancement ~20-fold () than either mechanism (~6-fold for physical and ~12-fold for chemical). We found that the maximum enhancement occurred ~15–20 nm C60 thickness in similar to the enhancements observed in . Indeed, these enhancements are also apparent in the fluorescence microscope images of biotin–SA–RhB on different substrates shown in . While the RhB-labeled SA is not visible on the bare glass substrate, they can be clearly observed on Ag and Ag/20 nm C60 substrates. Not surprisingly, the presence of biotin–SA complex between RhB and bare Ag serves as a spacer material and thus slightly reduced (but did not eliminate) the effects of metal-induced quenching of red emission in RhB (discussed earlier in ) leading to a bright red color image (). This reduced quenching is also evident in the emission spectrum of Ag–biotin–SA–RhB complex (), which displayed some weak features above 600 nm. As expected, the increase in the thickness of C60 to 30 nm decreases the emission relative to Ag and Ag/20 nm C60 due to a rapid decrease in the plasmon-induced field as a function of distance.
Figure 6 (A) The emission spectra of biotin–streptavidin–rhodamine B (RhB) adsorbed on the pure glass and 25 nm Ag-coated glass with different thicknesses of C60 (0–30 nm). The solid lines show the fits to the spectra along with the deconvoluted peaks under each spectrum. The area under the spectra was used to calculate the enhancement factors relative to glass shown in (B). (C) A schematic showing the model biotin–streptavidin assay on Ag + C60 layers of varying thickness geometry that was used for obtaining the emission spectra in (A).
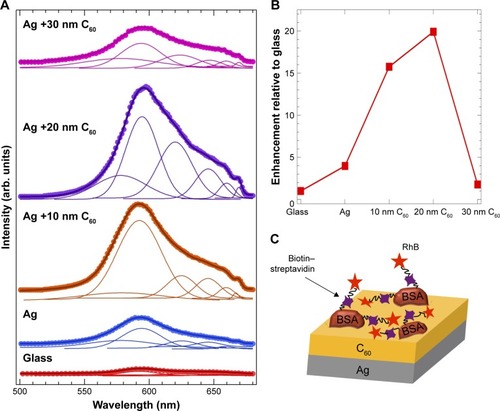
Figure 7 Fluorescence microscope images of biotin–streptavidin–rhodamine B (RhB) on glass (A), glass +25 nm Ag (B), glass +25 nm Ag +20 nm C60 (C), and glass +25 nm Ag +30 nm C60 (D). All the scale bars are 50 µm; the magnification is 10×.
The combination of physical and chemical mechanisms synergistically increases the enhancement factor through a new chemiplasmonic paradigm ~20-folds without the need for any lenses or focusing optics in a simple normal incidence and collection geometry (). Going beyond the simple demonstration of this chemiplasmonic enhancement, we used this unique feature to realize: 1) smartphone-based POC sensing capabilities and 2) sensing in a high-throughput 96-well plate.
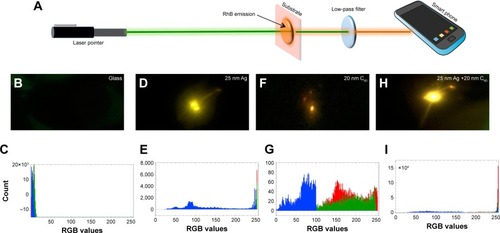
As shown in , a smart phone camera was used to capture the emitted light by exciting the substrates with a conventional laser pointer (see Methods section). We did not observe any detectable emission for RhB on the bare glass, while 25 nm Ag, 20 nm C60, and Ag/20 nm C60 exhibited bright emission spots (). The emission from the Ag substrate appeared more yellow than the emission from C60 and Ag/C60 due to the quenching of red emission, as expected (). More importantly, the emission was clearly the brightest for Ag/20 nm C60. The analysis of red, green, blue or RGB intensity values showed that the counts for Ag/20 nm C60 were ~17 times higher, indicating that it is a robust and sensitive platform for POC detection (). Another important advantage of using Ag/C60 films is that the red emission is not completely quenched. The Rayleigh scattering effects, which increase with decreasing wavelength, play a critical role in reducing the emission intensity reaching the smartphone camera in POC settings. In this regard, Ag/C60 films that support longer wavelength red emission and ~17–20 times enhancement in a simple geometry without focusing optics are ideal for POC biosensors.
Figure 8 (A) A schematic showing the setup for smartphone-based sensing. A laser pointer emits green light to excite rhodamine B (RhB) coated on different substrates (shown in pink). The excited RhB molecules emit orange-red light, which could be captured by the smartphone through a low-pass filter. (B–I) The photographs of RhB emission obtained using a smartphone. The photographs were analyzed using ImageJ software for obtaining the red, green, blue values. It should be noted that RGB values are integer values ranging between 0 and 255 and allow for the identification of ~16.7 million colors.
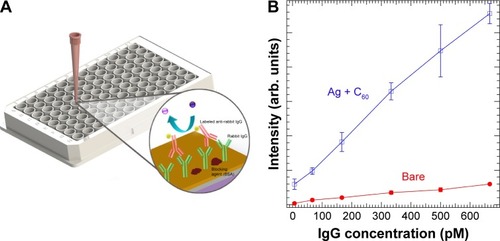
Lastly, in addition to an instrument-free POC setting, a high-throughput 96-well plate assay based on chemiplasmonic enhancements is also demonstrated (). To test the applicability of the presented technology, a model antigen (rabbit IgG) and antibody (labeled antirabbit IgG) were used. On average, the labeled antirabbit IgG showed 10 times enhancement in its emission with Ag and C60 coatings with an order of magnitude lower limit of detection ~6.6 pM (). These results provide compelling evidence for the utility of chemiplasmonic sensors in practical biochemical applications.
Figure 9 (A) A 96-well plate assay showing the scheme for rabbit IgG immunoassay. (B) The emission of dye-labeled antirabbit IgG on Ag + C60-coated 96-well plate showed ~10 times enhancement relative to the uncoated well plate. The slope of the emission intensity vs analyte concentration for Ag + C60 well plate was an order of magnitude higher than the uncoated plate, leading to an order of magnitude lower limit of detection.
In this article, we showed that a synergistic combination of physical enhancement through Ag surface plasmons and the chemical interactions of dyes with C60 results in a new chemiplasmonic paradigm. While the physical plasmonic mechanism shows six-fold enhancement and the chemical interactions exhibit ~12-fold enhancement, ~20-fold enhancement can be achieved in the chemiplasmonic paradigm. We demonstrated two model assays using biotin–SA and rabbit immunoglobulin assay to demonstrate the practical applications of the chemiplasmonic sensors. Our results show clear evidence that chemiplasmonic sensors can be extended to detect biomarkers in a POC setting through a smartphone in simple normal incidence geometry without the need for focusing optics. Furthermore, chemiplasmonic sensors also facilitate high-throughput screening of biomarkers in the conventional 96-well plate format with 10 times higher sensitivity.
Author contributions
All authors contributed to data analysis, drafting or revising the article, gave final approval of the version to be published, and agree to be accountable for all aspects of the work.
Acknowledgments
RP is grateful to the Department of Physics and Astronomy, Clemson University, for providing the start-up funds. The authors also thank Bishwambhar Sengupta, Department of Physics, Clemson University, for his initial help with the data collection.
Supplementary materials
The supporting information shows the schematic of rhodamine B electronic structure and polarization measurements of rhodamine B on C60 and glass.
Figure S1 The emission spectrum for rhodamine B (RhB) on bare glass and 20 nm SiO2-coated glass slides. The emission of RhB upshifted (dashed vertical lines) in the presence of SiO2 layer due to the absence of π–π interactions. The peak ~675 nm (pointed by the arrow) is used for calibration.
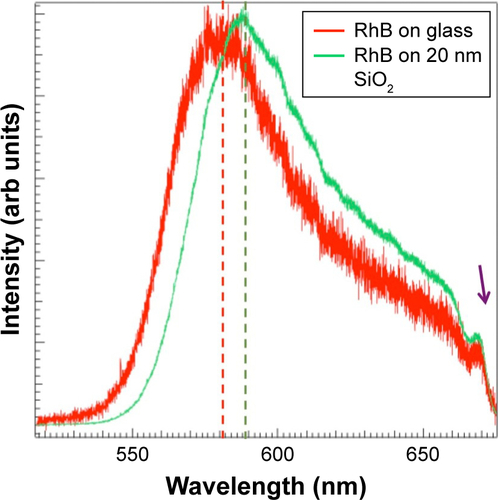
Figure S2 Polarized emission intensity plots of rhodamine B (RhB) showing predominantly p-polarized output when coated on glass/C60 substrate (A), and the absence of such polarized emission on bare glass (B). The predominant p-polarized emission on glass/C60 is attributed to the π–π interactions between RhB and C60.
Abbreviations: I(P), p-polarized intensity; I(S), s-polarized intensity.
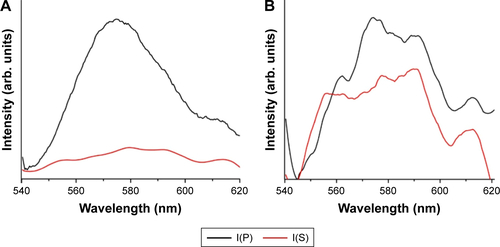
Figure S3 Temperature dependence of the enhancement factor of rhodamine B (RhB) on 20 nm C60, 25 nm Ag, and 25 nm, and Ag +20 nm C60 relative to bare glass substrate.
Disclosure
The authors report no conflicts of interest in this work.
References
- VasanASMahadeoDMDoraiswamiRHuangYPechtMPoint-of-care biosensor systemFront Biosci2013513971
- RodaAMicheliniEZangheriMdi FuscoMCalabriaDSimoniPSmartphone-based biosensors: a critical review and perspectivesTrAC Trends Analyt Chem201679317325
- TokelOInciFDemirciUAdvances in plasmonic technologies for point of care applicationsChem Rev2014114115728575224745365
- HuJWangSWangLAdvances in paper-based point-of-care diagnosticsBiosens Bioelectron20145458559724333570
- World Health OrganizationWorld Health Statistics 20142014175 Available from: https://www.who.int/gho/publications/world_health_statistics/2014/en/AccessedSeptember 6, 2018
- PeelingRWMabeyDPoint-of-care tests for diagnosing infections in the developing worldClin Microbiol Infect20101681062106920670288
- ChoiBIwanagaMMiyazakiHTSugimotoYOhtakeASakodaKOvercoming metal-induced fluorescence quenching on plasmo-photonic metasurfaces coated by a self-assembled monolayerChem Commun201551571147011473
- MulpurPYadavilliSMulpurPFlexible Ag-C60 nano-biosensors based on surface plasmon coupled emission for clinical and forensic applicationsPhys Chem Chem Phys20151738250492505426345678
- MulpurPPodilaRLingamKAmplification of surface plasmon coupled emission from graphene–Ag hybrid filmsJ Phys Chem C2013117331720517210
- ChenC-WWangC-HWeiC-MHighly sensitive emission sensor based on surface plasmon enhanced energy transfer between gold nanoclusters and silver nanoparticlesJ Phys Chem C20101142799802
- FuYLakowiczJREnhanced fluorescence of Cy5-labeled oligonucleotides near silver island films: a distance effect study using single molecule spectroscopyJ Phys Chem B200611045225572256217092001
- LakowiczJRMalickaJGryczynskiIGryczynskiZDirectional surface plasmon-coupled emission: a new method for high sensitivity detectionBiochem Biophys Res Commun2003307343543912893239
- EnderleinJRuckstuhlTThe efficiency of surface-plasmon coupled emission for sensitive fluorescence detectionOpt Express200513228855886519498918
- GryczynskiIMalickaJGryczynskiZLakowiczJRSurface Plasmon-Coupled Emission with Gold FilmsJ Phys Chem B200410833125681257420729993
- LakowiczJRRadiative decay engineering 3. Surface plasmon-coupled directional emissionAnal Biochem2004324215316914690679
- AngerPBharadwajPNovotnyLEnhancement and quenching of single-molecule fluorescencePhys Rev Lett2006961111300216605818
- NovotnyLHechtBPrinciples of Nano-OpticsCambridgeCambridge University Press2006
- LakowiczJRRadiative decay engineering: biophysical and biomedical applicationsAnal Biochem2001298112411673890
- BarnesWLFluorescence near interfaces: the role of photonic mode densityJ Mod Opt1998454661699
- ZhangYAslanKPreviteMJRGeddesCDMetal-enhanced fluorescence: surface plasmons can radiate a fluorophore’s structured emissionAppl Phys Lett2007905053107
- FengALYouMLTianLDistance-dependent plasmon-enhanced fluorescence of upconversion nanoparticles using polyelectrolyte multilayers as tunable spacersSci Rep20155777925586238
- SrinivasanVRamamurthySSPurcell factor: a tunable metric for plasmon-coupled fluorescence emission enhancements in cermet nanocavitiesJ Phys Chem C2016120529082913
- CaoSHCaiWPLiuQLiYQSurface plasmon-coupled emission: what can directional fluorescence bring to the analytical sciences?Annu Rev Anal Chem201251317336
- LiYQiDSongPMaFFullerene-based photoactive layers for heterojunction solar cells: structure, absorption spectra and charge transfer processMaterials201481425628787923
- ZhangZYuYWangPHierarchical top-porous/bottom-tubular TiO2 nanostructures decorated with Pd nanoparticles for efficient photoelectrocatalytic decomposition of synergistic pollutantsACS Appl Mater Interfaces20124299099622233777
- MulpurPPodilaRRamamurthySSKamisettiVRaoAMC60 as an active smart spacer material on silver thin film substrates for enhanced surface plasmon coupled emissionPhys Chem Chem Phys20151715100221002725785916
- RayKBaduguRSzmacinskiHLakowiczJRSeveral hundred-fold enhanced fluorescence from single fluorophores assembled on silver nanoparticle-dielectric-metal substrateChem Commun201551811502315026