 ?Mathematical formulae have been encoded as MathML and are displayed in this HTML version using MathJax in order to improve their display. Uncheck the box to turn MathJax off. This feature requires Javascript. Click on a formula to zoom.
Abstract
Background
The aim of this study was to optimize the different process parameters including pressure, temperature, and polymer concentration, to produce fine small spherical particles with a narrow particle size distribution using a supercritical antisolvent method for drug encapsulation. The interaction between different process parameters was also investigated.
Methods and results
The optimized process parameters resulted in production of nanoencapsulated paracetamol in L-polylactide with a mean diameter of approximately 300 nm at 120 bar, 30°C, and a polymer concentration of 16 ppm. Thermogravimetric analysis illustrated the thermal characteristics of the nanoparticles. The high electrical charge on the surface of the nanoparticles caused the particles to repel each other, with the high negative zeta potential preventing flocculation.
Conclusion
Our results illustrate the effect of different process parameters on particle size and morphology, and validate results obtained via RSM statistical software. Furthermore, the in vitro drug-release profile is consistent with a Korsmeyer–Peppas kinetic model.
Introduction
The morphology, particle size, and distribution of nanoparticles determine drug delivery and bioavailability using these systems, because these characteristics improve the drug solubility in the aqueous media of the body. The pharmaceutical industry needs to produce smaller nanoencapsulated drugs with a narrow size distribution to improve drug delivery using needle-free injections, dry powder inhalers, and controlled-release devices. Using supercritical carbon dioxide (ScCO2) as a medium in nanoencapsulation processes is a practical choice, because most pharmaceutical compounds are thermally labile and thus encapsulated drugs should be free from any organic solvent residues and artifacts. In contrast with conventional techniques, the advantages of ScCO2 techniques are their single-step nature, a mild operating temperature, and a very narrow particle size distribution with controlled morphology.Citation1 Supercritical fluid technologies are clean and effective methods for drug encapsulation which enable the production of small particle sizes with a narrow distribution, allowing for greater flexibility of drug administration. Furthermore, increasing bioavailability decreases the drug dosage necessary and enables controlled release over a sustained period of time.Citation2–Citation8 Small-sized drugs can accelerate towards target organs and be distributed evenly throughout the body.Citation9–13 In this study, paracetamol was encapsulated in a biodegradable L-polylactide polymer at different temperatures, pressures, and polymer concentrations using a supercritical antisolvent technique. We investigated the effect of these different process parameters on particle size and morphology. The optimum particle size was determined via RSM statistical software and confirmed by scanning electron microscopy.
Methods and materials
Poly L-lactic acid (intensive viscosity 2.0 dL/g) and highpressure liquid chromatography grade methylene chloride were obtained from Sigma-Aldrich (St Louis, MO). Paracetamol (99.9%) was obtained from the Faculty of Medicine and Health Science, University Putra Malaysia. High-pressure liquid chromatography grade acetone was obtained from Fisher Scientific (Leicestershire, UK). Purified grade carbon dioxide is used as the supercritical fluid.
Preparation of nanoparticles
Supercritical CO2 was pumped into a high-pressure vessel (490 mL) at specific gas density. The solute was sprayed by a high-pressure pump (SCF P-50A; Thar, Pittsburgh, PA) through a 2 μm diameter nozzle. The solvent diffused rapidly from the solution droplets into the bulk supercritical fluid, precipitating the solute. Analysis of variance was performed using RSM software (v6; Maitland, FL). Optimization of particle size was obtained by varying the process conditions. The various process parameters, including pressure, temperature, and polymer concentration used for particle nanoencapsulation are summarized in . The operating conditions were then kept constant while varying the other process parameters, as shown in .
Table 1 Variable process parameters
Table 2 Fixed process parameters
Characterization
Scanning electron microscopy
Scanning electron microscopy (S-3400N; Hitachi, Tokyo, Japan) was used to characterize the morphology and size of the nanoencapsulated particles. Each sample was adhered to adhesive carbon tape on an aluminum stub and coated with gold palladium (Emitech K550X; Quorum Technologies Ltd, West Sussex, UK) at 35 mA for 2 minutes in a vacuum equal to 1 × 10⁻⁴ bar.
Thermogravimetric analysis
Thermogravimetric analysis (model TGA/SDTA851; Mettler-Toledo, Columbus, OH) was used to determine weight loss as a function of incremental temperature. Analysis was performed by increasing the temperature gradually from 50°C up to 600°C at a rate of 5°C/min and purging the gas with nitrogen at a flow rate of 20 mL/min.
Zeta potential
A ZEN 2600 Zetasizer (Malvern Instruments, Worcestershire, UK) with laser diffractometry was used to characterize the zeta potential of the encapsulated paracetamol. A nanoparticle sample weighing 1.5 mg was suspended in 5 mL of distilled water. The mean value from 20 successive readings was taken as the zeta potential of the paracetamol-L-polylactide nanoparticles.
In vitro drug release
The paracetamol released into the phosphate-buffered saline medium was analyzed using ultraviolet-visible spectrometry (Model 1650-PC; Shimadzu, Kyoto, Japan) at 243 nm. Nanoencapsulated paracetamol 25 mg was placed into 50 mL of phosphate-buffered saline (pH 7.4) containing sodium azide 0.025%. The sample was placed in a shaking incubator maintained at 50 rpm and 37°C. Aliquots of 2 mL were removed from the 50 mL suspension on various days up to 30 days, and the volume lost was immediately replaced with fresh phosphate-buffered saline.
Results and discussion
The significant effects constitute the model. The F-value in the model was shown to be significant (F < 0.05) for A, B, C, B2, AC, AB, and BC (where A, B, C are temperature, pressure, and concentration). The following RSM equation was fitted to the response variable (particle size) and three independent variables, ie, temperature (A), pressure (B), and concentration (C):
The effect of density on particle size is shown in . Enhancing supercritical fluid density decreased the particle size. The effect of temperature on particle size was more pronounced at low pressure. The effect of concentration on particle size was different, in that particle size was influenced simultaneously by the degree of super saturation and by the initial concentration. Therefore, it is crucial to adjust the initial polymer concentration. The chemical potential differences between the fluid and solid phases during the supercritical antisolvent process are the driving force for the phase transition, and thus, crystallization. These differences depend on solute activity in the solution at equilibrium. Phase transition occurs spontaneously when there is a negative change in the chemical potential, whereas phase transition is made thermodynamically impossible by a positive change in the free energy. In the thermodynamic equilibrium state, the change in free energy is zero, as follows:
Figure 1 Response surface plots for particle size as a function of (A) pressure and concentration, (B) temperature and concentration, and (C) temperature and pressure.
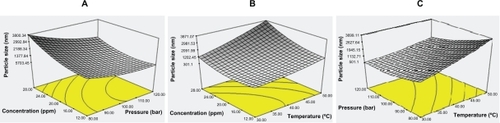
The activity coefficient is a function of the pressure and temperature in a supercritical fluid. Based on this equation, it is clear that the presence of CO2 antisolvent dilutes the mixture and decreases the mole fraction of the solute, and thus reduces the chemical potential. Furthermore, the presence of the CO2 antisolvent significantly decreases the equilibrium concentration (). In addition, super saturation in the bulk reactor affects particle growth. The nucleation rate determines both mean particle size and also the total number of particles, and the chemical potential difference is clarified in terms of super saturation, (S), as follows:
The super saturation ratio is the solute concentration: solubility ratio or the super saturation concentration. On the other hand, super saturation is a proportion of the degree by which the solute concentration in the solution exceeds the equilibrium concentration at a specified temperature and pressure. If the concentrations of a nonvolatile solute are very low (typically less than 10−4 mole fraction), the ratio of the fugacity coefficients is approximately equal to 1 and the ratio of supersaturation is equal to the ratio of concentration as follows:
Based on both statistical data and scanning electron microscopic images, the optimum design point is 120 bar, 30°C, and a polymer concentration of 16 ppm. Scanning electron microscopic images of products produced at temperatures below 45°C showed fine spherical particles at all pressures tested. The effect of density on particle size and morphology is shown in . The scanning electron microscopic images validate the RSM software results. The thermal stability of nanoencapsulated paracetamol inside the L-polylactide polymer was investigated by thermogravimetric analysis at 120 bar, 30°C, and a polymer concentration of 16 ppm. From , it is evident that the temperature for maximum weight loss of paracetamol from the nanoparticles shifted to 32°C due to the L-polylactide polymer nanolayer covering the paracetamol. Furthermore, the thermogram of nanoencapsulated paracetamol inside L-polylactide was similar to that for pure L-polylactide due to the higher ratio of pure polymer in the solute.
Figure 2 Scanning electron microscopic images of nanoencapsulated paracetamol inside L-polylactide at different process parameters.
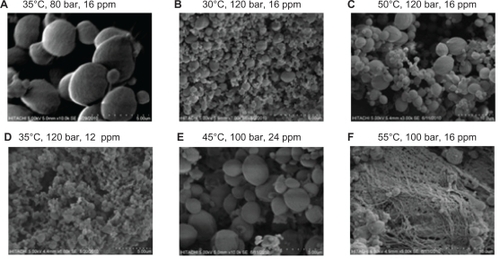
Figure 3 Thermogravimetric analysis of pure paracetamol, pure L-polylactide, and encapsulated paracetamol inside L-polylactide.
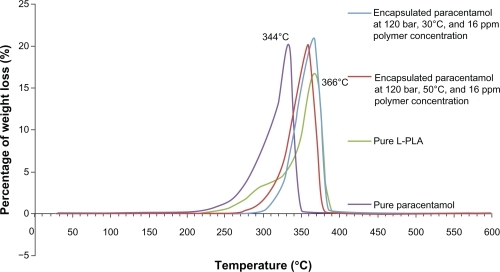
Figure 4 Zeta potential distribution graph of nanoencapsulated paracetamol inside L-polylactide.
Notes: The nanoparticles had a large negative zeta potential (−33 ±3 mV) as shown in Figure 4 due to the presence of carboxyl end groups of the L-polylactide chain. Sustained release of paracetamol in phopshate-buffered saline was investigated over 4 weeks. The first burst happened after 1 week and the cumulative paracetamol release versus time are shown in .
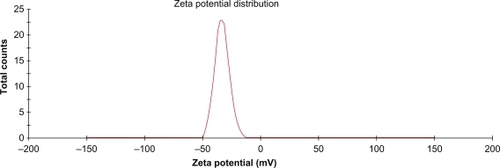
Figure 5 In vitro release profile of paracetamol encapsulated in L-polylactide based on the Korsmeyer–Peppas model.
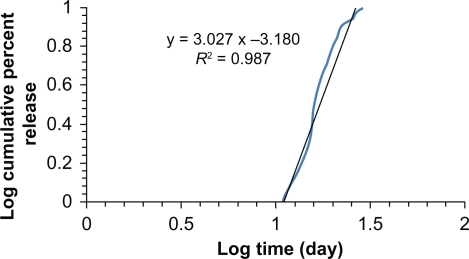
The kinetics were fitted to a Korsmeyer–Peppas model as follows:
Disclosure
The authors report no conflicts of interest in this work.
References
- YorkPKompellaUBShekunovBYSupercritical Fluid Technology for Drug Product DevelopmentSwarbrickJNew YorkMarcel Dekker, Inc2004
- AleksandarMSHsuJPFinely Dispersed Particles: Micro-, Nano-, and Atto-engineeringLondon, UKTaylor and Francis2006
- KangJWWuJYinGPreparation, characterization and in vitro cytotoxicity of indomethacin-loaded PLLA/PLGA microparticles using supercritical CO2 techniqueEur J Pharm Biopharm200870859718495445
- FagesJLochardHLetourneauJSauceauMRodierEParticle generation for pharmaceutical applications using supercritical fluid technologyPowder Technology2004141219226
- WuKLiJPrecipitation of a biodegradable polymer using compressed carbon dioxide as antisolventJ Supercrit Fluids200846211216
- GintyPWhitakerMShakesheffMHowdleSDrug delivery goes supercriticalNanotoday20054248
- WangYDaveRNPfefferRPolymer coating/encapsulation of nanoparticles using a supercritical anti-solvent processJ Supercrit Fluids2004288599
- ThoteAJGuptaRBFormation of nanoparticles of a hydrophilic drug using supercritical carbon dioxide and microencapsulation for sustained releaseNanomedicine20051859017292062
- StephensAPHigh-resolution imaging of the supercritical antisolvent processExp Fluids200538708719
- PatomchaiviwatVPaeratakulOKulvanichPFormation of inhalable rifampicin-poly(L-lactide) microparticles by supercritical anti-solvent processAAPS Pharm Sci Tech2008911191129