Abstract
Captopril (CAP) was the first angiotensin I-converting enzyme (ACE) inhibitor to be developed and is widely used in hypertension treatment. On the other hand, cyclodextrins (CDs) are cyclic oligosaccharides whose cone-shaped cavity allows formation of noncovalent inclusion complexes with appropriately sized guest molecules, thus modifying guest physical, chemical, and biological properties. Herein, the physicochemical characterization and in vivo ACE inhibition evaluation of seven CAP/CD complexes are reported. The inclusion complexes were prepared by spray-drying, freeze-drying, kneading, or lyophilization methods and characterized by nuclear magnetic resonance, Fourier-transformed infrared spectroscopy, X-ray diffraction, differential scanning calorimetry, and scanning electron microscopy techniques. In vivo assays compared CAP and CAP/CD complex administration (0.5 mg kg−1 or 0.09 mg kg−1, n = 4–7) to evaluate the ACE inhibition by continuous infusion of angiotensin I (30 ng 50 μL−1 min−1) in conscious Wistar rats. The physicochemical analysis demonstrated complete amorphization and complexation between CAP and CDs, indicating the substitution of water molecules inside the CD cavity with CAP. During the infusion of angiotensin I, the administration of all CAP/CD complexes induced a reduction in mean arterial pressure similar to that observed upon CAP administration. The nanoparticles obtained by the kneading method (CAP/α-CD:KM) showed a potent and long-lasting inhibitory activity (∼22 hours) on the angiotensin I pressor effect. The results suggest that the inclusion complex of CAP and α-CD can function as a novel antihypertensive formulation that may improve therapeutic use of CAP by reducing its oral dose administration to once per day, thus providing better quality of life for almost 25% of the world’s population who suffer from hypertension.
Introduction
Captopril (CAP) () is an angiotensin I-converting enzyme inhibitorCitation1 that has been widely used for the treatment of hypertension and congestive heart failure. This drug acts orally and the dosage used for the treatment of these heart diseases ranges from 50 mg to 150 mg per day. With a single oral dose its maximum hemodynamic effect is observed after 45–90 minutes.Citation1 The drug is also freely water soluble, has an elimination half-life of 1.7 hours, and is stable at pH 1.2. As the pH increases, CAP becomes unstable and undergoes degradation.Citation2,Citation3 CAP has been a drug of choice in hypertension management; however, its antihypertensive action is effective for 6–8 hours, which is why three to four CAP administrations are required for successful medication. Therefore, development of a controlled delivery system for CAP would bring many advantages for hypertension patients, who compose almost 25% of the world’s population.Citation4,Citation5 Development of oral controlled-release formulations for CAP is very difficult due to both in vivo and in vitro instability. The drug also undergoes dose dumping and burst phenomena (being freely water soluble) when formulated as controlled- or sustained-release formulations.Citation6
Figure 1 Captopril (CAP) ((2S)-1-[(2S)-2-methyl-3-sulfanylpropanoyl]-pyrrolidine-2-carboxylic acid) (left) and α- and β-cyclodextrins (CD) (middle and right) with indication of the captopril and cyclodextrin hydrogens. The CAP and α-CD hydrogens are colored purple, red, or green, due to observed interactions as indicated in nuclear magnetic resonance section.
![Figure 1 Captopril (CAP) ((2S)-1-[(2S)-2-methyl-3-sulfanylpropanoyl]-pyrrolidine-2-carboxylic acid) (left) and α- and β-cyclodextrins (CD) (middle and right) with indication of the captopril and cyclodextrin hydrogens. The CAP and α-CD hydrogens are colored purple, red, or green, due to observed interactions as indicated in nuclear magnetic resonance section.](/cms/asset/8dacb291-9ae5-4426-a7f6-596310c573a3/dijn_a_18999_f0001_c.jpg)
Natural and semisynthetic cyclodextrins (CDs) have been extensively studied as host molecules, as they improve certain properties of drugs, such as solubility, stability, and bioavailability.Citation7 These saccharides are suitable drug delivery systems because of their ability to greatly modify physicochemical properties and/or biological properties of guest molecules through labile interactions in the host/guest inclusion complexes formed. As was recently divulged by some of the authors of the present work, auraptene and 4′-geranylloxyferulic acid in inclusion complexes with β-CD exhibit very effective results in inhibiting colon cancer.Citation8 The inclusion of the active principles in the cage of β-CDCitation9,Citation10 protected drugs from absorption in the stomach and the upper portion of the lower intestine and enabled the degradation of the saccharide portion in the large bowel by intestinal microflora, thereby ensuring specific drug delivery with the maximum drug bioavailability. Although investigation into drug inclusion is one of the most extensively researched fields, and complexation and self-assembly of CDs and lipophilic drugs has been investigated for years,Citation11–Citation13 interactions between CDs and hydrophilic drugs have scarcely been reported.Citation14–Citation16 Such an interaction could result in a retarding effect of the associated hydrophilic drug. Therefore, one of the goals of the present work was to investigate whether a hydrophilic drug such as CAP could form associations or even complexes with CDs so as to obtain a potential antihypertensive formulation that may improve the therapeutic use of CAP.
Ikeda et alCitation17 reported on controlled CAP release by combining hydrophilic and hydrophobic CDs and derivatives in aqueous solutions in self-assembled complexes. Their results suggested that a combination of HP- and TB-β-CD with CAP could control the CAP release by adjusting the molar ratio between the inclusion complex components. In an article published in 2002, Ikeda et alCitation18 also showed inclusion complex formation between α-, β-, and HP-β-CDs as hosts, and CAP in aqueous solutions, analyzed principally by 1H and 13C nuclear magnetic resonance (NMR) spectroscopy.Citation18
Herein, solid inclusion complex formation between CAP and three CDs (α-, β-, and HP-β-CDs) is reported, and to assure that complexation between hydrophilic molecules and CDs is possible, four types of nanoparticles were obtained: kneaded, lyophilized, freeze-dried, and spray-dried. Fifteen inclusion complexes were then analyzed by applying classical methods, such as NMR, Fourier-transformed infrared (FTIR), differential scanning calorimetry (DSC), X-ray diffraction (XRD), and scanning electron microscopy (SEM).
Because a focus of our work was the sustained release of CAP, in vivo tests were executed with seven of the formulations and compared with CAP. The increase of the duration and magnitude of hypotensor CAP effects in the control of blood pressure in spontaneously hypertensive ratsCitation19 was observed. Therefore, nanoparticles of CAP and CD represent possible sustained-release devices that increase the duration and magnitude of CAP antihypertension effects.
Experimental section
Reagents
CAP was purchased from Grupo Castro Marques (União Química Farmacêutica/Biolab Sanus, Lote 0500012197, Sao Paulo, Brazil) and from FURP (Lote RR379435/1, Sao Paulo, Brazil). α-CD and β-CD were purchased from ISP Technologies, Inc (Waterford, MI), and 2-hydroxipropyl-β-CD (Kleptose/HP-β-CD) was purchased from Roquette (Lestrem, France).
Inclusion compound preparation methods
All inclusion compounds were prepared by kneading method (KM), vacuum evaporation (VE), freeze-drying (FD), or spray-drying (SD) using 1:1 molar ratios between CAP and the corresponding CD. Physical mixtures (PM) were prepared by homogeneous blending of weighted CAP and CDs (α-CD, β-CD, and HP-β-CD) in a mortar.
Kneading method (KM)
CAP (217 mg) and α-CD (972 mg), β-CD (1135 mg), or HP-β-CD (1413 mg), in molar ratios of 1:1, were accurately weighed and transferred to a mortar, triturated with a small amount of water, and kneaded thoroughly for approximately 50 minutes. During this process, an appropriate volume of water was added in order to maintain a suitable consistency and to avoid CAP degradation.
Vacuum evaporation (VE)
CAP–ethanol solutions of 500 mg 280 mL−1 were mixed with β-CD aqueous solutions (2599 mg 420 mL−1). The solutions were mixed for 20 minutes by sonication until clear solutions were obtained. Then, the ethanol was evaporated under vacuum for 40 minutes and the products were dried at 37°C for 48 hours. The two other CAP/CD formulations were obtained by the same protocol.
Freeze-drying (FD)
An appropriate amount of CD was dissolved in water. After that, CAP was added to this solution under stirring, with 1:1 stoichiometry. The suspension was stirred for 24–48 hours. The resultant clear solutions were frozen by immersion in an ethanol bath at −50°C (Freezone model 79490; Shell Freezer, Labconco, Kansas City, MO) and then the frozen solutions were lyophilized in a freeze-dryer (ModulyoD-115; Thermo Fisher Scientific, Inc, Waltham, MA) for 72 hours.
Spray-drying (SD)
For this purpose, the hydroalcoholic solutions were prepared and spray-dried. The suspensions of CAP and α-CD (972 mg), β-CD (1135 mg), or HP-β-CD (1413 mg) were prepared in a molar ratio of 1:1 and in ethanol:water (1:3, v/v). These were mixed and stirred for 24–48 hours. The pH values of the solutions were adjusted during this process to avoid possible CAP degradation. Solutions were subsequently spray-dried in a mini Spray Dryer (B-290; Büchi, Flawil, Switzerland) with a two-component nozzle and concurrent flow. The drying conditions were as follows: flow rate, 10 mL s−1; inlet temperature of the drying chamber ∼130°C; outlet temperature, 69°C; and airflow rate, 400 L h−1. The residual water content of each spray-dried product was determined by loss of weight, and each analysis was repeated three times.
Fifteen samples were obtained (each CD with CAP in five different nanoparticle preparations): 1) CAP/β-CD:PM; 2) CAP/β-CD:KM; 3) CAP/β-CD:VE; 4) CAP/β-CD:FD; 5) CAP/β-CD:SD; 6) CAP/α-CD:PM; 7) CAP/α-CD:KM; 8) CAP/α-CD:VE; 9) CAP/α-CD:FD; 10) CAP/α-CD:SD; 11) CAP/HP-β-CD:PM; 12) CAP/HP-β-CD:KM; 13) CAP/HP-β-CD:VE; 14) CAP/HP-β-CD:FD; and 15) CAP/HP-β-CD:SD. Seven of these samples were investigated more thoroughly.
NMR spectroscopy
The CAP/CD nanoparticle samples were prepared in D2O (99.9%) or in DMSO-d6, purchased from Cambridge Isotope Laboratories (Andover, MA), at concentrations of approximately 15 mg mL−1. All experiments were performed at 298 K in an INOVA-500 spectrometer (Varian, Palo Alto, CA). The 1H NMR experiments (D2O samples) were acquired with 32 k data points applying a 90° excitation pulse with duration of 3.15 μs, spectral width of 4.5 kHz, acquisition time of 4 seconds, and relaxation delay of 1 second, using a 5 mm triple resonance probe. The diffusion ordered spectroscopy (DOSY) experiments were carried out through the gradient compensated stimulated echo spin lock with convection compensation (DgcsteSL_cc) high-resolution DOSY sequence. Twenty-five different amplitudes of the gradient pulses ranging from 6.85 × 10⁻⁴ T cm−1 to 4.22 × 10⁻³ T cm−1 were applied, achieving an approximately 90%–95% decrease in the resonance intensity with the highest gradient amplitudes. The baselines of all spectra were corrected and then the DOSY macro program (Varian) was used, involving the determination of the peak heights of all signals above a pre-established threshold. The curves of each peak were fitted with corresponding exponential decay. The DOSY data represent pseudo two-dimensional spectra having 1H-NMR chemical shifts along one axis and the calculated diffusion coefficients (10−10 m2 s−1) along the other. In the rotating-frame Overhauser enhancement spectroscopy (ROESY) experiments, selective (180°) and nonselective (90°) pulses with a mixing time of 400 ms and 300 ms during the spin lock were applied, and the relaxation delay was 1.5 seconds. A modulator generated the selective pulses and automatically attenuated the power and duration of the pulse. 13C NMR and heteronuclear single-quantum correlation (HSQC) (DMSO-d6 samples) were carried in 5 mm broadband or triple resonance probes, respectively. 13C NMR experiments were acquired with 32 k data points, spectral width of 3.0 kHz, and relaxation delays of 1.5 seconds at 125.709 MHz. The {13C-1H} HSQC spectra were obtained with data size and spectral widths of 128 (t1) × 1024 (t2) and 22800 Hz (ω1, 13C) × 4000 Hz (ω2, 1H), respectively, and relaxation delays of 1.5 seconds.
FTIR spectroscopy
Samples of the solid dispersions and physical mixtures of CAP and α-, β-, and HP-β-CD in molar ratios of 1:1 were mixed with KBr and pressed to small tablets mounted in the infrared beam (MB 100 FTIR spectrometer; ABB Bomem, Inc, Zurich, Switzerland).
DSC
Measurements of the pure materials (CAP and CD) and the binary systems were carried out using a DSC-STAR system (Mettler Toledo Inc, Columbus, OH). The thermal behavior was studied by heating the samples in a sealed aluminum pan from 25°C to 600°C at a rate of 10°C min−1 under a nitrogen flow of 40–50 mL min−1.
XRD studies
The powder XRD patterns of the samples were recorded using a Siemens D 5000-XRD (Siemens Electronical Equipment, Toronto, ON) under the following conditions: target, Cu; filter, Ni; voltage, 40 kV; current, 30 mA; scanning speed 2°C min−1; chart speed, 40 mm min−1; and count range, 1000 counts s−1. The detector was a proportional counter with 1.7 kV detector.
SEM studies
The morphological features of CAP, α- and β-CDs, and the CAP/CD systems (physical mixture, kneaded, vacuum-evaporated, freeze-dried, and spray-dried) were studied by SEM using JSM-5400 equipment, employing 20 kV of tension after sputtering the samples with a thin layer of gold to make the surfaces conductive.
In vivo assays
Animals
Experiments were carried out in male Wistar rats (280–320 g) bred at the animal facility of the Biological Science Institute (CEBIO, Federal University of Minas Gerais, Belo Horizonte, Brazil). The animals had free access to food and water and were submitted to a light–dark cycle (12 hours each) before experiments. The experimental protocol was performed in accordance with the guidelines for the human use of laboratory animals of the cited institute and approved by local authorities.
Blood pressure recording in rats
Arterial pressure measurements
The cardiovascular parameters pulse arterial pressure (PAP), mean arterial pressure (MAP), and heart rate (HR) were monitored by a solid-state strain gauge transducer connected to a computer through a data acquisition system (MP 100; BIOPAC Systems, Inc, Goleta, CA). The PAP, MAP, and HR were monitored jointly during experiments in different monitor channels and recorded in the computer hard disk for posterior analysis.
Inhibition of the pressor effect of angiotensin I on BP in conscious Wistar rats
Twenty hours before the experiment, under tribromoethanol anesthesia (2.5% 1.0 mL 100 g−1 of body weight), polyethylene catheters (PE-10 connected to PE-50) were introduced into abdominal aorta through the femoral artery and vein for recording cardiovascular parameters and intravenous injections, respectively. After recovery from anesthesia, the rats were kept in individual cages with free access to water and food until the end of the experiments. Before drug administration, the cardiovascular parameters were monitored for 10–15 minutes. Next, a continuous intravenous infusion of angiotensin I (30 ng 50 μL−1 min−1) was performed using an infusion pump (Pump 11; Harvard Apparatus, Holliston, MA). After stabilization of cardiovascular parameters during angiotensin I infusion, CAP, CAP/CD complexes, or vehicle (water) were given by gavage (0.09 mg kg−1 and 0.5 mg kg−1 of CAP in each formulation) in a total volume of 0.3 mL. Uncomplexed CAP was used as positive control. The cardiovascular parameters were monitored continuously over 2 hours after drug administration. MAP and HR values were computed at regular intervals (3 minutes, 15 minutes, 30 minutes, 45 minutes, 60 minutes, 75 minutes, 90 minutes, 105 minutes, and 120 minutes) (n = 4–7). Also, PAP, MAP, and HR parameters were monitored after 20–24 hours of administration.
Statistical analysis
Comparisons were made by Student’s unpaired t-test or two-way analysis of variance with Bonferroni post hoc test when appropriate. GraphPad Prism 5.0 software (GraphPad Software, Inc, La Jolla, CA) was used in all statistical analysis. The criterion for statistical significance was set at P < 0.05.
Results and discussion
NMR
We initiated our investigation by analyzing the complexation-induced chemical shifts (CICSs)Citation20 in the complexes. The hydrogen atoms of guest molecules included in the CD nanocavities, as well as CD hydrogens, can undergo changes in chemical shifts due to the changes in their local environment. As has been frequently observed,Citation21,Citation22 the signals of H3’ and H5’ hydrogens on the inner surface of the CD () are shifted significantly upfield, whereas H1’, H2’, and H4’ hydrogens on the outer surface experience minimal changes. Thus, the chemical displacement of the CDs induced by the presence of the guest and the CICSs of CAP are the first evidence of CAP inclusion in CDs ().
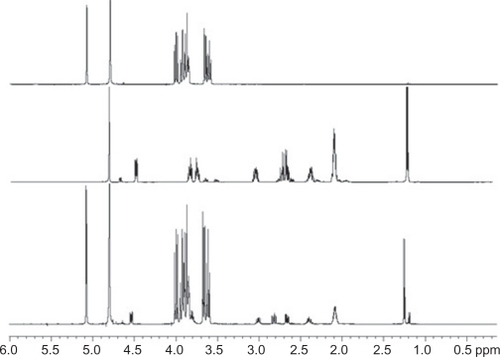
Figure 2 1H nuclear magnetic resonance spectra showing α-cyclodextrin (α-CD, upper panel), captopril (CAP) (in the middle), and CAP/α-CD:kneading method (lower panel) in the 0.1–6.0 ppm range. A residual water signal is present at 4.8 ppm and evident in all samples.
The hydrogen atoms of CAP and the CDs were denominated in accordance with , and the best results for formulations are summarized in and .
Table 1 1H NMR chemical shifts of cyclodextrin (CD) hydrogens in D2O and their CICS in the respective complexes, for α-CD (α-cyclodextrin) and its formulation with Captopril (CAP/α-CD:KM); β-CD (β-cyclodextrin) and its formulation (CAP/β-CD:SD); HP-β-CD (hydroxypropyl-β-cyclodextrin) and its formulation (CAP/HP-β-CD:SD)
Table 2 1H NMR chemical shifts of Captopril hydrogens in D2O and their CICS in the complexes with α, β and HP cyclodextrins respectively, where Δδ = δcomplexed − δfree
The chemical shifts of H6’ hydrogens (CDs) are not shown in because of the overlap with the signals corresponding to H5’, which are also not shown. As is already described in the literature,Citation23 when |Δδ H3′|>|Δδ H5′|, the guest inclusion inside the CD cavity is partial, and when |Δδ H3′|≤|Δδ H5′|, the guest is included more deeply into the cavity. The results () showed partial inclusion of CAP in β-CD nanoparticles and total inclusion of CAP in α-CD and HP-β-CD.
Unfortunately, the H5 CAP hydrogens (proline ring) of CAP could not be quantitatively analyzed due to overlapping with the NMR signals from the CD.
shows the chemical shifts of the CAP hydrogens and their CICSs due to complexation with CDs. The CICS of CAP complexed with α-CD are higher than those measured in β-CD and HP-β-CD complexes, maybe because of stronger guest interactions with the α-CD cavity. In the case of the α-CD complexes, higher CICSs were observed for the propyl thioalcohol hydrogen (H9a) when compared with the proline hydrogens (H2 and H3). The CICSs of the β-CD and β-HP-CD follow a slightly different tendency. The larger ones were observed for hydrogens in the center of the CAP molecule (H7 and H8), whereas the changes in CICSs of the terminal hydrogens (H9) were small. These results suggest that the terminal alkyl unit (thiol moiety) of the CAP is included in the CD cavity. The CICS data confirmed our expectations that CAP in an inclusion complex with α-CD in the formulation denominated CAP/α-CD:KM presents higher values, due to having stronger intramolecular interactions with the host molecule, as well as CAP insertion with the thiol moiety in the α-CD cavity, which is also observed in FTIR analysis. Other CAP inclusion complexes with β-CD and HP-β-CD collaborated with FTIR data and indicated more probable guest molecule inclusion by the proline moiety in the corresponding CD cavities.
ROESY NMR
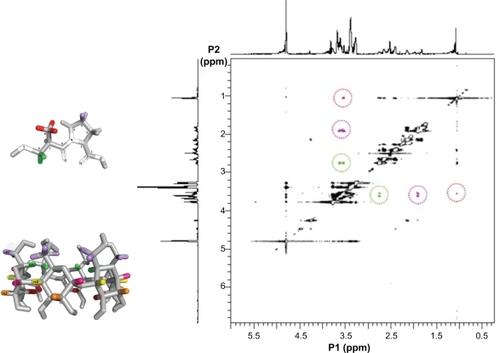
The ROESY experiments were carried out in order to gain insights into the inclusion mode of the complexes in aqueous solution. The ROESY spectrum, shown in , provided information about which α-CD hydrogen has an intermolecular correlation with the CAP hydrogens. There are ROE crosspeaks between the H-4 and the α-CD H-6′ hydrogen resonances (in purple in ), as well as H-8 and H-3′ (in red in ). Additionally, we can find another ROE crosspeak between the H-9 and H-5′ hydrogen resonances (circled in green in ) that confirms the inclusion mode for the complex CAP/α-CD:KM in aqueous solution obtained by CICS analysis.
Figure 3 Rotating-frame Overhauser enhancement spectroscopy nuclear magnetic resonance map (0.3–6.0 ppm range) with interactions between hydrogen atoms in the formulation captopril (CAP)/α-cyclodextrin (CD):kneading method. CAP H-9 and α-CD H-5′ (in green), H-4 and H-6′ (in purple), and H-8 and H-3′ (in red). Residual water signal is present at 4.8 ppm. The α-CD (lower panel) and CAP (upper panel) are shown on the left side.
DOSY NMR
The DOSY NMR experiments were important to confirm the complexation of CAP with CD, and the diffusion coefficients also provided valuable information on molecular organization and phase structures. These experiments allowed distinguishing complexes by observed differences in diffusion coefficients. Furthermore, we have investigated the self-assemblies between host and guest molecules by mixing solutions of CAP and the respective CD (D2O) in the same proportion as used in the preparation of nanoparticles (1:1 molar ratios). As explained in the experimental section, after properly preprocessing data, the diffusion coefficients were obtained automatically and the diffusion coefficient values were calculated as the averages of all the listed coefficients. The results for the best IC are shown in .
Table 3 Diffusion coefficients (D) obtained in DOSY-NMR experiments for Captopril (free and bonded) and cyclodextrins (α, β and HP-β-CD) with corresponding percent of captopril complexed population (pcomplexed in %)
The guest population involved in the complexation was calculated from the observed diffusion coefficient of each component in the complexed and free forms, applying a well-established methodology.Citation24,Citation25 The degree of complexation between CAP and α-CD is evidently higher compared with other samples and occurred even in the self-assembled sample (, mixture of α-CD + CAP, 23.6%); therefore, it was proven that CAP is completely included in the α-CD cavity, as already seen in the 1H NMR data. A somewhat higher degree of complexation was measured for CAP/α-CD:KM formulation (34.2%), as well as for CAP/β-CD:SD (31.3%).
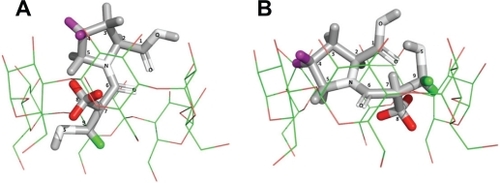
NMR data enabled the pattern for supramolecular interactions to be established and to propose the model for a host-guest complex named CAP/α-CD:KM, as illustrated in .
Figure 4 Proposed structure for captopril and α-cyclodextrin (CD) in the captopril (CAP)/α-CD:kneading method inclusion complex. The CAP is completely included in the α-CD cavity; α-CD upper and broader cone side accommodates CAP whose thiol moiety is completely introduced into the cavity and is illustrated in two different perspectives (A) and (B). The hydrogen atoms in green (H-9), purple (H-4), and red (H-8) on the CAP molecule are the most altered by complexation, as measured in rotating-frame Overhauser enhancement spectroscopy nuclear magnetic resonance and seen by complexation-induced chemical shifts.
13C-NMR and 2D NMR
13C-NMR and HSQC experiments were executed to confirm the results obtained by the 1H-NMR and ROESY experiments and helped to better understand the supramolecular interactions between CAP and the CD. The 13C chemical shift displacements of α-CD and CAP in the formulations follow the same tendency observed in the 1H CICS, with greater displacements in C7, C8, and C9 of CAP. Furthermore, the {13C-1H} HSQC experiment helped us to clear up doubts in guest-host interactions that showed that proline moiety is the most altered in complex with α-CD, and the C7-H7, C8-H8, and C9-H9 correlation signals suffered significant shifts in comparison with the HSQC map of CAP.
FTIR spectroscopy
All solids were analyzed by FTIR, but this technique was only effective in analyzing the binary systems obtained by spray-drying in the case of β-CD inclusion complexes, and by the kneading method in the case of α-CD inclusion complexes. The general trend of spectra showed that CAP IR bands are masked by CD IR bands (data not shown). When analyzing the IR spectra of CAP/β-CD:SD and CAP/α-CD:KM, it appeared that the CAP IR band attributed to axial strain S-H (2565 cm−1) disappeared when compared with the IR spectra of compounds obtained by other methods. Also, aliphatic C-H stretching and C-N IR bands in the 2800–3000 cm−1 region were missing. Therefore, the β- and α-CD probably interacted with CAP thiol and proline moieties by completely accommodating the guest within the corresponding nanocavity. These inclusion complexes in both control and preclinical tests were the ones with the best performance in maintaining stable blood pressure upon angiotensin I infusion.
DSC
Data indicated that CAP has a thermal curve typical for a crystalline anhydrous substance with a sharp fusion endotherm at 103–108°C, corresponding to the melting point of the drug. The DSC curve obtained for β-CD had a broad endothermic effect around 85–90°C, associated to crystal water losses from CD.Citation26 When physical mixtures were analyzed by DSC (), the CAP endothermic peak around 103–108°C was clearly distinguishable from additional peaks, due to the β-CD dehydration effect. These curves are, in fact, the superposition of the individual DSC components curves,Citation27 showing the absence of interaction between the drug and CD in such systems.
Figure 5 Differential scanning calorimetry thermograms of A) captopril (CAP), B) β-cyclodextrin (CD), C) CAP/β-CD:physical mixture, and D) CAP/β-CD:spray-dried.
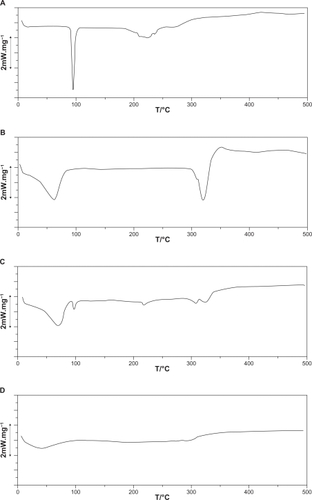
It is known that when guest molecules are embedded in CD cavities or in the crystal lattice, their melting, boiling, or sublimation points generally shift to a different temperature or disappear within the temperature range where CD is decomposed.Citation28 Therefore, the disappearance of the CAP melting point in the CAP/α-CD:SD, CAP/α-CD:KM, and CAP/HP-β-CD:SD inclusion complexes suggests the formation of amorphous solid dispersion and/or inclusion complexes.Citation29 These results provide strong evidence that only four nanoparticles, CAP/α-CD:SD, CAP/α-CD:KM, CAP/HP-β-CD:SD, and CAP/β-CD:VE, can be considered true inclusion complexes.Citation30
XRD studies
The XRD patterns of CAP/β-CD, CAP/α-CD, and CAP/HP-β-CD systems are presented in . CAP, α-CD, and β-CD exhibited intense peaks and crystalline structure (). The XRD pattern of CAP/β-CD:PM () is practically constituted from the superposition of the spectra corresponding to the individual components, providing evidence that an inclusion complex was not formed. The reduction in crystallinity was complete in the spray-dried powder (CAP/β-CD:SD, ), showing a completely diffuse diffraction pattern, which revealed its amorphousness.
Figure 6 X-ray powder diffraction of A) captopril (CAP), B) α-cyclodextrin (CD), C) β-CD, D) CAP/α-CD:physical mixture, E) CAP/β-CD:PM, F) CAP/α-CD:kneading method, and G) CAP/β-CD:spray-dried.
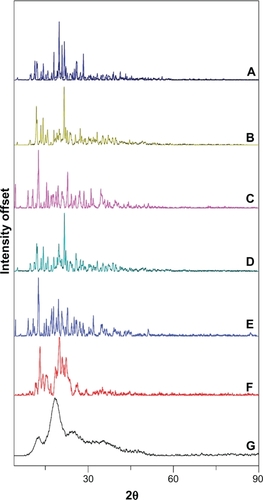
The absence of any peak in the HP-β-CD diffractograms revealed the amorphous nature of this compound (data not shown). The other HP-β-CD systems displayed diffuse diffraction patterns (identical to those of HP-β-CD without drug peaks), indicating the entirely amorphous nature of CAP in these products. As for α-CD, the diffraction profile of the CAP/α-CD:PM sample was found to be the simple superposition of XRD of each component (). The reduction in crystallinity was evident in the kneaded powder (CAP/α-CD:KM, ), with the crystalline peaks of CAP emerging in the diffuse background. These results may be attributed to an interaction between CAP and α-CD and β-CD, in the kneaded and spray-dried products, suggesting the presence of a new solid phase with lower crystallinity than the drug, where a possible complexation of CAP inside the CD cavity was contemplated, corroborating the DSC observations.
SEM studies
Although the SEM technique is not suitable to prove the formation of an inclusion complex, it can confirm the existence of one or several components and supply information about particle size and shape. SEM studies revealed that CD crystallizes in polyhedral form. Pure CAP examined by SEM appeared as crystal particles with large dimensions, and its physical mixtures with α- and β-CD showed both crystalline components ().
Figure 7 Scanning electron microscopy images of A) captopril (CAP)/α-cyclodextrin (CD):physical mixture, B) CAP/β-CD:physical mixture, C) CAP/α-CD:kneading method, and (D) CAP/β-CD:spray-dried.
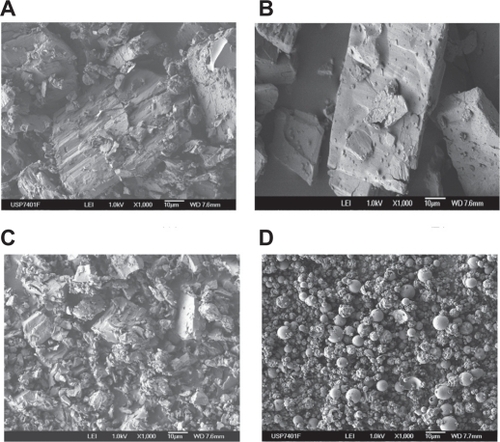
Microphotographs of the samples prepared by kneading and spray-drying for α- and β-CD showed a strong reduction in the particle size () due to the processing methods employed, which provoked a high degree of particle agglomeration, although the wetability of CAP increased. The vacuum-evaporated samples show clear differences in crystallization, with new crystalline products in CAP inclusion complexes with both CDs (data not shown).
In vivo evaluation
Blood pressure recording in rats
The results showed that all investigated inclusion complexes as well as CAP reduced the pressor response evoked by angiotensin I. shows the inhibitory effects of two CAP/CD complexes (0.5 mg kg−1 CAP in each inclusion complex, or 0.09 mg kg−1 CAP) on the pressor response caused by the infusion of angiotensin I on the MAP of conscious rats in comparison with CAP-free infusions.
Figure 8 Reduction of the angiotensin I pressor response in conscious rats provoked with administration of two captopril (CAP) inclusion complexes at a dose of A) 0.5 mg kg−1 (CAP concentration in each inclusion complex) and B) 0.09 mg kg−1. Both graphics show CAP-free effects. Complexes of α- and β-cyclodextrin showed long-lasting inhibitory effects when compared with CAP (P < 0.05).
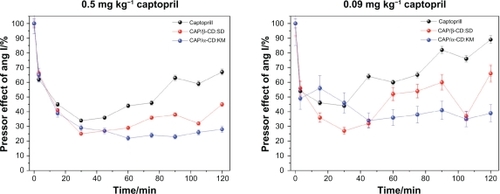
Complexes of CAP with α- and β-CD showed a long-lasting inhibitory effect when compared with CAP (P < 0.05). The inclusion complex CAP/β-CD:SD (illustrated in red) presented a similar time course to that of CAP, evoking a maximum inhibitory effect at 30 minutes. This inhibitory effect was still evident until the end of the experimental period (120 minutes showed).
shows the maximum percent changes of the angiotensin I pressor effect for the various investigated CAP formulations. These values were collected at the time when maximum reductions in MAP were observed after inclusion complex or CAP administration (0.09 and 0.5 mg kg−1 of CAP in each case). At both doses, CAP/α-CD:KM was the most potent inhibitor of the pressor effect of angiotensin I. Also, the inhibitory effect of CAP/α-CD:KM was significantly different from that of CAP (P < 0.05).
Table 4 Maximum percent changes in MAP following captopril and captopril/cyclodextrin complexes (0.09 and 0.5 mg kg−1 of captopril in each complex) administration
Three complexes, CAP/β-CD:SD, CAP/β-CD:VE, and CAP/α-CD:KM, evoked a maximum response at 15 minutes, 45 minutes, and 60 minutes, respectively. A reduction of this effect was observed at 90 minutes, 75 minutes, and 105 minutes, respectively (data not shown). CAP caused maximum inhibitory response at 30 minutes after injection, showing a reduction of its inhibitory effect 75 minutes after administration. Although all investigated complexes showed longer-lasting inhibitory effects when compared with CAP (P < 0.05), two formulations, CAP/α-CD:KM and CAP/β-CD:SD, exhibited the best results. The CAP/β-CD:SD (red, ) and CAP/α-CD:KM (blue, ) complexes evoked a maximum inhibitory effect on the pressor response evoked by angiotensin I at 30 minutes. However, a decay of this effect was observed from 60 minutes to 90 minutes for CAP/β-CD:SD (red, ). The maximum response of the complex CAP/α-CD:KM started at 30 minutes following its administration, showing a stable inhibitory effect up to the end of the observation period (blue, ). Moreover, this effect was detected even 22 hours after CAP/α-CD:KM administration, indicating a very long-lasting pressor effect on angiotensin I, as if CAP in this formulation was protected from degradation and liberated in portions during MAP monitoring. In all experiments, free CAP showed a maximum inhibitory response at 30 minutes after injection. A gradual reduction of its inhibitory effect was observed 45 minutes after administration ().
Therefore, the in vivo results showed relevant information about the activity of CAP and the CD inclusion complexes. Moreover, the methodology used in our study allowed the evaluation of the effectiveness of different inclusion complexes. Two of them, CAP/α-CD:KM and CAP/β-CD:SD, showed potent and long-lasting inhibitory activity over the pressor response of angiotensin I. These two compounds should be further evaluated in chronic studies aimed at clinical applications.
Final remarks
In this report, we have provided detailed physicochemical characterization of inclusion compounds formed through different procedures between CAP and three different CDs, and showed that the kneading method resulted in the best inclusion organization for the CAP/α-CD:KM nanoparticles. This formulation showed the highest degree of complexation (superior to 34%), and then data collected enabled us to propose a solid model for the inclusion complexes that describes all supramolecular interactions acting between CAP and α-CD. NMR data, such as ROESY and DOSY, were very informative and indicated that even hydrophilic species such as CAP are involved in CD cavities in water solution, including self-assembly. Although self-assemblies between CD and CAP gave good complexation results, two inclusion complex formulations seem to additionally complex CAP and explain in vivo bioactivity data. Two formulations exhibited long-lasting effects in controlling angiotensin I pressor effect, especially the inclusion complexes CAP/α-CD:KM formulation. Therefore, this could be a new way for CAP administration that may provide better quality of life for people suffering from high blood pressure, who compose around 25% of the world’s population.
Acknowledgements
There was financial support from Fundação de Amparo à Pesquisa do Estado de São Paulo, Conselho Nacional de Desenvolvimento Científico e Tecnológico, and Coordenação de Aperfeiçoamento de Pessoal de Nível Superior. Professor Carol H Collins (Instituto de Química (UNICAMP)) is gratefully acknowledged for helpful suggestions on English grammar and style.
Disclosure
No conflicts of interest were declared in relation to this paper.
References
- LiebauGCaptopril in congestive heart failureKlinische Wochenschrift1982601071136210798
- ChengWTWangSLLinSYSolid-state interaction study on the captopril/lubricants systems accelerated by grinding processJ Phys Chem Sol20086910071016
- NurAOZhangJSCaptopril floating and/or bioadhesive tablets: design and release kineticsDrug Dev Ind Pharm20002696596910914320
- KhanMASastrySVVaithiyalingamSRCaptopril gastrointestinal therapeutic system coated with cellulose acetate pseudolatex: evaluation of main effects of several formulations variablesInt J Pharm200019314715610606777
- Jiménez-MartínezbIQuirino-BarredaTVillafuerte-RoblesLSustained delivery of captopril from floating matrix tabletsInt J Pharm2008362374318588962
- NurAOZhangJSRecent progress in sustained/controlled oral delivery of captopril: an overviewInt J Pharm2000b19413914610692638
- LoftssonTDuchêneDCyclodextrins and their pharmaceutical applicationsInt J Pharm200732911117137734
- TanakaTAzevedoMBMDuranNColorectal cancer chemo-prevention by 2 β-cyclodextrin inclusion compounds of auraptene and 4′-geranyloxyferulic acidInter J Cancer2010126830840
- MeissnerYLamprechtAAlternative drug delivery approaches for the therapy of inflammatory bowel diseaseJ Pharm Sci2008972878289117948914
- DavisMEBrewsterMECyclodextrin-based pharmaceutics: past, present and futureNat Rev Drug Discovery2004310231035
- De AzevedoMBMAldereteJBLinoACSBiological activities of violacein, a new antitumoral indol derivative, in an inclusion complex with β-cyclodextrinJ Inclusion Phenom Macrocyclic Chem20003793101
- CorrêaDHMeloPSde CarvalhoCADehydrocrotonin and its beta-cyclodextrin complex: cytotoxicity in V79 fibroblasts and rat cultured hepatocytesEur J Pharmacol2005510172415740720
- MeloPSJustoGZde AzevedoMBMViolacein and its β-cyclodextrin complexes induce apoptosis and differentiation in HL60 cellsToxicology200318621722512628314
- HirayamaFUekamaKCyclodextrin-based controlled drug release systemAdv Drug Deliv Rev19993612514110837712
- KeipertSFedderJBöhmAHankeBInteractions between cyclodextrins and pilocarpine: as an example of hydrophilic drugInt J Pharm1996142153162
- VyasASarafSSarafSCyclodextrin based novel drug delivery systemsJ Inclusion Phenom Macrocyclic Chem2008622342
- IkedaYKimuraKHirayamaFControlled release of a water-soluble drug, captopril, by a combination of hydrophilic and hydrophobic derivativesJ Control Release20006627128010742586
- IkedaYMotouneSMatsuokaTInclusion complex formation of captopril with α- and β-cyclodextrins in aqueous solution: NMR spectroscopic and molecular dynamic studiesJ Pharm Sci2002912390239812379924
- SantosRASCampagnole-SantosMJPinheiroSVBFerreiraAJThe renin-angiotensin system: emerging conceptsCurr Hypertens Rev20062219226
- CruzJRBeckerBAMorrisKFLariveCKNMR characterization of the host-guest inclusion complex between beta-cyclodextrin and doxepinMagn Reson Chem20084683884518615634
- MeierMMLuizMTBFarmerPJSzpoganiczBThe influence of β- and γ-cyclodextrin cavity size on the association constant with decanoate and octanoate anionsJ Inclusion Phenom Macrocyclic Chem200140291295
- SchneiderH-JHacketFRüdigerVIkedaHNMR studies of cyclodextrins and cyclodextrin complexesChem Rev1998981755178611848948
- CalderiniAPessineFBTSynthesis and characterization of inclusion complex of the vasodilatador drug minoxidil with β-cyclodextrinJ Incusion Phenom Macrocyclic Chem200860369377
- RymdémRCarlforsJStilbsPSubstrate binding to cyclodextrins in aqueous solution: a multicomponent self diffusion studyJ Inclusion Phenom Macrocyclic Chem19831159168
- LinMJayawickramaDARoseRANuclear magnetic resonance spectroscopic analysis of the selective complexation of the cis and trans isomers of phenylalanylproline by β-cyclodextrinAnal Chim Acta1995307449457
- HassanMSuleimanMNajibNImprovement of the in vitro dissolution characteristics of famotidine by inclusion in β-cyclodextrinInt J Pharm1990581924
- Perdomo-LópezIRodríguez-PérezAIYzquierdo-PeiroJMEffect of cyclodextrins on the solubility and antimycotic activity of sertaconazole: experimental and computacional studiesJ Pharm Sci2002912408241512379926
- Cabral MarquesHHadgraftJKllawayIStudies of cyclodextrin inclusion complexes I The salbutamol-cyclodextrin complex as studied by phase solubility and DSCInt J Pharm199063259266
- Esclusa-DiazMTorres-LabandeiraJKataMVila-JatoJInclusion complexation of glibenclamide with 2-hydroxypropyl-b-cyclodextrin in solution and in solid stateEur J Pharm Sci19941291296
- FigueirasARibeiroLTorres-LabandeiraJVeigaFJBEvaluation of host-guest complex formation between a benzimidazolic derivative and cyclodextrins by UV-VIS spectrophotometry and differential scaning calorimetryJ Inclusion Phenom Macrocyclic Chem200757531535