
 ?Mathematical formulae have been encoded as MathML and are displayed in this HTML version using MathJax in order to improve their display. Uncheck the box to turn MathJax off. This feature requires Javascript. Click on a formula to zoom.
Abstract
Background
8-methoxypsoralen (8-MOP) is one of the most commonly utilized drugs in psoralen-ultraviolet A therapy for treatment of vitiligo. However, poor skin retention and systemic side effects limit the clinical application of 8-MOP.
Methods
Microemulsions (MEs) and chitosan derivative-coated 8-MOP MEs were developed and compared for dermal delivery of 8-MOP. Ex vivo skin retention/permeation study was performed to select the ME formulation with the highest retention:permeation ratio. Four different chitosan-coated MEs were prepared and compared with the ME formulation for their ability to distribute 8-MOP in the skin.
Results
Among various ME formulations developed, a formulation containing 2.9% ethyl oleate, 17.2% Cromophor EL35, 8.6% ethanol and 71.3% water showed the highest ex vivo skin retention:permeation ratio (1.98). Of four chitosan-coated MEs prepared, carboxymethyl chitosan-coated MEs (CC-MEs) and hydroxypropyl chitosan-coated MEs (HC-MEs) showed higher ex vivo skin retention:permeation ratio (1.46 and 1.84). and were selected for in vivo pharmacokinetic study. AUCskin (0–12 h) for 8-MOP MEs (4578.56 h·ng·mL−1) was higher than HC-MEs (3422.47 h·ng·mL−1), CC-MEs (2808.51 h·ng·mL−1) and tincture (1500.16 h·ng·mL−1). Also, AUCplasma (0–12 h) for MEs (39.35±13.90 h·ng·mL−1) was significantly lower than HC-MEs (66.32 h·ng·mL−1), CC-MEs (59.70 h·ng·mL−1) and tincture (73.02 h·ng·mL−1).
Conclusion
These combined results suggested that the MEs developed could be a promising and safe alternative for targeted skin delivery of 8-MOP.
Background
Vitiligo is a skin disease of spontaneous hypopigmentation characterized by white patches on different areas of the body.Citation1,Citation2 Vitiligo is caused by skin- and hair-follicle melanin depigmentation, but the pathogenesis remains unclear.Citation3 About 1%–2% of people are affected by vitiligo globally, with no predilection for age, sex, or race.Citation4 This disease is easy to diagnose, but few treatments are available, and patient quality of life is often been negatively affected.Citation5
Photochemotherapy using psoralen or its derivatives plus ultraviolet A is an effective treatment for vitiligo, and has been approved by the US Food and Drug Administration and regulatory agencies in European countries.Citation6 8-Methoxypsoralen (8-MOP) is one of the most commonly utilized drugs in psoralen–ultraviolet A therapy.Citation7,Citation8 8-MOP may activate tyrosinase in the horny layer of the skin, promoting melanin synthesis and facilitating the proliferation and migration of melanocytes.Citation9 8-MOP may also stimulate keratinocytes to release inflammatory mediators that could enhance melanocyte function and serve as melanocyte growth–stimulating factors.Citation10
Traditional topical 8-MOP formulations, such as solutions,Citation11 creams,Citation12 and tinctures,Citation13 are efficacious; however, significant systemic side effects, including pain, pruritus, vesicular erythema, severe phototoxic erythema, hepatic toxicity, and renal toxicity, limit its usage.Citation14 Studies have shown that the target of 8-MOP therapeutic treatment of vitiligo is the epidermis.Citation15,Citation16 Therefore, enhanced skin targeting and reduced skin permeation of 8-MOP are warranted for improving therapeutic efficacy and avoiding its potential side effects. Also, high concentration of 8-MOP in the skin helps to reduce the dose of ultraviolet A radiation exposure and associated side effects.Citation17
Microemulsions (MEs) are thermodynamically stable isotropic systems with small particles (<100 nm).Citation18 MEs can regulate the distribution of skin retention and transder-mal absorption of encapsulated drug. Reports indicate that MEs can improve drug absorption in the skin, and they have been suggested as promising candidates for transdermal delivery.Citation19–Citation21 Chitosan-coated MEs, which have emerged as a novel carrier for transdermal delivery of chitosan and its derivatives, with high biocompatibility and low toxicity, may help to permeate the stratum corneum and open tight junctions in skin.Citation22 The aim of this study was to enhance the retention of 8-MOP in the skin and reduce its entry to the bloodstream (skin permeation) using MEs and chitosan derivative-coated MEs as delivery vehicles.
Methods
Materials
8-MOP were purchased from Japharm (Nanjing, China). 8-MOP tincture (1 mg mL−1 8-MOP in ethanol–water) was purchased from Huapont Pharm (Chongqing, China). Isopropyl myristate, Cremophor EL35, and Cremophor RH40 were purchased from BASF (Ludwigshafen, Germany). Ethyl oleate, oleic acid, oleoyl macrogolglycerides (Labrafil M 1944 CS), and medium-chain triglycerides were obtained from Gattefossé (France). Polyoxyethylene stearate (Solutol) and polyethylene glycol 400 (PEG400) were purchased from Sinopharm Chemical Reagent (Shanghai, China). Cabomer-940 was purchased from Shin-Etsu Chemical Japan. Lactate chitosan (LC), carboxymethyl chitosan (CC), acetic chitosan (AC), and hydroxypropyl chitosan (HC) were purchased from Sinopharm Chemical Reagent (Shanghai, China). 4,8,5′-Trimethylpsoralen (TMP) was purchased from Tauto Biotech (Shanghai, China). High-performance liquid chromatography (HPLC)-grade methanol and acetonitrile were obtained from Tedia (Fairfield, OH, USA). Double-distilled water was used throughout the study. All other chemical reagents and solvents were of analytical grade.
Preparation of 8-MOP MEs
Ethanol and propylene glycol were chosen as cosurfac-tants for their good solubility of 8-MOP and mixed with Cremophor EL35, RH40, or Solutol at a weight ratio of 1:2 (KM 2:1) to form mixtures (Smix). Then, Smix was added to ethyl oleate, oleic acid, Labrafil M 1944 CS, medium-chain triglycerides, or isopropyl myristate at weight ratios of 9:1, 8:2, 7:3, and 6:4, respectively. Double-distilled water was added dropwise to the oil and Smix with magnetic stirring at ambient temperature. Therefore, a total of 120 different preparations were prepared and tested. After 2 weeks of storage at ambient temperature, ten drug-free preparations that successfully formulated MEs were included for drug loading. Then, the KM values of the included MEs with good stability were changed to 3, 1.5, and 1. After 1 month of storage at ambient temperature, homogeneous, clear, and transparent formulations were chosen for preparation of MEs for loading 8-MOP. Drug-loaded MEs were prepared by adding 20 mg 8-MOP into 20 mL MEs with stirring at 25°C for 2 hours, followed by centrifugation at 13,000 rpm for 10 minutes. Supernatants were purified 8-MOP-loaded MEs and were stored in vials for 1 week at ambient temperature. Three formulations, which were homogeneous, clear, and transparent, were selected for further experiments.
Ex vivo skin retention/permeation study of 8-MOP MEs
The ex vivo skin-permeation study was carried out in accordance with the recommendations in the Guide for the Care and Use of Laboratory Animals and approved by the Animal Ethical Committee of the Second Xiangya Hospital of Central South University. The permeability of three drug-loaded MEs was determined using a modified Franz-type diffusion cell (Pharmacopoeia Standard Instrument, Tianjin, China) fitted with excised porcine skin obtained from the abdomen of a healthy pig (10 kg).
The skin was mounted on the receptor compartment with the stratum corneum facing up into the donor compartment and the dermal side facing down into the receptor compartment. The donor cell was filled with 1 mL drug-loaded ME or 8-MOP tincture. The receptor compartment was filled with 17 mL physiological saline containing 30% PEG400 v:v as the receptor phase and maintained at 37°C±1°C, with constant stirring at 200 rpm. The effective diffusion area was 1.77 cm2. At predesignated time points (1, 2, 4, 6, 8, 12, and 24 hours), 400 µL receptor phase was removed and replaced with 400 µL fresh phase. Permeation was calculated:
Following the ex vivo skin-permeation experiments, the amount of 8-MOP retained in the skin was determined by homogenization. After being washed three times with triple-distilled water, the skin was cut into small pieces and placed into a 5 mL volumetric flask containing 3 mL methanol. Sample extraction was performed by sonication for 30 minutes and diluting with methanol to an appropriate volume. The resulting solution was centrifuged at 13,000 rpm for 10 minutes. The supernatant was analyzed by HPLC, and 8-MOP retained in the skin calculated:
The ME formulation with the highest retention:permeation ratio was selected for chitosan coating and in vivo evaluations.
Characterization of selected 8-MOP MEs
The ME formulation with the appropriate drug-loading capacity and highest drug retention:permeation ratio in ex vivo skin was subjected to physicochemical characterization.
Appearance and micromorphology of selected 8-MOP MEs
Visual inspection of 8-MOP ME appearance by transmission electron microscopy (TEM; JEM-1200EX; Jeol, Tokyo, Japan) was employed to visualize 8-MOP ME microstructure. 8-MOP MEs were placed in 4 mL Eppendorf tubes and diluted 20-fold. The diluent was dropped on a copper mesh covered with carbon film, and filter paper was used to absorb the excess liquid. After the diluent had been dried in air, the carbon film was placed under TEM to observe 8-MOP ME morphology.
Determination of physiochemical characterization of selected 8-MOP MEs
Mean droplet size, polydispersity index (PDI), and ς-potential of the MEs were characterized using a laser particle-size analyzer (Nano ZS90; Malvern). An appropriate 8-MOP ME volume was transferred into a 10 mL Eppendorf tube and diluted 50 times for detection at 25°C. pH values and electronic conductivity were evaluated with a DDS-11A digital conductivity meter (Leida, Shanghai, China).
Preliminary stability of selected 8-MOP MEs
The 8-MOP ME was stored at 25°C or 4°C for 60 months. Stability was evaluated by visual inspection, centrifugal stability, and physicochemical characterization on days 30 and 60.
Preparation of chitosan derivative-coated 8-MOP MEs
At a concentration of 0.75%, LC, CC, AC, and HC were used to replace the water phase in the selected formulation of 8-MOP MEs to formulate LC-coated 8-MOP MEs, CC-coated 8-MOP MEs, AC-coated 8-MOP MEs, and HC-coated 8-MOP MEs.
Characterization of chitosan derivative-coated 8-MOP MEs
Characterization of chitosan derivative-coated 8-MOP MEs was conducted the same as for the selected 8-MOP MEs, including TEM, droplet size, PDI, ς-potential, pH, electronic conductivity, and maximum drug-loading capacity. For drug loading–capacity calculation, 100 µL MEs or chitosan derivative-coated MEs were diluted by adding methanol with sonication for 15 minutes, and the samples were analyzed by HPLC. Also, preliminary stability of selected chitosan derivative-coated 8-MOP MEs was evaluated.
Comparison of ex vivo skin permeation of 8-MOP MEs and chitosan derivative-coated 8-MOP MEs
Ex vivo skin-permeation experiments were conducted in the same fashion to compare skin retention and permeation of the 8-MOP in MEs and in chitosan derivative-coated ME formulations. Chitosan derivative-coated 8-MOP MEs with higher retention:permeation ratio were selected for in vivo microdialysis experiments.
HPLC analysis of ex vivo skin-permeation study samples
Receptor-phase samples were filtered through 0.22 µm polytetrafluoroethylene filters (Millipore) and then analyzed with a validated HPLC method. Skin samples were prepared as described in the ex vivo skin-permeation study. Receptor-phase samples and supernatant of skin samples were analyzed by HPLC using a Welchrom C18 column (5 µm, 4.6×250 nm) with a methanol:water ratio of 58:42 v:v as the mobile phase. Flow rate was fixed at 1 mL/min and ultraviolet-detection wavelength at λ=249 nm.
Microdialysis system
To test the in vivo skin-targeting efficacy of 8-MOP MEs and chitosan derivative-coated 8-MOP MEs, a microdialysis system was developed. CMA 30 linear microdialysis probes with a 6 kDa membrane cutoff and a dialysis membrane length of 10 mm were used (model 801,0460; CMA Microdialysis, Solna, Sweden). A microsyringe pump (CMA 102) was used to pump the perfusate at different constant flow rates, and microdialysate samples were collected in 0.6 mL amber polypropylene tubes (Thermo Fisher Scientific, Waltham, MA, USA) using a CMA 170 automated collector system.
Pharmacokinetic study
In vitro recovery
The pharmacokinetic study on animals was carried out in accordance with the recommendations in the Guide for the Care and Use of Laboratory Animals and approved by the Animal Ethical Committee of the Second Xiangya Hospital of Central South University. Both incremental and decremental methods were used to test in vitro microdialysis recovery. For the incremental method, the probe was sunk in three different concentrations of 8-MOP (5, 50, and 600 ng mL−1) and isotonic PBS was perfused. For the decremental method, the probe was sunk in isotonic PBS and three different concentrations of 8-MOP (5, 50, and 600 ng mL−1) were perfused. The perfusion flow rate was fixed at 1 µL min−1. After an equilibration period of 1 hour, microdialysates (60 µL) were collected every hour for 5 hours. Collected samples were analyzed using a validated HPLC method. Relative recovery was obtained by the incremental method and relative loss by the decremental method.Citation23,Citation24
In vivo recovery
Male Sprague Dawley rats (n=5) were anesthetized with 1% pentobarbital sodium (40 mg/kg), and a temperature-maintaining heating pad (37°C) was used to control body temperature. Abdominal fur was shaved from the dorsal area (3×3×0.2 cm). A CMA 30 dermal probe was inserted through the tip of the cannula and the introducer needle then retracted, leaving the dialysis membrane implanted in the dermal tissue of the ventral region. Three concentrations of 8-MOP (5, 50, and 600 ng mL−1) solution were perfused. Perfusion, equilibration, and sample collection were performed as for in vitro recovery experiments.
Stability of in vivo recovery
For evaluation of stability of in vivo recovery, a moderate concentration of 8-MOP (50 ng mL−1) was used. Microdialysis parameters were the same, but samples were collected every hour for 12 hours.
Administration and microdialysis
A total of 24 male Sprague Dawley rats weighing 200–250 g were used for in vivo microdialysis study. The animals were housed in well-spaced ventilated cages and maintained on healthy diets. Prior to the studies, the animals were fasted for 12 hours. Animals were separated into three groups. Anesthetization and fur shaving were as previously described. Group 1 (n=6) received 0.1% 8-MOP tincture (0.7 mL), group 2 (n=6) 8-MOP MEs, and group 3 (n=6) and group 4 (n=6) received two selected chitosan derivative-coated ME formulations each. All formulations were applied to medical gauze and overlaid on exposed skin (3×3×0.22 cm) at an equivalent 8-MOP dose (0.7 µg). Microdialysis conditions and sample collections were as previously described. Blood samples were collected from tail veins of rats at predetermined time intervals. After the last blood sampling, the hairless skin was excised and the formulation wiped off using medical alcohol. All procedures were carried out in accordance with the recommendations in the Guide for the Care and Use of Laboratory Animals. The protocol was approved by the ethics committee of the Second Xiangya Hospital of Central South University.
UPLC-MS analysis of pharmacokinetic study samples
For microdialysate samples, 60 µL of each sample was collected in a 1.5 mL Eppendorf tube, mixing with 30 µL TMP (200 ng mL−1) as internal standard. Then, ethyl acetate (600 µL) was added, with vortexing for 5 minutes. Supernatant (550 µL) was collected after centrifuging at 15,000 rpm for 10 minutes (10°C). After vacuum drying (37°C), the residual was dissolved with methanol (60 µL) and analyzed by ultraperformance LC (UPLC) mass spectrometry (MS). For blood samples, sera were obtained by centrifuging samples at 5,000 rpm for 10 minutes. Serum (150 µL) was mixed with 30 µL TMP (200 ng mL−1). Then, ethyl acetate (1,000 µL) was added, with vortexing for 5 minutes. Supernatant (950 µL) was collected after centrifugation at 15,000 rpm for 10 minutes (10°C). After vacuum drying (37°C), the residual was dissolved with methanol (60 µL) and analyzed by UPLC-MS.
A UPLC-MS system equipped with an LC-20A workstation (Shimadzu, Kyoto, Japan) with quadrupole linear ion-trap MS (4,000 Q Trap; Applied Biosystems, Foster City, CA, USA). Chromatographic conditions were Xtimate XB-C8 column (2.1×30 mm, 3 µm, Welch material), methanol:water 70:30 v:v as mobile phase, fixed flow rate 0.25 mL min−1, and temperature 450°C. MS conditions were electrospray-ionization probe operated in positive-ionization mode, capillary voltage 3 kV, cone voltage 35 kV, extractor voltage 3 kV, multiple reaction–monitoring transitions at mass-to-charge ratios (m/z) of 229.1 → 141.9 for 8-MOP, and desolvation temperature 450°C.
Statistical analysis
All statistical analyses were performed with SPSS 19.0. Results are expressed as mean ± SD. The differences among groups were evaluated by ANOVA, followed by Duncan’s multiple-range tests. All data analyses were performed at a significance level of α=0.05.
Results
Preparation of 8-MOP MEformulations
Among various formulations tested, three (A, B, and C) exhibited good stability after 1 month of storage and were selected for ex vivo skin-permeation study. Details of composition are available in .
Ex vivo skin retention/permeation study of 8-MOP ME formulations
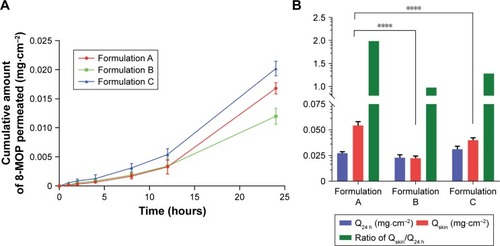
Results of ex vivo skin-permeation study for the three 8-MOP ME formulations are shown in . Details of ex vivo skin-permeation profiles are summarized in . Briefly, the permeation rate and cumulative permeated amount of 8-MOP of formulation A were lower than formulation C, but higher than formulation B. However, formulation A showed the highest skin retention of 8-MOP, as well as highest retention:permeation ratio. Therefore, formulation A, with the highest retention:permeation ratio of 1.98, was the optimal formulation of 8-MOP ME and was selected for further experiments.
Table 1 Ex vivo skin-permeation profile of three 8-MOP ME formulations
Figure 1 Ex vivo skin-permeation profile of the three ME formulations (n=6).
Notes: (A) Cumulative 12-hour 8-MOP permeation; (B) comparison of amount of 8-MOP retained and permeated in the skin and calculated retention:permeation ratio (****P<0.0001). Formulation A showed a significant higher amount of 8-MOP retained in the skin than formulation B and C, formulation A also showed the highest ratio of retention/permeation.
Abbreviations: ME, microemulsion; MOP, methoxypsoralen.
Characterization of selected 8-MOP MEs
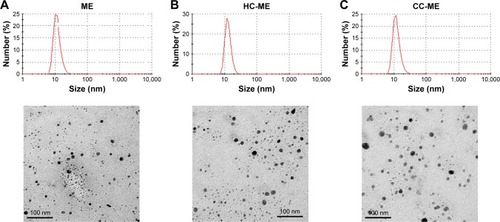
The selected 8-MOP MEs (formulation A) were colorless, transparent, and homogeneous, with slight pale-blue opalescence and good fluidity. 8-MOP ME particles were spherical and uniformly distributed in the system when observed under TEM (). The mean droplet size of 8-MOP ME was 17.303 nm, with PDI 0.142, ς-potential −17.40 mV, pH 6.225, and electronic conductivity 24.75 µS·cm−1 (). The appearance, clarity, and physicochemical characterizations of samples had not changed after 60 days of storage at 4°C or 25°C ().
Table 2 Physiochemical characterization of 8-MOP MEs and four chitosan derivative-coated 8-MOP MEs
Figure 2 Appearance and micromorphology of ME formulations.
Notes: (A) 8-MOP MEs; (B) HC-MEs; (C) CC-MEs. Size distribution assessed by dynamic light scattering; images observed under transmission electron microscopy.
Abbreviations: ME, microemulsion; MOP, methoxypsoralen; HC, hydroxypropyl chitosan; CC, carboxymethyl chitosan; PDI, polydispersity index.
Comparison of ex vivo skin retention/ permeation of 8-MOP MEs and chitosan derivative-coated 8-MOP MEs
Chitosan derivative-coated 8-MOP MEs were prepared using chitosan-derivative solutions (0.75%) as the water phase in the selected formulation A. The appearance of the four formulated derivatives – AC-MEs, LC-MEs, CC-MEs, and HC-MEs – was transparent and homogeneous with good fluidity. As summarized in , all formulations were uniformly distributed (PDI <0.2), with similar droplet sizes (17–20 nm). The ς-potential value also reflects the stability of the formulation, and the absolute ς-potentials of chitosan derivative-coated MEs were higher than 8-MOP MEs, showing increased stability. pH values of AC-ME and LC-ME were lower than other formulations, due to the existence of acetate and lactate. The electronic conductivity of AC-ME was higher than other formulations, because of the acetate as a mild acid. However, drug-loading capacity was not significantly different among formulations (1.4–1.7 mg mL−1). Therefore, a balanced amount of drug (1.4 mg mL−1) was chosen for preparing those formulations of equivalent 8-MOP dosage for further experiments. HC-ME and CC-ME particles were also spherical and uniformly distributed in the system ().
Comparison of ex vivo skin retention/ permeation of 8-MOP MEs and chitosan derivative-coated 8-MOP MEs
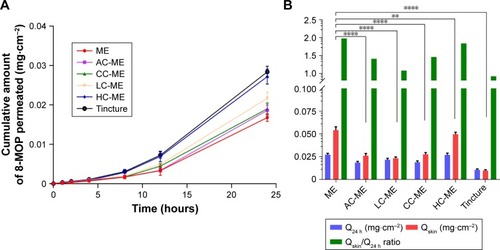
To compare ex vivo skin permeability of 8-MOP MEs and chitosan derivative-coated MEs, as well as 8-MOP tincture, each formulation was added to abdominal porcine skin at an equivalent dose of 8-MOP. The cumulative permeated amount of 8-MOP (Qn) is presented in . While less 8-MOP in tincture permeated the skin, it exhibited the lowest retention:permeation ratio (). 8-MOP MEs showed the highest ex vivo skin permeability, as well as the highest retention:permeation ratio. Retention:permeation ratios of HC-ME and CC-ME were higher than other chitosan-coated 8-MOP ME formulations, and were selected for in vivo pharmacokinetic study ().
Table 3 Ex vivo skin permeability of 8-MOP MEs, chitosan derivative-coated 8-MOP MEs, and 8-MOP tincture
Figure 3 Ex vivo skin-permeation profile of the selected ME formulation, HC-MEs, CC-MEs, AC-MEs, LC-MEs, and tincture (n=6).
Notes: (A) Cumulative 12-hour 8-MOP permeation of skin; (B) comparison of 8-MOP retained and permeated in skin and calculated retention:permeation ratio (****P<0.001, **P<0.01). MEs showed a significantly higher amount of 8-MOP retained in the skin than all chitosan derivative-coated MEs, and also showed the highest ratio of retention:permeation.
Abbreviations: ME, microemulsion; HC, hydroxypropyl chitosan; CC, carboxymethyl chitosan; AC, acetic chitosan; LC, lactate chitosan; MOP, methoxypsoralen.
Pharmacokinetic study
shows anesthetized rats under pharmacokinetic study. Fur on the abdomen was shaved with no harm to the skin. Microdialysis membrane was steadily implanted in the dermal tissue of the ventral region. UPLC-MS was valid for 8-MOP, internal-standard TMP showed no significant overlap, and chromatography for blank microdialysates and blank plasma showed minimal influence on the sample (). Mean in vitro recovery between dialysis (relative recovery 34.4%±5.6%) and retrodialysis (RL 35.1%±3.7%) was consistent, with no significant difference between different doses (). Therefore, RL was used for in vivo microdialysis analysis. In vivo recovery was not significantly changed when different concentrations of 8-MOP were perfused (), and RL for the moderate concentration was relatively low, but generally stable (mean 20.0%±1.6%) during 12-hour testing ().
Figure 4 Rats under in vivo pharmacokinetic study.
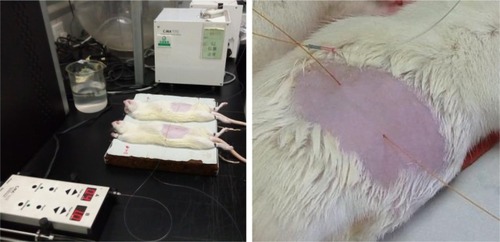
Figure 5 In vitro and in vivo recovery from microdialysis (n=5).
Notes: RR was obtained by the incremental method and RL by the decremental method. (A) In vitro RR and RL for different concentrations of 8-MOP (5, 50, and 600 ng mL−1) perfused. RR and RL showed no significant difference, and RL was used as an alternative for RR. (B) In vivo recovery (RL) for different concentrations of 8-MOP (5, 50, and 600 ng mL−1). In vivo recovery was consistent for different concentrations of 8-MOP. (C) Stability of in vivo recovery during 12-hour testing, when a moderate concentration of 8-MOP (50 ng mL−1) was perfused. In vivo recovery over 12 hours was generally stable for analysis.
Abbreviations: MOP, methoxypsoralen; RR, relative recovery; RL, relative loss.

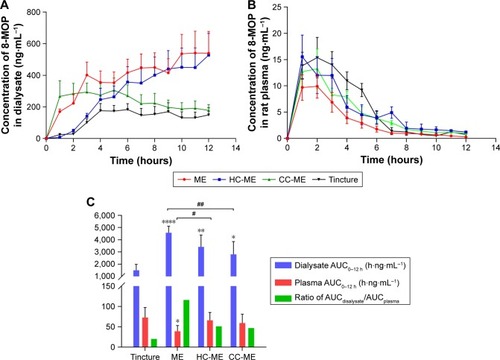
Results of in vivo pharmacokinetic study were consistent with the ex vivo study. MEs, HC-MEs, and CC-MEs all showed increased skin retention and decreased plasma 8-MOP concentration than tincture (). 8-MOP in tincture was less able to distribute in the skin, but easily permeated the skin and entered the bloodstream. 8-MOP in CC-MEs released and distributed in the skin very quickly, but were not retained. 8-MOP in HC-MEs was released in controlled fashion and was steadily distributed in the skin, but also a higher amount of 8-MOP permeated the skin and entered the bloodstream than CC-MEs. However, 8-MOP MEs were readily distributed and retained in the skin, and the amount of 8-MOP permeating the skin significantly decreased. Quantitatively, ME was the only formulation with dialysate AUC0–12 hours higher than plasma AUC0–12 hours ( and ). MEs showed better skin-retention ability (3.05-fold higher than tincture, 1.63-fold higher than CC-MEs, and 1.34-fold higher than HC-MEs). More importantly, plasma AUC0–12 hours for 8-MOP MEs was significantly decreased (0.54-fold less than tincture, 0.66-fold less than CC-ME and 0.59-fold less than HC-ME). Therefore, the skin-targeting ability of ME was better than HC-MEs and CC-MEs, with a substantially increased ratio of AUCdialysate:AUCplasma.
Table 4 Pharmacokinetic parameters of microdialysate samples
Table 5 Pharmacokinetic parameters of plasma samples
Figure 6 In vivo pharmacokinetic profile of 8-MOP MEs, HC-MEs, CC-MEs, and tincture (n=6).
Notes: (A) Dermal concentration–time profiles over 12 hours of 8-MOP retained in the skin; (B) 12-hour plasma concentration–time profiles of 8-MOP; (C) comparison of 8-MOP retained (AUCdialysate) and permeated (AUCplasma) in skin and calculated retention:permeation ratio (compared to tincture, ****P<0.001, **P<0.01, *P<0.05; compared to MEs, ##P<0.01, #P<0.05). MEs showed a significantly higher amount of 8-MOP retained in the skin than any other formulation, as well as the highest ratio of AUCdialysate:AUCplasma.
Abbreviations: MOP, methoxypsoralen; MEs, microemulsions; HC, hydroxypropyl chitosan; CC, carboxymethyl chitosan.
Discussion
In this study, we aimed to enhance the retention of 8-MOP in the skin while reducing its entry to the bloodstream (skin permeation) using MEs and chitosan derivative-coated MEs as delivery vehicles. Of various 8-MOP formulations prepared, we selected three formulations, MEs, HC-MEs, and CC-ME, as vehicles for topical delivery of 8-MOP. While the ME formulation exhibited enhanced skin-targeting effects of 8-MOP, chitosan derivatives failed to enhance the skin-targeting effects of 8-MOP MEs further. Nevertheless, the selected 8-MOP ME formulation was a simple and promising vehicle for targeted skin delivery of 8-MOP.
In our preparation of ME formulations, we did not assign much priority to drug loading. Drug retention in the skin is dependent on drug distribution between the vehicle and the skin.Citation25 ME formulations with elevated adherence and spreadability on the skin, as well as permeation ability through the stratum corneum, would be more likely to reduce skin-layer partitioning and prolong retention of the drug in the skin.Citation26,Citation27 Therefore, ME formulations were firstly selected for their stability and solubility for preparing oil-in-water MEs of 8-MOP and then selected for their skin-targeting ability. Of ME formulations of various compositions prepared, only three were homogeneous, clear, and transparent after the stability test and suitable for drug-loading.
In our ex vivo skin retention/permeation study, formulation A showed the highest skin retention:permeation ratio and was selected for in vivo study. Surfactants and cosurfactants may interact with skin components and reversibly weaken its barrier capability and facilitate drug permeation.Citation28 The Q24 and Qskin of formulations A and C were higher than formulation B, because ethanol can enhance skin permeation.Citation29,Citation30 Formulation C contained oleic acid, and showed improved transdermal ability.Citation31,Citation32 Therefore, formulation A was able to penetrate the stratum corneum, but less able to permeate the skin, and showed the highest retention:permeation ratio. In our following ex vivo skin-permeation study comparing the ME (formulation A) and chitosan-coated MEs, HC-MEs, and CC-MEs showed higher retention:permeation ratio than AC-MEs and LC-MEs. This could be attributed to the low pH values of AC and LC, as the composition of the ME formulation was consistent among all formulations. It has been reported that high pH values of formulations can quickly increase skin pH and alter stratum corneum integrity/ cohesion alterations, leading to increased permeability.Citation33
In our pharmacokinetic study, the concentration of 8-MOP retained in the skin increased cumulatively, but the 8-MOP plasma time–concentration curve looked like single-dose oral administration (). We speculate that the majority of penetration enhancers, like water, oil, and surfactants/ cosurfactants in the formulations were quickly (<2 hours) absorbed and dissipated in the skin during the skin-permeation process, leaving 8-MOP retained in the skin with less entering the bloodstream. For drug retained in the skin, elimination was slow and the amount appeared to be accumulating during 12-hour microdialysis. Increased skin permeation of HC-MEs and CC-MEs over MEs confirmed that chitosan derivatives can help permeate the dermis layer. Also, skin retention for HC-MEs was slightly higher than CC-MEs, and this could be attributed to the positive ς-potential of HC-MEs, which interacted with tight-junction proteins in the skin.Citation34–Citation36 However, further studies concerning the skin-permeation mechanism for chitosan-coated ME are warranted.
In conclusion, three selected formulations (8-MOP MEs, HC-MEs, and CC-MEs) successfully enhanced skin retention and decreased skin permeation of 8-MOP. However, neither HC-MEs nor CC-MEs further increased the skin-targeting effects of 8-MOP over MEs. Superior skin-targeting effects of MEs were highlighted, and the 8-MOP ME formulation containing 2.9% ethyl oleate, 17.2% EL35, 8.6% ethanol and 71.3% water could be a promising and safe alternative for the treatment of vitiligo.
Acknowledgments
This work was supported by the Hunan Provincial Science and Technology Plan (2016TP2002), Nature Science Foundation of China (NSFC81573718), and Hunan Provincial Natural Science Foundation of China (2019JJ50882).
Supplementary materials
Figure S1 Valid UPLC-MS method for detecting 8-MOP in microdialysate.
Notes: (A) MS: upper, 8-MOP; lower, TMP. (B) Representative chromatography: upper, blank dialysate; lower, blank plasma. (C) Representative chromatography: upper, dialysate sample; lower, plasma sample.
Abbreviations: UPLC, ultraperformance liquid chromatography; MS, mass spectrometry; MOP, methoxypsoralen; MRM, multiple-reaction monitoring; TIC, total ion current; TMP, trimethylpsoralen; ES, electrospray.
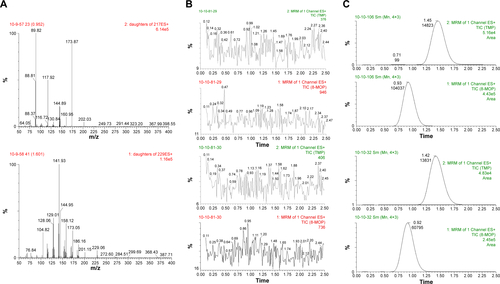
Table S1 Details of three 8-MOP ME formulations
Table S2 Preliminary stability of 8-MOP MEs, CC-MEs, and HC-MEs
Disclosure
The authors report no conflicts of interest in this work.
References
- FrisoliMLHarrisJEVitiligo: mechanistic insights lead to novel treatmentsJ Allergy Clin Immun201714065466210.1016/j.jaci.2017.07.01128778794
- EzzedineKShethVRodriguesMVitiligo is not a cosmetic diseaseJ Am Acad Dermatol20157388388510.1016/j.jaad.2015.07.03926475548
- RashighiMHarrisJEVitiligo pathogenesis and emerging treatmentsDermatol Clin20173525726510.1016/j.det.2016.11.01428317534
- RodriguesMEzzedineKHamzaviIPandyaAGHarrisJEVitiligo Working GroupNew discoveries in the pathogenesis and classification of vitiligoJ Am Acad Dermatol20177711310.1016/j.jaad.2016.10.04828619550
- HomanMWLSpulsPIde KorteJBosJDSprangersMAvan der VeenJPWThe burden of vitiligo: patient characteristics associated with quality of lifeJ Am Acad Dermatol20096141142010.1016/j.jaad.2009.03.02219577331
- RodriguesMEzzedineKHamzaviIPandyaAGHarrisJEVitiligo Working GroupCurrent and emerging treatments for vitiligoJ Am Acad Dermatol201777172910.1016/j.jaad.2016.11.01028619557
- TaiebAAlomarABoehmMVitiligo European Task Force (VETF); European Academy of Dermatology and Venereology (EADV); Union Européenne des Médecins Spécialistes (UEMS)Guidelines for the management of vitiligo: the European Dermatology Forum consensusBr J Dermatol201316851910.1111/j.1365-2133.2012.11197.x22860621
- YonesSSPalmerRAGaribaldinosTMHawkJLMRandomized double-blind trial of treatment of vitiligo – efficacy of psoralen-UV-A therapy vs narrowband-LTV-B therapyArch Dermatol200714357858410.1001/archderm.143.5.57817519217
- LapollaWYentzerBABagelJHalvorsonCRFeldmanSRA review of phototherapy protocols for psoriasis treatmentJ Am Acad Dermatol20116493694910.1016/j.jaad.2009.12.05421429620
- OzkanIKoseOOzmenIArcaEEfficacy and safety of non-laser, targeted UVB phototherapy alone and in combination with psoralen gel or calcipotriol ointment in the treatment of localized, chronic, plaque-type psoriasisInt J Dermatol20125160961310.1111/j.1365-4632.2011.05257.x22515588
- HorioTOkamotoHThe mechanisms of inhibitory effect of 8-methoxypsoralen and long-wave ultraviolet light on experimental contact sensitizationJ Invest Dermatol1982784024057069217
- Grundmann-KollmannMTegederIOchsendorfFRKinetics and dose-response of photosensitivity in cream psoralen plus ultraviolet A photochemotherapy: comparative in vivo studies after topical application of three standard preparationsBr J Dermatol200114499199510.1046/j.1365-2133.2001.04187.x11359386
- MizunoNEnamiHEsakiKEffect of 8-methoxypsoralen plus UVA on psoriasis leukotactic factorJ Invest Dermatol1979726466422869
- WolffKSide-effects of psoralen photochemotherapy (PUVA)Br J Dermatol1990122Suppl 36117125
- GargBJGargNKBegSSinghBKatareOPNanosized ethosomes-based hydrogel formulations of methoxsalen for enhanced topical delivery against vitiligo: formulation optimization, in vitro evaluation and preclinical assessmentJ Drug Target20162423324610.3109/1061186X.2015.107085526267289
- WuC-SLanC-CEWangL-FChenG-SWuC-SYuH-SEffects of psoralen plus ultraviolet A irradiation on cultured epidermal cells in vitro and patients with vitiligo in vivoBr J Dermatol200715612212910.1111/j.1365-2133.2006.07584.x17199578
- BorowskaKWolowiecSRubajAGlowniakKSieniawskaERadejSEffect of polyamidoamine dendrimer G3 and G4 on skin permeation of 8-methoxypsoralene-in vivo studyInt J Pharmaceut201242628028310.1016/j.ijpharm.2012.01.041
- FanunMMicroemulsions as delivery systemsCurr Opin Colloid In20121730631310.1016/j.cocis.2012.06.001
- ChenHBChangXLWengTA study of microemulsion systems for transdermal delivery of triptolideJ Control Release20049842743610.1016/j.jconrel.2004.06.00115312998
- ShenLNZhangYTWangQXuLFengNPPreparation and evaluation of microemulsion-based transdermal delivery of total flavone of rhizoma arisaematisInt J Nanomed2014934533464
- KreilgaardMInfluence of microemulsions on cutaneous drug deliveryAdv Drug Deliver Rev200254S77S9810.1016/S0169-409X(02)00116-3
- KumariBKesavanKEffect of chitosan coating on microemulsion for effective dermal clotrimazole deliveryPharm Dev Technol20172261762610.1080/10837450.2016.123062927574791
- VoelknerNMFVoelknerACostaJDermal pharmacokinetics of pyrazinamide determined by microdialysis sampling in ratsInt J Antimicrob Ag20185119019610.1016/j.ijantimicag.2017.10.001
- KreilgaardMDermal pharmacokinetics of microemulsion formulations determined by in vivo microdialysisPharmaceut Res20011836737310.1023/A:1011067300397
- ProwTWGriceJELinLLNanoparticles and microparticles for skin drug deliveryAdv Drug Deliver Rev20116347049110.1016/j.addr.2011.01.012
- RaiVKMishraNYadavKSYadavNPNanoemulsion as pharmaceutical carrier for dermal and transdermal drug delivery: formulation development, stability issues, basic considerations and applicationsJ Control Release201827020322510.1016/j.jconrel.2017.11.04929199062
- MatouguiNBogeLGrooA-CLipid-based nanoformulations for peptide deliveryInt J Pharmaceut2016502809710.1016/j.ijpharm.2016.02.019
- NastitiCMPontoTAbdEGriceJEBensonHAERobertsMSTopical nano and microemulsions for skin deliveryPharmaceutics201793710.3390/pharmaceutics9040037
- LopesLBGarciaMTBentleyMVChemical penetration enhancersTher Deliv201561053106110.4155/tde.15.6126458111
- WilliamsACBarryBWPenetration enhancersAdv Drug Deliv Rev20045660361810.1016/j.addr.2003.10.02515019749
- DubeyVMishraDNaharMJainNKVesicles as tools for the modulation of skin permeabilityExpert Opin Drug Del2007457959310.1517/17425247.4.6.579
- LarruceaEArellanoASantoyoSYgartuaPCombined effect of oleic acid and propylene glycol on the percutaneous penetration of tenoxicam and its retention in the skinEur J Pharm Biopharm20015211311911522475
- HachemJPManMQCrumrineDSustained serine proteases activity by prolonged increase in pH leads to degradation of lipid processing enzymes and profound alterations of barrier function and stratum corneum integrityJ Invest Dermatol200512551052010.1111/j.0022-202X.2005.23838.x16117792
- TurnerJRBuschmannMMRomero-CalvoISailerAShenLThe role of molecular remodeling in differential regulation of tight junction permeabilitySemin Cell Dev Biol20143620421210.1016/j.semcdb.2014.09.02225263012
- BrandnerJMTight junctions and tight junction proteins in mammalian epidermisEur J Pharm Biopharm20097228929410.1016/j.ejpb.2008.08.00718775491
- YoshidaKYokouchiMNagaoKIshiiKAmagaiMKuboAFunctional tight junction barrier localizes in the second layer of the stratum granulosum of human epidermisJ Dermatol Sci201371899910.1016/j.jdermsci.2013.04.02123712060