
 ?Mathematical formulae have been encoded as MathML and are displayed in this HTML version using MathJax in order to improve their display. Uncheck the box to turn MathJax off. This feature requires Javascript. Click on a formula to zoom.
Abstract
Background
Biological complications are an issue of critical interest in contemporary dental and orthopedic fields. Although titanium (Ti), graphene oxide (GO) or silver (Ag) particles are suitable for biomedical implants due to their excellent cytocompatibility, bioactivity, and antibacterial properties, the exact antibacterial mechanism is not understood when the three substances are combined (Ti-GO-Ag).
Materials and methods
In this work, the material characterization, antibacterial property, antibacterial mechanisms, and cell behavior of Ti-GO-Ag fabricated by electroplating and ultraviolet reduction methods respectively, were investigated in detail.
Results
The material char acterization of Ti-GO-Ag tested by atomic force microscopy, Raman spectroscopy, X-ray photoelectron spectroscopy, nanoindentation, nanoscratch, inductively coupled plasma mass spectrometer, and contact angle tester revealed the importance of GO concentration and Ag content in the preparation process. The antibacterial tests of Ti-GO-Ag clearly demonstrated the whole process of bacteria interacting with materials, including reactive oxygen species, endocytosis, aggregation, perforation, and leakage. In addition, the behavior of Ti-GO-Ag showed that cell area, length, width, and fluorescence intensity were affected.
Conclusion
Briefly, Ti-GO-Ag nanocomposite was a dual-functionalized implant biomaterial with antibacterial and biocom patible characterization.
Introduction
Biological complications are a topic of major and vital interest in contemporary dental and orthopedic fields which affect osseointegrated implants.Citation1 The biological complications mainly involve inflammatory factors associated with bacterial invasion,Citation2–Citation4 such as peri-implant mucositis and peri-implantitis, etc, which are critical complications after operation resulting in not only implant surgery failure, but also serious morbidity, complications, and mortality.Citation5–Citation7 Although titanium (Ti) and Ti alloy implant materials have a good biocompatibility and stability under physiological condition, and are widely utilized to dental and orthopedic fields,Citation8,Citation9 the implants have no intrinsic antibacterial activity. Certainly, there are some strategies to endow Ti implant materials with antibacterial properties, eg, antibiotic, chlorhexidine, antibacterial peptide, nitric oxide, and fluorin, etc, especially silver (Ag) nanoparticles, due to the capability of tuning biomaterial surface morphology and the broad antibacterial spectrum.Citation10,Citation11 The exact antibacterial property and mechanism of Ag nanoparticles are investigated widely. Free Ag radicals were measured after treatment with Ag nanoparticles from the bacterial culture medium,Citation12 disrupted bacteria metabolism, and increased bacterial permeability leading to deathCitation13 by Ag ions leached from the Ag nanoparticle solution.Citation14–Citation16 When Ag nanoparticles combined with Ti via plasma ion immersion implantation, its antibacterial property and mechanism were tested and analyzed. After co-culturing with bacteria, Ag nanoparticles and Ti induced the production of reactive oxygen species (ROS) to increase the oxidative stress leading to bacteria physiological changes or death.Citation17 Besides combination with Ti, Ag nanoparticles can also associate with graphene oxide (GO). And they exhibited more antibacterial performance than Ag nanoparticles and the simple mixture of Ag nanoparticles and GO. Highly effective antibacterial ability was shown at very low dosages with a minimum inhibitory concentration (MIC) of 14 µg/mL against Staphylococcus aureus and 4 µg/mL against Escherichia coli. It may be due to the unique physicochemical performance of Ag nanoparticles and GO.Citation18 In fact, the mechanisms of S. aureus and E. coli were different as well. The nanocomposite played a bactericidal role against S. aureus by significantly inhibiting bacterial division; while it was against E. coli by destroying the integrity of bacterial cell wall.Citation18
In recent years, GO, being rich in oxygen-containing functional groups, has attracted increasing attentions in bio-medicine for its wide applications, such as gene transfection, photothermal therapy, tumor imaging, biosensing, as well as drug delivery due to their outstanding optical, physicochemical and mechanical properties.Citation19 On the one hand, it is reported that GO can promote cell adhesion, proliferation, and differentiation trough electrostatic and hydrophobic interactions.Citation20–Citation23 Based on the above characteristics, GO can be loaded electrochemically onto Ti surface to improve cell viability and osteogenic property of osteoblast-like cells.Citation18,Citation20On the other hand, the potential antibacterial application of GO has attracted considerable interest.Citation24–Citation29 But whether and how GO executes antibacterial property are still under debate.
In addition, it was reported that residues featuring Ti peaks were measured by X-ray photoelectron spectroscopy from peri-implantitis sites occasionally.Citation30 Similar findings were also studied by Fretwurst et al at peri-implantitis sites.Citation31 Nevertheless, both studies were lacking healthy patients as a control group. Olmedo et al demonstrated the release of Ti ions at healthy and peri-implantitis sites.Citation32 The Ti ions concentration appeared to be lower at healthy sites than those at peri-implantitis sites.Citation32 Therefore, loading GO onto Ti substrate surface may reduce the release of Ti ions and inflammation, and promote osteogenesis.
In this work to address these questions, GO with different concentrations and Ag particles were incorporated onto Ti substrate surface via electroplating and ultraviolet reduction methods, respectively. Material characterization, antibacterial activity and mechanism, and cell morphology and activity were investigated. Based on our previous study,Citation33 GO film and Ag nanoparticles were successfully loaded onto the pure Ti surface. Ag content was proportional to GO concentration. The results showed that Ti-GO-Ag played a crucial role in killing bacteria through inducing physiological changes, such as ROS, perforation, leakage, and DNA/RNA release. Especially for pre-osteoblasts, Ti-GO-Ag nanocomposite changed cells morphology and structure, including cell area, length, width, as well as fluorescence intensity.
Materials and methods
Specimen fabrication
Pure Ti square plates (2×10×10 mm3, 99.8% purity) were polished to 2000-grit SiC sandpaper, and ultrasonically cleaned with acetone, ethanol and deionized water for 10 minutes, respectively. Subsequently, specimens were modified by different GO concentration (20 µg/mL, 50 µg/mL, 80 µg/mL, 100 µg/mL) using a magnetic stirrer at 20 V. Ag nanoparticles were loaded via ultraviolet reduction method on Ti-GO surface according to the previous report.Citation33 Ti-GO specimen was soaked in AgNO3 solution (1 mol/L) for 30 minutes at room temperature. Then it was rinsed gently with deionized water and irradiated with ultraviolet light for 30 minutes. According to the concentration of GO, they were labeled as G20, G50, G80, and G100, respectively. Additionally, polished pure Ti substrate served as control group. All the substrates were subjected to ultraviolet radiation for 1 hour.
Material characterization
The morphology and three-dimensional structure of specimen surface were inspected by atomic force microscopy (AFM, Agilent 5500 SPM; Agilent Technologies, Santa Clara, CA, USA). The qualitative analysis of GO loaded on Ti surface was recorded with Raman spectroscopy (HR800, HORIBA Ltd, Kyoto, Japan). Using X-ray photoelectron spectroscopy (XPS, AXIS ULTRA, Kratos Analytical Inc., Chestnut Ridge, NY, USA) the chemical composition and elemental distribution of Ti substrate modified with GO and Ag was analyzed. Nanoindentation (G200, Agilent Technologies) and nanoscratch (APEX, CETR, Campbell, Silicon Valley, CA, USA) were employed to test elastic modulus and friction of GO film coating respectively. The release of Ag ion coated on Ti-GO surface was monitored using inductively coupled plasma mass spectrometer (ICP-MS, X series II/SN 1007 C, MA, USA). Notably, specimens immersed in PBS must be incubated in the dark at 37°C. The PBS was replaced by fresh PBS and collected every 24 hours, which was stored in the dark at 4°C. In addition, before testing the samples, standard solutions of Ag ions have to be prepared and measured (0 ppb, 200 ppb, 400 ppb, 600 ppb, 800 ppb and 1,000 ppb). The aim was to calibrate the release of Ag ions in the study. Hydrophilic property of Ti-GO-Ag surface was characterized by contact angle tester (EasyDrop Standard, Krüss GmbH, Hamburg, Germany).
Antibacterial assay
S. aureus (SA, ATCC25923; The Fourth Military Medical University, Xi’an, Shaanxi, China) and Streptococcus mutans (SM, UA159; The Fourth Military Medical University, Xi’an, Shaanxi, China) were cultivated at 37°C in the brain heart infusion (BHI; Thermo Fisher Scientific, Waltham, MA, USA) under aerobic atmosphere and anaerobic atmosphere (10% CO2, 10% H2, 80% N2), respectively. Specimens were sterilized and placed on a 24-well culture plate with 1 mL of bacterial suspension (1×10⁶ CFU/mL) for 24 hours. After exposure to bacteria for 24 hours, the specimens were rinsed gently with PBS three times to remove the nonadherent bacteria. The antibacterial rates of S. aureus and S. mutans were measured by following formula:
In addition, pure Ti served as the control. G20, G50, G80, and G100 constituted the experimental groups. Bacteria morphology was observed using field emission scanning electron microscopy (FE-SEM, S-4800, Hitachi Ltd, Tokyo, Japan) after fixation with 2.5% glutaraldehyde at 4°C overnight, dehydration with 50%, 70%, 80%, 90%, 100% alcohol for 15 minutes each, drying and sputter coating with platinum. Bacteria inner-structure was investigated transmission electron microscope (TEM, JEM-1011, JEOL Ltd, Akishima, Japan) after fixation, dehydration, embedding, slicing and staining. Bacteria membrane integration was tested by laser scanning confocal microscopy (LSCM, Fluoview FV1000, Olympus Corporation, Tokyo, Japan) using LIVE/DEAD BacLight bacterial viability kits (L13152, Thermos Fisher Scientific) for 15 minutes at room temperature in the dark. Flow cytometry (FACS Aria II, BD Biosciences, San Jose, CA, USA) was utilized to monitor the bacterial apoptosis rate with LIVE/DEAD BacLight bacterial viability kits. Real-time polymerase chain reaction (RT-PCR, Thermo Fisher Scientific) was employed to implement gene expressions of S. aureus and S. mutans with cDNA templates, primers, and SYBR Premix Ex TaqTM (Takara Bio Inc. Kusatsu, Japan). Before being tested, gene expression have to undergo a series of procedures, eg, isolating, centrifuging, digesting, splitting, deproteinization, rinsing, calculating, reverse-transcribing, etc. The primers sequences were showed in . Additionally, 16S rRNA served as a housekeeping gene. Agarose gel retardation study was used to confirm the products of PCR. The electrophoretic parameters were 110 V, 200 mA, and 30 minutes. The Maker span was 100–1,500 bp.
Table 1 Sequences of the primers
Biocompatible assay
The simulated body fluid (SBF, Beijing Ding Guo Sheng Biological Technology Co. Ltd, China) test was executed for all specimens suggested by Kokubo.Citation34 The sterilized specimen was put into a 50 mL centrifuge tube, including 20 mL SBF (SBF volume = Ti area/0.05 cm2/mL), and cultured for 7 days at 37°C. Notability, the immersed solution was replaced every day. FE-SEM (S-4800, Hitachi High Technologies, Tokyo, Japan) and energy dispersive X-ray spectrometer EDX (EA 1200VX, Hitachi High Technologies, Tokyo, Japan) were utilized to characterize the specimen surface structure.
MC3T3-E1 cells were seeded on specimen surface at a density of 1×10⁴/well placed in 24-well plates, and cultured for 3 days in α–MEM (Thermo Fisher Scientific) supplemented with 1% penicillin/streptomycin and 10% FBS (Thermo Fisher Scientific) under a 5% CO2 atmosphere at 37°C. After incubation, the cells were rinsed gently 3 times with PBS, and fixed with 4% paraformaldehyde for 15 minutes at 37°C. Afterward, the cells were permeabilized with 0.2% Triton-100. For the actin cytoskeleton, the cells were stained using phalloidin for 60 minutes in the dark at room temperature. For immunofluorescent staining of α-tubulin, after blocking with 5% BSA for 30 minutes at room temperature, the cells were incubated using rabbit monoclonal anti-α-tubulin and goat anti-rabbit antibody, respectively. For the nucleus, the cells were stained by DAPI for 10 minutes in the dark at room temperature. Finally, the samples were tested using a laser scanning confocal microscope (LSCM, NIKON, A1R/A1, Nikon Corporation, Tokyo, Japan). The data (fluorescence intensity, cell area, cell width, and cell length) were analyzed using ImageJ software (Media Cybernetics Inc., Rockville, MD, USA).
Statistical analysis
All data were analyzed using SPSS 17.0 software (SPSS Inc., Chicago, IL, USA), repeated in at least three independent experiments, and presented as mean ± SD. One-way ANOVA was utilized to deal with the data combined with Student–Newman–Keuls post hoc test. P<0.05 was set as statistically significant.
Results
Surface topography characterization
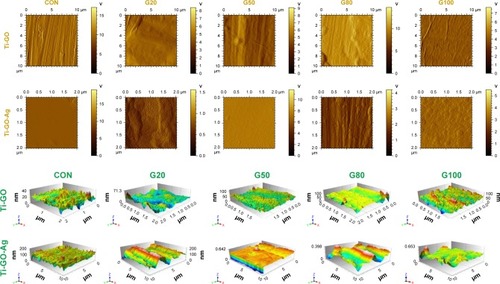
The morphology of the fabricated specimen was examined by atomic force microscope (AFM) (). When GO was loaded onto Ti surface at different concentration under appropriate magnification, some ripple structure of film can be seen. It was in direct proportion to the GO concentration. Before modification, scratches can be seen clearly. When GO was loaded onto Ti surface combined with Ag particles under higher magnification, granular or flaky texture can be observed on the sample surface. Additionally, the specimen surface was smooth and had no marked scratches. By observing the surface profile and roughness, specimens showed ups and downs without any rules or regulation. In GO modification groups, the surface roughness from high to low was G100, G80, G50, G20, and CON, respectively. In addition, the peak heights from high to low were G50, G80, G20, CON, and G100, respectively (, ). There are statistical significances between each group. In GO-Ag modification groups, the surface roughness from high to low were G100, G80, G50, G20, and CON, respectively. In addition, the peak heights from high to low were G80, G50, G100, G20, and CON, respectively (, ). Moreover, there are statistical significances between each group.
Table 2 Measurement of surface roughness of Ti-GO
Table 3 Measurement of surface roughness of Ti-GO-Ag
Figure 1 AFM images showing specimens surface topography.
Note: Yellow represents the 2-dimensional appearance of specimen’s surface; green represents the 3-dimensional appearance of specimen’s surface.
Abbreviations: AFM, atomic force microscope; CON, control.
GO characterization on Ti substrate surface
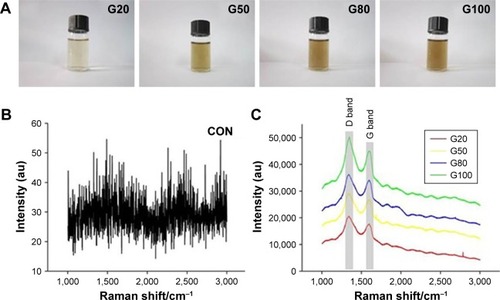
GO utilized to modify Ti surface was characterized by Raman spectroscopy (). There was no obvious characteristic peak on pure Ti surface (). After modifying by GO, the double-peak structure of GO (D band and G band) were detected on specimen surface. D band and G band were located at 1,350 cm−1 and 1,580 cm−1, respectively (). The Y-axis values corresponding to the D and G bands were proportional to the GO concentration. In addition, the higher the concentration of GO, the darker the color of the aqueous solution ().
Figure 2 Features of the specimens characterized by Raman.
Notes: (A) GO aqueous solution. (B) Raman spectrogram of CON. (C) Raman spectrogram of G20, G50, G80, G100.
Abbreviations: CON, control; GO, graphene oxide.
Ag characterization on Ti-GO surface
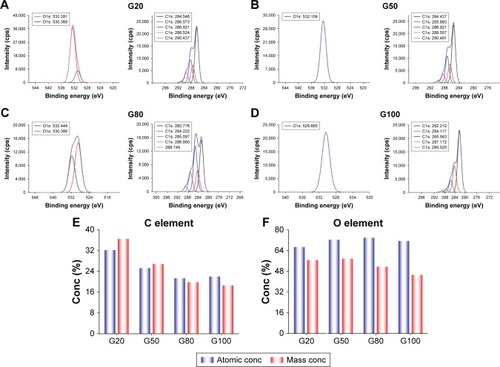
XPS was utilized to analyze the elements valence and content on specimens surface, which were calibrated carbon (C) element (284.8 eV) (). In addition, the data of Ag element has published in our previous study.Citation33 As shown in and oxygen (O) elements of G20 were measured and analyzed. C 1 seconds and O 1 seconds were located to (284.546 eV, 286.073 eV, 286.921 eV, 288.584 eV, 290.437 eV) and (532.281 eV, 530.368 eV), respectively. In fact, the value of the C peak after fitting was 284.5 eV which was 0.3 lower than this of C standard peak (284.8 eV). indicated the data of G50. C 1 seconds and O 1 seconds were located to (284.437 eV, 285.883 eV, 286.921 eV, 288.557 eV, 290.491 eV) and 532.109 eV, respectively. Also, C element fitting peak was 284.4 which was 0.4 lower than that of C standard peak (284.8 eV). In G80, C 1 seconds and O 1 seconds were (282.776, 284.222, 285.097, 286.950, 288.749) and (532.444, 530.389), respectively (). Moreover, C element fitting peak was 282.8 eV that was 2.0 lower than that of C standard peak (284.8 eV). showed that C 1 seconds and O 1 seconds were located to (282.210, 284.117, 285.563, 287.172, 289.025) and 529.665, respectively, and C element fitting peak was 282.2 eV that was 2.6 lower than that of C standard peak (284.8 eV). In addition, C content was inversely proportional to GO concentration and Ag content (). Also, O content seemed to increase first and then decreased ().
Figure 3 XPS spectra for C and O elements on Ti-GO-Ag substrate.
Note: (A) C and O elements of G20, (B) C and O elements of G50, (C) C and O elements of G80, (D) C and O elements of G100, (E) Content of C element, (F) Content of O element.
Abbreviations: conc, concentration; Ti-GO-Ag, titanium-graphene oxide-silver; XPS, X-ray photoelectron microscopy.
Nanoindentation and nanoscratch
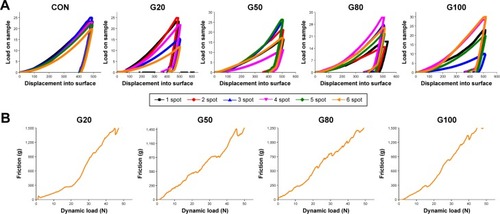
Mechanical properties of GO film were evaluated by nanoindentation and nanoscratch (). As showed in , the fluctuation amplitude of loading force on Ti surface was less, and located between 20–25 mN in CON. Nevertheless, in G20, G50, G80, and G100, the fluctuation amplitude of loading force on Ti-GO surface was located between 10–25 mN, 10–30 mN, 15–30 mN, and 10–30 mN, respectively, which had bigger changes. Especially in G20 and G100, there were still curves missing (only five spots, they were missing green and red respectively). indicated the elastic modulus and Vickers hardness values of the specimen’s surface. The highest elastic modulus was in CON, the lowest in G20. Furthermore, the elastic modulus was proportional to the GO concentration. Certainly, the Vickers hardness data was similar to the elastic modulus results. The highest value was CON, and the lowest was still G20. In addition, there are no statistical differences in each group, except G20 and other groups. The skin-friction force of specimens was investigated (). When the dynamic load force changed from 0 to 15 n, the friction of each group improved with the increase of it. When the dynamic load force altered from 15 to 20 n, the friction force of G100 had the turning point first, followed by G20, while G50 and G80 were still in an increasing trend. When the dynamic load force changed from 20 to 25 n, G80 and G50 also had turning point in succession.
Table 4 Ti-GO surface elastic modulus and Vickers hardness
Figure 4 Mechanical properties test of specimen’s surface.
Notes: (A) The data of nanoindentation in five groups; (B) the data of nanoscratch in four groups.
Abbreviation: CON, control.
Ag release test
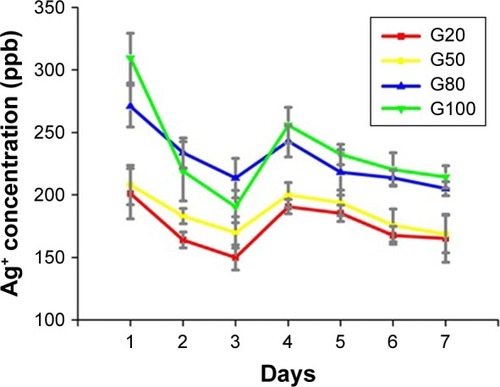
Ag release profiles from Ti-GO-Ag composites surface were measured by ICP-MS (). On the first day, the release of Ag from high to low was G100, G80, G50, and G20, respectively. On the second day, the highest release of Ag was G100, and the lowest release of Ag was G50. On the third day, the highest release of Ag was the same as the second day. The other 3 groups had similar results (G20, G50, and G80). On the fourth day, the release of Ag in the 4 groups increased. Remarkably, the values of G20 and G50, G80 and G100 were close. On the fifth to seventh days, the release of Ag in each group tended to be flat.
Figure 5 Cumulative Ag release profiles from G20, G50, G80, and G100 by dynamic PBS immersion for 7 days.
Abbreviations: Ag, silver; ppb, parts per billion.
Hydrophilic properties of Ti surface before and after modification
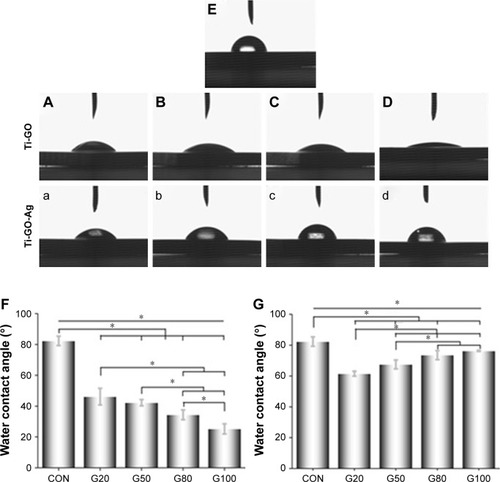
Water contact angle on the surface of the specimens was examined by contact angle tester (). When the deionized water was dropped onto a specimen, it spread differently on the surface. The droplets were flat. Besides, their shape was related to the concentration of GO. In other words, the higher the concentration of GO was, the flatter the droplet shape (). However, in Ti-GO-Ag groups, the droplet shape was closed in a spherical shape, which was similar to CON (). Also, the sphericity of droplet was positively proportional to the Ag content (). There is a statistical difference between all groups, except G20 and G50 in Ti-GO group ().
Figure 6 Water contact angle on specimens.
Notes: (A and a) G20. (B and b) G50. (C and c) G80. (D and d) G100. (E) CON. (F) Water contact angle of Ti-GO groups. (G) water contact angle of Ti-GO-Ag groups. *P<0.05.
Abbreviations: CON, control; Ti-GO-Ag, titanium-graphene oxide-silver.
Microbiological evaluation
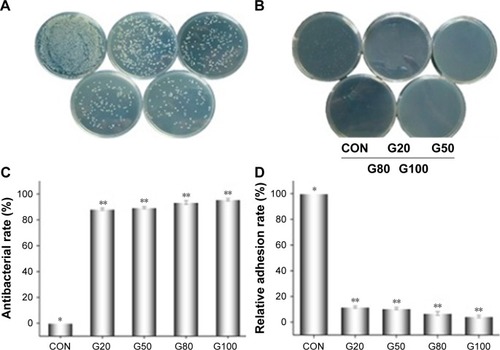
S. aureus and S. mutans were utilized in the antibacterial evaluation on the specimen surface. During the initial 6 hours after implantation, bacteria were easily colonized on the implant surface. Therefore, it was crucial to obtain antimicrobial activity on implant surface. depicted the typical images of re-cultivated S. aureus and after culturing for 24 hours. The bacteria were almost impossible to calculate in CON. In the four experimental groups, the bacterial colonies from high to low were G20, G50, G80, and G100, respectively. showed the representative images of re-cultivated S. mutans after culturing for 24 hours, the data of which was similar to those of S. aureus. In addition, antibacterial effect of S. aureus was quantitatively analyzed. The values from high to low were G100, G80, G50, and G20, respectively (). Also, the results of relative adhesion rates () were in inverse proportion to those of antibacterial effects.
Figure 7 Evaluation of antibacterial property on specimen’s surface of Ti-GO-Ag nanocomposite.
Notes: (A) Typical images of re-cultivated Staphylococcus aureus colonies from the specimens after 24 hours incubation. The upper 3 groups were CON, G20 and G50, respectively. The lower 2 groups were G80 and G100, respectively. (B) Typical images of re-cultivated Streptococcus mutans colonies from the specimens after 24 hours incubation. (C) Antibacterial rate of S. aureus. (D) Relative adhesion rate of S. aureus. *P<0.05, **P<0.001.
Abbreviations: CON, control; Ti-GO-Ag, titanium-graphene oxide-silver.
Morphological and structural assessment
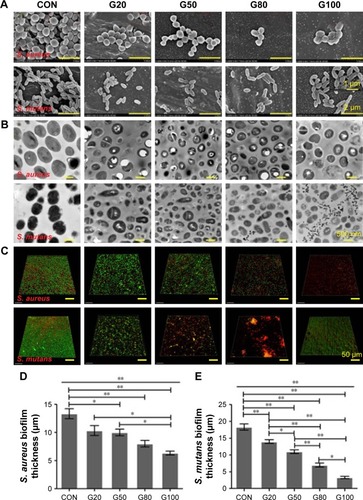
SEM, TEM, and LSCM were utilized to observed bacterial morphology, structure, and biofilm. As showed in , there were different numbers of bacterial colonies on the specimen’s surface after culturing for 24 hours. In CON, there were many bacteria which were full, smooth and complete. In addition, the substrate surface cannot be seen (S. aureus). However, in 4 experimental groups, there were the same bacteria on the surface of the specimens. Their shape had changed in different way, including surface sink and rupture, surface protrusion, irregular shape, bacterial shrinkage, and cytoplasmic leakage, etc. In addition, Ti substrate, GO film, and Ag particles can be observed. showed the structure of bacteria. Bacterial membrane was clear, had integrity, and no deformation. After co-culturing with Ti-GO-Ag substrates for 24 hours, vacuoles, destruction and leakage were observed in the cell structure. Notability, different amounts of Ag particles can be seen around the bacteria, especially in G100. showed the active structure of bacterial biofilm. Green and red fluorescence represented live and dead bacteria, respectively. In CON, there were many dense green fluorescent dots. With increasing GO concentration and Ag content, green fluorescent dots decreased or turned into red fluorescent dots. It was worth noting that there was only stained substrate surface in G100 of S. mutans. By analyzing the bacterial biofilm thickness, it was proportional to GO concentration and Ag content. In addition, there were statistical differences, except CON and G20 of SA, G20 and G50 of SA, G20 and G80 of S. aureus, G50 and G80 of S. aureus, respectively.
Figure 8 Morphological and structural evaluation of bacterial biofilm on specimen’s surface of Ti-GO-Ag nanocomposite.
Notes: (A) Typical morphology of Staphylococcus aureus and Streptococcus mutans using SEM. (B) Typical structure of S. aureus and S. mutans using TEM. (C) Bacterial biofilm using LSCM. (D) S. aureus biofilm thickness. (E) S. mutans biofilm thickness. Green fluorescence represents live bacteria. Red fluorescence is dead bacteria. *P<0.05; **P<0.001.
Abbreviations: CON, control; LSCM, laser scanning confocal microscopy; SEM, scanning electron microscopy; TEM, transmission electron microscope; Ti-GO-Ag, titanium-graphene oxide-silver.
Apoptosis affected by specimens
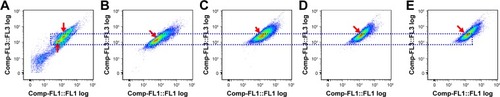
S. aureus apoptosis was tested using live/dead stain reagent via flow cytometry (). As showed in , the blue area was more scattered and can be divided into two regions (lower left and upper right). In addition, there were two orange core regions (shown by red arrows) in upper right. Nevertheless, after co-culturing with different Ti-GO-Ag substrates for 24 hours, the blue areas were more concentrated, with no partitioning in 4 experimental groups. Also, only one orange core region was visible in the blue area (shown by red arrow). In addition, as the concentration of GO increased, the blue areas and core regions gradually moved to the upper right (as shown by blue box) ().
Figure 9 (A) Is the dot plot of staphylococcus aureus incubated on CON surface. (B), (C), (D) and (E) represent the results of G20, G50, G80 and G100, respectively.
Notes: The dotted box represents the baseline of the orange core area. The arrows represent the orange core area.
Abbreviations: CON, control; Ti-GO-Ag, titanium-graphene oxide-silver.
Pathogenic genes expression affected by specimens
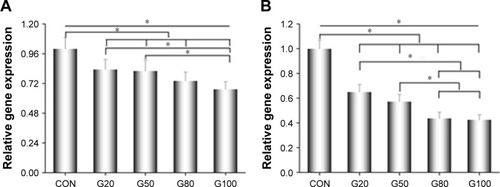
S. aureus pathogenic gene expression level was monitored by RT-PCR (). caL gene expression was shown in . The gene expressions in the experimental groups were lower than that in CON, which were related to GO concentration and Ag content. And the relationship was inversely proportional. There are statistical differences between each group, except G20 and G50, G20 and G80, G50 and G80. nuC gene expression was similar to caL gene (). The difference was that nuC gene expression was lower than caL gene expression. Also, there are statistical differences between each group, except G20 and G50, G80 and G100. In addition, the genes expression of gtfB, gtfC and gtfD have been published.Citation33 The reason why this is shown here is that the results are utilized for the experiment of electrophoretic identification of pathogenic genes.
Figure 10 Pathogenic gene expression of Staphylococcus aureus on specimens surface of Ti-GO-Ag nanocomposite.
Notes: (A) caL; (B) nuC. *P<0.05.
Abbreviations: CON, control; Ti-GO-Ag, titanium-graphene oxide-silver.
Electrophoretic identification of pathogenic genes
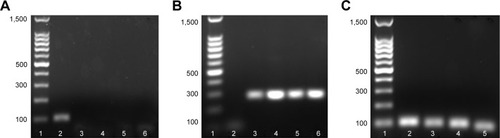
S. aureus and S. mutans pathogenic genes were further confirmed via electrophoresis (). As shown in , caL gene of experimental groups did not appear in lanes 3, 4, 5, or 6. It was remarkable that lanes 1 and 2 were Maker and housekeeper gene. showed the electrophoresis data of nuC. 1 lane was Maker band. First band and third band represented 100 bp and 300 bp, respectively. The brightest band in the middle was 500 bp, and the top of the band represented 1,500 bp. 16S rRNA gene was located at around 100 bp (lane 2). nuC gene appeared in 300 bp or so (lanes 3, 4, 5, and 6). In addition, gtfB, gtfC and gtfD gene expressions were detected by electrophoresis (). They were also located to 100 bp or so. It was just that their bands were lower that 16S rRNA.
Figure 11 Electrophoresis results of Staphylococcus aureus and Streptococcus mutans pathogenic genes.
Notes: (A) caL. 1-Maker; 2-16SrRNA; 3-G20; 4-G50; 5-G80; 6-G100. (B) nuC. 1-Maker; 2-16SrRNA; 3-G20; 4-G50; 5-G80; 6-G100. (C) S. mutans relative genes. 1-Maker; 2-16SrRNA; 3-gtfB; 4-gtfC; 5-gtfD.
Calcium and phosphorus deposition using simulated body fluid
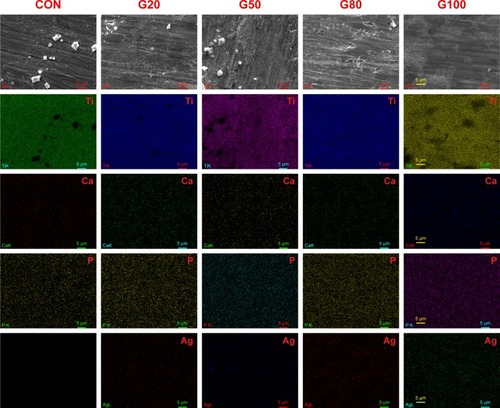
The SBF assay of specimens was executed using FE-SEM after 7 days (). In CON, there were many scratches and some irregular white solid matter on substrate surface. Ti, Ca and P elements were tested via EDX. However, in 4 experimental groups, the scratches can also be seen, but their edge was smoother and more evasive. Ag element was detected by EDX, including Ti, Ca, and P.
Figure 12 FE-SEM images of specimens after immersing SBF (simulated body fluid) solution for 7 days.
Notes: Column 1 was CON. Columns 2, 3, 4, and 5 represented G20, G50, G80 and G100. First line was original images of each group (SEM images). EDX images are in lines 2, 3, 4, and 5.
Abbreviations: CON, control; EDX, energy dispersive X-ray spectrometer; FE-SEM, field emission scanning electron microscopy; SBF, simulated body fluid.
Cell deformation affected by specimens
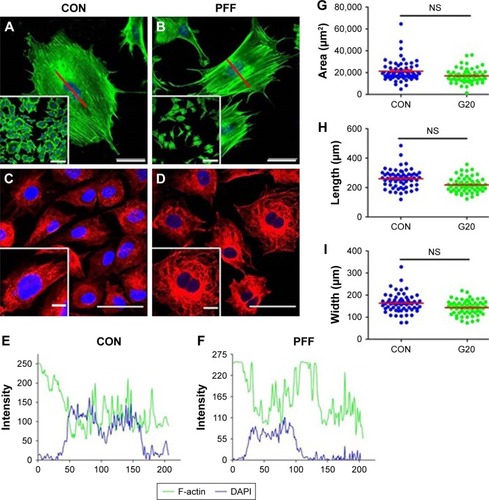
Cells shape and structure were detected by confocal microscope (). As shown in , the cells shape was oval-shaped and polygonal-shaped on CON and G20 substrate surface, respectively. By analyzing the fluorescence intensity, they were located to 125 and 165 or so in CON and G20, respectively (). showed the structure of α-tubulin in CON, which were more aligned. After co-culturing with 20 µg/mL of Ti-GO-Ag, the microtubules were disorganized, and were disorderly centered around the nuclei and pointing in all directions (). By analyzing spreading cells, cell area, length, and width seemed to be reduced by GO and Ag. Actually, there are no statistical differences ().
Figure 13 Confocal images showing morphology, area, length, width and fluorescence intensity of MC3T3-E1 pre-osteoblasts on specimen’s surface.
Notes: Green is F-actin. Blue is nucleus. Red is α-tubulin. (A) Oval-shaped cells in CON. The image inserted in the lower left corner is low magnification: ×20. (B) Polygonal-shaped cell in G20. The image inserted in the lower left corner is low magnification. (C) Structure of α-tubulin in CON. The image inserted in the lower left corner is high magnification. (D) Structure of α-tubulin in G20. The image inserted in the lower left corner is high magnification. (E, F) Fluorescence intensity profiles over single cell, measured along red line in (A, B) the direction from upper left to lower right, respectively; (G–I) The quantification of cell area, length and width in CON and G20.
Abbreviations: CON, control; NS, no statistical differences.
Discussion
The purpose of the present study was to monitor the material characterization and biological properties of pure Ti modified by different concentrations of GO and different contents of Ag. We found that GO and Ag were present on pure Ti surface in the form of films and particles, respectively. Different concentrations of GO can form different substrates, surface topography, and attract a certain amount of Ag nanoparticles onto specimen surface. Afterward, surface properties, bacterial and cell experiments were affected by Ti surface topography. Suggesting GO and Ag changed the biological properties of Ti surface.
In this study, surface roughness of Ti can be affected by GO film and Ag nanoparticles, which was observed via AFM (). The main reason was that the higher the GO concentration, the more GO film was loaded onto specimen surface after voltage. In other words the film wrinkles (shown in G20, G50, G80 and G100 of ) were also more. We have already elucidated clearly to the wrinkles in our previous work.Citation33 Finally the surface roughness was changed. Although a small amount of GO film can make the specimen surface relatively smooth and flat, the surface roughness was increased due to the occurrence of wrinkles. Therefore, the surface roughness of the 4 experiment groups was higher than that of the CON (). After loading Ag particles on specimen surface, the roughness still improved, and was directly proportional to the GO concentration (). The possible reason was that the more GO film on the specimen surface, the more negative charges, and the more Ag ions attract. The Ag particles were evenly distributed on Ti-GO surface, which can increase specific surface area.Citation33 Of course, experimental groups surface roughness were higher than that in CON. In addition, comparing and , they showed that the data were higher in than in , because the results of analysis were carried out under different magnification. Therefore, there was no comparability between them.
GO is usually a golden yellow powder. And its aqueous solution shows different colors depending on the concentration. By means of voltage-control method, GO can be attached to substrate surface, which has been demonstrated by AFM and Raman ( and ). Because there are two characteristic peaks of GO, including D peak and G peak, respectively. Usually, G peak is located to 1,580 cm−1 or so. It is caused by the internal vibration of carbon atoms, which can effectively reflect the number of layers of GO. Also, it is easily affected by stress. However, D peak lies to 1,270–1,450 cm−1 or so, which is caused by unordered vibration. Its specific location is related to the excitation wavelength of the Raman spectrum used.Citation35 In the study, the measured D peak and G peak data were 1,350 cm−1 and 1,587 cm−1 or so, respectively. The results were consistent with Zancanelar’s findings.Citation36 This indicated that loading GO onto specimen surface by voltage-control method had a complete structure and was not destroyed.
Nanoindentation testing is a new mechanical performance based on the traditional Victorinox and Brinell hardness. It uses continuous recording and controlling of the displacement or load data when the indenter is loaded or unloaded on the specimen, and analyzes and outputs the mechanical properties and related data, such as indentation modulus and indentation hardness, etc.Citation37 Alternatively, the relevant mechanical data of specimens can be obtained directly according to the load displacement curve without calculating the area of indentation. In the study, the value of modified Ti was lower than that of pure Ti. It may be that the number of GO layers on the Ti surface was not a single layer, and the connection between the layers was not very tight. However, with the increase of GO content, the elastic modulus and Vickers hardness also improved; probably because GO itself had a high elastic modulus and Vickers hardness. Although there may be a gap between the layers, the increase of GO content slightly enhanced its resistance to external forces (). The reason for testing Vickers hardness is that the Vickers test is easier to obtain than other hardness tests. The Vickers test is utilized to test all metals and has one of the widest scales among hardness tests. In addition, 1 spot was missing in G20 and G100. This was probably because part of the GO film did not adhere to the Ti surface, and the nanoindentation tester only detected this area. In the process of testing the bonding force of the GO film and Ti sheet, the parameter specifications were as follows: loading speed: 50 N/m, dynamic load: 50 n, scratch length: 5 mm, reciprocating: 1, static pressure timing: 1 second, measurement method: sound and friction, operation mode: dynamic load, scratch mode: one way scratch. The nanoscratch test data indicated that the experimental conditions of G50 and G80 were favorable for the binding of GO and Ti substrate, probably because there is an electrostatic adsorption between GO sheets in a certain range of concentrations (50–80 µg/mL), except voltage loading. In G20, GO film may be too thin and brittle. In G100, GO film may be too thick. They may be the cause of the decrease in bonding force. The turning point meant that the GO film was broken. In addition, during the test only one test curve appeared and the red line represented it had no signal. The possible reason was that the GO film on Ti surface was thinner (less than 1 µm) or thicker than 100 µm. Another reason may be that GO had a poor toughness after voltage loading.
One of the antibacterial mechanisms of Ag ions is the release of Ag ions, which hinders DNA replication and ATP synthesis, including the toxic effects on eukaryotic cells. Therefore, the release of Ag ions in Ti-GO-Ag composite was measured by ICP-MS for 7 days. It can be seen from the Ag ion release curve that the release amount was not highest on the first day. Also, each sample curve was not blindly reduced. They all had similar patterns. It was worth noting that the release of Ag ions in each group was similar on the fourth day (). The reason was that Ag nitrate was not only loaded onto the Ti-GO surface by ultraviolet reduction, but also entered the inside of GO film, which was demonstrated by our previous study.Citation33 The reason for this phenomenon may be the gap between GO layers or the GO negative charge. According to the release curve of Ag ions, the maximum release of Ag ions was 0.34 ppm, which was much lower than the concentration (1.6 ppm) at which the human body exhibited cytotoxicity to Ag ions.Citation38 In addition, the issue of Ag ion accumulation has to be considered, which is the field we need to focus on and study in the future. In fact, if humans take a small amount of Ag orally every day, only a small portion will be absorbed into the blood by the intestines and bound to plasma proteins.Citation39 Most of the Ag will be excreted by the liver.Citation39 The rest of the Ag is stored and accumulated in organs or tissues without any use.Citation39 Conversely, GO film may also slow down the release of Ag ions.
The hydrophilicity of GO is closely related to its structure and content, which contains a large number of hydroxyl, carboxyl, carbonyl, epoxy and lactones. These functional groups have a great affinity for water molecules. In addition, GO is 1.4 Å atomic graphene spacing and has a reserved honeycomb structure.Citation40 This space can also accommodate water molecules. In the study, the hydrophilicity of Ti surface was also influenced by GO concentration and Ag content (), because GO included a large amount of oxygen-containing functional groups, which had affinity for water molecules. Afterward, when the Ti-GO surface was loaded by Ag particles, the hydrophilicity of its surface decreased. The possible reason was that Ag particles were bonded to the oxygen-containing functional groups in the GO structure, which reduced the oxygen-containing functional group structure. Or Ag particles blocked the honeycomb structure of GO, making it unable to contain or absorb more water molecules.
At present, the antibacterial properties of GO are still controversial. He et alCitation41 fabricated GO sheet and co-cultured with S. mutans, Porphyromonas gingivalis and Actinobacillus actinomycetes, showing good antibacterial properties. In addition, the higher the GO concentration, the stronger the antibacterial property.Citation42,Citation43 Ruiz et alCitation44 showed that GO had no antibacterial activity, but was beneficial to bacterial adhesion, growth, reproduction, and formation of bacterial biofilm. In the study, different concentrations of GO (20 µg/mL, 50 µg/mL, 80 µg/mL, 100 µg/mL) were loaded onto the Ti substrate surface and co-cultured with S. aureus for 4 hours and 12 hours, respectively, indicating that there may be no antibacterial properties. On the contrary, they likely promoted bacterial adhesion and growth (), which was consistent with Ruiz et al’s results.Citation44 When Ti substrate was modified by GO and Ag particles, the antibacterial rate and adhesion rate of each group were different (). Certainly, they also had good antibacterial activity against S. mutans (). The main reason was that Ag particles on Ti-GO surface played an important role in the antibacterial aspect. During 24 hours of co-culturing of bacteria and Ti-GO-Ag, firstly, Ag ions were released from Ti-GO surface, migrated in the culture medium, and entered bacterial interior. Secondly, Ag ions gathered in bacterial cells. The first and second steps caused oxidative stress,Citation33 shrinkage or surface protrusion in bacteria (). Thirdly, the aggregated Ag ions caused bacterial cell to perforate and form vacuoles. Fourthly, bacterial cytoplasm and Ag ions were leaked into culture medium. The third and fourth steps led to bacterial rupture and death ( and 15). By staining the live/dead bacteria reagent, it was known that the bacterial biofilm activity on the specimens surface was affected by GO and Ag ions (). Especially in G100, the specimen surface topography can be observed clearly. Probably because the G100 surface contained more GO which had negative charge. And the dye molecules in the reagent may be partly positively charged, causing the positive and negative charges to attract, thus leading to stain. Conversely, GO contained a large number of hydroxyl group, carboxyl group, carbonyl group, etc, which were highly hydrophilic properties and reacted with certain components in the dyeing solution.
Figure 14 FE-SEM images of Staphylococcus aureus on specimen’s surface for 4 hours and 12 hours.
Notes: The upper five images are co-cultured for 4 hours (magnification: ×5,000). The lower five images are co-cultured for 12 hours (magnification: ×1,000).
Abbreviations: CON, control; FE-SEM, field emission scanning electron microscopy.
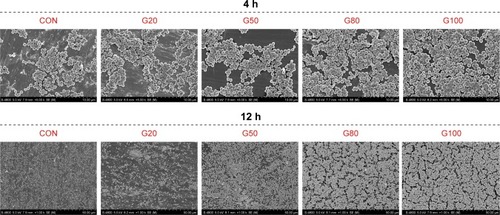
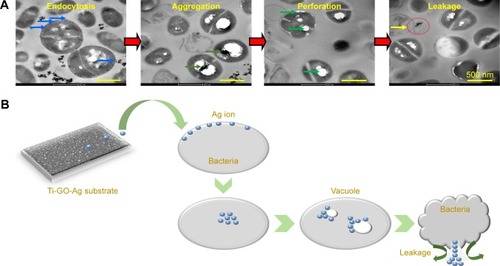
Figure 15 Mechanism of killing bacteria by Ti-GO-Ag.
Notes: (A) TEM images showing bacterial cell destroyed by Ag ions. Blue arrow: Ag moving; orange arrow: Ag gathering; green arrow: perforation; yellow arrow: leakage. (B) Diagram based on A.
Abbreviations: TEM, transmission electron microscope; Ti-GO-Ag, titanium-graphene oxide-silver.
Flow cytometry results did not show significant partitioning, such as active area, early withered area, late withered area, and necrotic area. But comparing with the CON, the fluorescent region still changed obviously (). Combining the fluorescence intensity represented by X-axis and the number of bacteria represented by Y-axis, the fluorescence intensity of bacteria gradually increased (G100. G80. G50. G20. CON). Through the data from antibacterial rate, FE-SEM, TEM and LSCM, the change of fluorescent region was the reduction or death of bacteria. When S. aureus invades the body, it produces plasma coagulase (caL), which acts to coagulate or accumulate fibrin in plasma or blood on the bacterial cell surface, preventing it from being phagocytized or cleared by bacteria. In general, this enzyme mainly exists in pathogenic S. aureus, so the detection of caL is one of the main markers of pathogenicity in S. aureus.Citation45 In this study, the presence of caL was detected by primer design and RT-PCR analysis, indicating that ATCC25923 S. aureus was pathogenic. Heat-resistant nuclease (nuC) is a unique gene of S. aureus, which is highly conserved among different strains of S. aureus (). This study detected the presence of nuC gene, showing that this strain was a standard strain of S. aureus (). The main function of leucocidin (pvL) is to form perforations on bacterial cell membrane surface, allowing the cytoplasmic contents to leak, thereby causing the cells to die. The existence of pvL gene was not tested in this study. This was consistent with Labandeira et al’s findings.Citation46 RT-PCR detection products were analyzed by electrophoresis, indicating that the nuC gene was displayed in the band (), while the caL gene was not shown (). The reason was that the primers detected by RT-PCR were small fragments. The preferred length was 100 bp or so, generally not >400 bp. In the study, the nuC gene fragment length was 279 bp. Compared with Maker, the nuC gene fragment appeared at about 300 bp, which further proved the accuracy of RT-PCR analysis. In addition, the three pathogenic genes of gtfB, gtfC and gtfD carried by S. mutans were all well expressed. By comparing with Maker, the fragment lengths of gtfB, gtfC and gtfD were<100 bp (). In fact, their lengths were 98 bp, 93 bp, and 83 bp respectively, which further explained the accuracy of RT-PCR results.
In vitro, the ability of the material to deposit apatite can be investigated by soaking in SBF, which indirectly affects its bioactivity in vivo. In this study, the specimens were immersed in SBF for 7 days, and the surface was deposited with irregular particles by FE-SEM (). Through partial surface scanning analysis, calcium and phosphorus existed on the specimen’s surface, indicating that the composite coating had certain biological activity and biomineralization ability. It is well known that Ti has good biocompatibility. Of course, the appropriate concentration and content of GO and Ag also have biological activity, demonstrated by our previous study,Citation33 which was why the Ti-GO-Ag nanocomposite surface can be deposited by calcium and phosphorus.
In our previous study, the cell viability of Ti-GO-Ag four concentrations were investigated, showing that the cell viability of G20 was better than G50, G80, and G100.Citation33 That is why we only test G20 and CON. Although the cell shape of G20 was different from that of CON, there is no statistical difference (). Possibly because GO and Ag ions stimulated cells to undergo oxidative stress which influenced cell structure and function. For example, micro-tubule structures were disordered around the nucleus. There was aggregation or disaggregation in the cells. In addition, oxidative stress enhanced the fluorescence intensity of F-actin which was closely related to cell adhesion, migration, and proliferation.Citation47
The C 1 second and O 1 second XPS spectra data of the Ti-GO-Ag composite were shown in . The binding energy of the C–H or C–C bonding was assigned at 284.5 eV–285 eV. Chemical shifts of +1.5 eV, +2.5 eV, and +4.0 eV, became typical of the C–OH (286 eV–286.5 eV), C=O (287 eV–287.5 eV), O=C–OH (288 eV–288.5 eV) function groups, respectively.Citation47–Citation49 Certainly, C–O–C was also included in GO structure, and similar to C–OH functional group.Citation50,Citation51 In G20, C 1 second and O 1 second peaks were chemical shifts of 0.3 eV (284.8–284.5 eV). There were 284.846 eV, 286.373 eV, 287.221 eV, 288.884 eV, 290.737 eV, and 532.581 eV, 530.668 eV, respectively. Comparing to the typical function groups, they were C–C, C–OH, C=O, O=C–OH, respectively. There was a small peak at 290.737 eV in . In fact, we did not know how to define this peak, possibly because it was affected by Ag ion via the ultraviolet reduction method. The main peak of O 1 second was located to 532.281 eV which was provided by C–OH. The small peak (530.668 eV) was contributed from C=O and O=C–OH.Citation50 The data of C 1 second in G50 and G80 were similar to that of in G20. Chemical shifts of +0.4 eV (284.4–284.8) and +2.0 eV (282.8 eV–284.8 eV) were typically assigned for the functional groups (C–C, C–OH, C=O, O=C–OH), respectively. O 1 second was also mainly derived from C–OH (530 eV or so). Notability, in G80, there was a small peak of O 1 second located to 532.444 eV. Also we did not know what functional group to assign it to. Afterward, in G100, chemical shift of +2.6 eV (282.2 eV–284.8 eV) was analyzed in C 1 second and O 1 second spectra. Functional groups only contained C–C (284.810 eV), C–OH (286.717 eV), and O=C–OH (288.163 eV), except C=O, but there were another two peaks, including 289.772 eV and 291.625 eV. We did not know what functional groups to assign to them as well. In addition, O 1 second peak was a single peak, also contributed from C–OH (532.265 eV). The above data demonstrated that the concentration of GO had a greater impact on the experimental results.
Conclusion
In summary, GO and Ag changed pure Ti surface topography, which affected the material and biological properties. Therefore, we conclude that GO different concentration and Ag particles increase Ti surface roughness, then affect surface hydrophilic property. This surface topography can influence bacterial viability and change cell structure. This suggests that proper concentration of Ti-GO-Ag composite material has a two-way function of antibacterial and high biological activity, stimulates bone formation, reduces peri-implantitis, and improves the success rate of implant surgery.
Acknowledgments
This work was supported financially by the National Natural Science Foundation of China (Nos 81530051, 81771069).
Disclosure
The authors report no conflicts of interest in the work.
References
- SchwarzFDerksJMonjeAWangHLPeri-implantitisJ Clin Periodontol201845Suppl 20S246S26629926484
- LangNPBerglundhTWorking Group 4 of Seventh European Workshop on PeriodontologyPeriimplant disease: where are we now? – Consensus of the seventh European workshop on periodontologyJ Clin Periodontol201138Suppl 1117818121323713
- SanzMChappleILWorking Group 4 of the VIII European Workshop on PeriodontologyClinical research on peri-implant diseases: consensus report of working group 4J Clin Periodontol201239Suppl 1220220622533957
- JepsenSBerglundhTGencoRPrimary prevention of peri-implantitis: managing peri-implant mucositisJ Clin Periodontol201542Suppl 16S152S15725626479
- RenvertSRoos-JansåkerAMLindahlCRenvertHRutger PerssonGInfection at titanium implants with or without a clinical diagnosis of inflammationClin Oral Implants Res200718450951617517058
- MombelliAvan OostenMASchürchELandNPThe microbiota associated with successful or failing osseointegrated titanium implantsOral Microbiol Immunol1987241451513507627
- FürstMMSalviGELangNPPerssonGRBacterial colonization immediately after installation on oral titanium implantsClin Oral Implants Res200718450150817501978
- BreugemSJMLinnartzJSiereveltIBruijnJDDriessenMJMEvaluation of 1031 primary titanium nitride coated mobile bearing total knee arthroplasties in an orthopedic clinicWorld J Orthop201781292292829312851
- WheelisSEWilsonTGValderramaPRodriguesDCSurface characterization of titanium implant healing abutments before and after placementClin Implant Dent Relat Res201820218019029214721
- QinHCaoHZhaoYIn vitro and in vivo anti-biofilm effects of silver nanoparticles immobilized on titaniumBiomaterials201435339114912525112937
- CaoHLiuXMengFChuPKBiological actions of silver nanoparticles embedded in titanium controlled by micro-galvanic effectsBiomaterials201132369370520970183
- KimJSKukEYuKNAntimicrobial effects of Ag nanoparticlesNanomedicine2007319510117379174
- SondiISalopek-SondiBSilver nanoparticles as antimicrobial agent: a case study on E. coli as a model for Gram-negative bacteriaJ Colloid Interface Sci2004275117718215158396
- FengQLWuJChenGQCuiFZKimTNKimJOA mechanistic study of the antibacterial effect of silver ions on Escherichia coli and Staphylococcus aureusJ Biomed Mater Res200052466266811033548
- MoronesJRElechiguerraJLCamachoAThe bactericidal effect of silver nanoparticlesNanotechnology200516102346235320818017
- ShrivastavaSBeraTRoyASinghGRamachandraraoPDashDChar-acterization of enhanced antibacterial effects of novel silver nanoparticlesNanotechnology20071822225103
- WangGJinWQasimAMAntibacterial effects of titanium embedded with silver nanoparticles based on electron-transfer-induced reactive oxygen speciesBiomaterials2017124253428182874
- YanYZhangXMaoHHuangYDingQPangXHydroxyapatite/gelatin functionalized graphene oxide composite coatings deposited on TiO2 nanotube by electrochemical deposition for biomedical applicationsAppl Surf Sci20153297682
- BijuVChemical modifications and bioconjugate reactions of nanomaterials for sensing, imaging, drug delivery and therapyChem Soc Rev201443374476424220322
- ParkKOLeeJHParkJHGraphene oxide-coated guided bone regeneration membranes with enhanced osteogenesis: spectroscopic analysis and animal studyAppl Spectrosc Rev2016517–9540551
- NayakTRAndersenHMakamVSGraphene for controlled and accelerated osteogenic differentiation of human mesenchymal stem cellsACS Nano2011564670467821528849
- RosaVXieHDubeyNGraphene oxide-based substrate: physical and surface characterization, cytocompatibility and differentiation potential of dental pulp stem cellsDent Mater20163281019102527283997
- ZhouQYangPLiXLiuHGeSBioactivity of periodontal ligament stem cells on sodium titanate coated with graphene oxideSci Rep2016611934326763307
- AkhavanOGhaderiEToxicity of graphene and graphene oxide nanowalls against bacteriaACS Nano20104105731573620925398
- HuWPengCLuoWGraphene-based antibacterial paperACS Nano2010474317432320593851
- LiuSZengTHHofmannMAntibacterial activity of graphite, graphite oxide, graphene oxide, and reduced graphene oxide: membrane and oxidative stressACS Nano2011596971698021851105
- RuizONFernandoKAWangBGraphene oxide: a nonspecific enhancer of cellular growthACS Nano20115108100810721932790
- YangKLiYTanXPengRLiuZBehavior and toxicity of graphene and its functionalized derivatives in biological systemsSmall201399–101492150322987582
- YinSGoldovskyYHerzbergMFunctional free-standing graphene honeycomb filmsAdv Funct Mater2013232329722978
- WilsonTGValderramaPBurbanoMForeign bodies associated with peri-implantitis human biopsiesJ Periodontol201586191525224174
- FretwurstTBuzanichGNahlesSWoelberJPRiesemeierHNelsonKMetal elements in tissue with dental peri-implantitis: a pilot studyClin Oral Implants Res20162791178118626508041
- OlmedoDGNalliGVerdúSPaparellaMLCabriniRLExfoliative cytology and titanium dental implants: a pilot studyJ Periodontol2013841788322414261
- JinJZhangLShiMZhangYWangQTi-GO-Ag nanocomposite: the effect of content level on the antimicrobial activity and cytotoxicityInt J Nanomedicine2017124209422428652728
- KokuboTSurface chemistry of bioactive glass-ceramicsJ Non Cryst Solids19901201–3138151
- ThomsenCReichSDouble resonant Raman scattering in graphitePhys Rev Lett200085245214521711102224
- ZancanelaDCSimãoAMFranciscoCGGraphene oxide and titanium: synergistic effects on the biomineralization ability of osteoblast culturesJ Mater Sci Mater Med2016274717826886819
- PharrGMOliverWCBrotzenFROn the generality of the relationship among contact stiffness, contact area, and elastic modulus during indentationJ Mater Res1992703613617
- BellantoneMWilliamsHDHenchLLBroad-spectrum bactericidal activity of Ag(2)O-doped bioactive glassAntimicrob Agents Che-mother200246619401945
- HardesJAhrensHGebertCLack of toxicological side-effects in silver-coated megaprostheses in humansBiomaterials200728182869287517368533
- EricksonKErniRLeeZAlemNGannettWZettlADetermination of the local chemical structure of graphene oxide and reduced graphene oxideAdv Mater201022404467447220717985
- HeJZhuXQiZKilling dental pathogens using antibacterial graphene oxideACS Appl Mater Interfaces2015795605561125705785
- LiuSZengTHHofmannMAntibacterial activity of graphite, graphite oxide, graphene oxide, and reduced graphene oxide: membrane and oxidative stressACS Nano2011596971698021851105
- MaJZhangJXiongZYongYZhaoXSPreparation, characterization and antibacterial properties of silver-modified graphene oxideJ Mater Chem2011211033503352
- RuizONFernandoKAWangBGraphene oxide: a nonspecific enhancer of cellular growthACS Nano20115108100810721932790
- WellerTMMethicillin-resistant Staphylococcus aureus typing methods: which should be the International standard?J Hosp Infect200044316017210706798
- Labandeira-ReyMCouzonFBoissetSStaphylococcus aureus Panton–Valentine leukocidin causes necrotizing pneumoniaScience200731558151130113317234914
- YangMFanZWangFBMP-2 enhances the migration and proliferation of hypoxia-induced VSMCs via actin cytoskeleton, CD44 and matrix metalloproteinase linkageExp Cell Res2018368224825729750899
- ChiangTCSeitzFPhotoemission spectroscopy in solidsAnnalen der Physik2001101–26174
- YumitoriSCorrelation of C1s chemical state intensities with the O1s intensity in the XPS analysis of anodically oxidized glass-like carbon samplesJ Mater Sci2000351139146
- YangDVelamakanniABozokluGChemical analysis of graphene oxide films after heat and chemical treatments by X-ray photo-electron and micro-Raman spectroscopyCarbon2009471145152
- XieYSherwoodPMAX-ray photoelectron-spectroscopic studies of carbon fiber surfaces. Part IX: the effect of microwave plasma treatment on carbon fiber surfacesAppl Spectrosc198943711531158