Abstract
Growth characteristics of human connective tissue progenitor (CTP) cells were investigated on smooth and textured substrates, which were produced using MEMS (microelectromechanical systems) fabrication technology. Human bone marrow derived cells were cultured for 9 days under conditions promoting osteoblastic differentiation on polydimethylsiloxane (PDMS) substrates comprising smooth (non-patterned) surfaces (SMOOTH), 4 different cylindrical post micro-textures (POSTS) that were 7–10 μm high and 5, 10, 20, and 40 μm diameter, respectively, and channel micro-textures (CHANNELS) with curved cross-sections that were 11 μm high, 45 μm wide, and separated by 5 μm wide ridges. Standard glass-tissue culture surfaces were used as controls. Micro-textures resulted in the modification of CTP morphology, attachment, migration, and proliferation characteristics. Specifically, cells on POSTS exhibited more contoured morphology with closely packed cytoskeletal actin microfilaments compared to the more random orientation in cells grown on SMOOTH. CTP colonies on 10 μm-diameter POSTS exhibited higher cell number than any other POSTS, and a significant increase in cell number (442%) compared to colonies on SMOOTH (71%). On CHANNELS, colonies tended to be denser (229%) than on POSTS (up to 140% on 10 μm POSTS), and significantly more so compared to those on SMOOTH (104%).
Introduction
Bone grafting is a common tissue engineering therapy that is increasingly used worldwide (1999; CitationBauer and Muschler 2000). It is a surgical procedure by which new bone or a replacement material is placed into spaces between or around bones to: (a) stimulate healing of fractures that have failed to heal; (b) promote healing between two bones across a diseased joint; (c) regenerate bone that is lost due to trauma, infection, or disease; and (d) improve bone formation around surgically implanted devices (2005). Bone graft materials may be categorized into autografts (tissue harvested from the host), allografts (tissue from donor of same species), xenografts (tissue from donor of different species), and other synthetic or natural materials such as hydroxyapatite, coral material, or collagen (CitationBauer and Muschler 2000). Cancellous bone autografts are considered to be the most effective bone graft (CitationSchimandle and Boden 1997; CitationFleming, Cornell et al 2000), and have been shown to achieve optimum skeletal incorporation in spinal fusion, bone defects, and fracture repair (CitationMuschler, Nitto et al 2003; CitationTsang and Bhatia 2004). Currently, cancellous bone autografts are used in ∼50% of the 500,000 bone grafting procedures performed annually in the United States (1999; CitationMuschler, Nitto et al 2003; CitationTsang and Bhatia 2004), and are most commonly used in Europe’s ∼400,000 annual bone graft procedures (2003). However, autografts bring a number of related problems such as surgical scars, blood loss, pain, prolonged surgical time, prolonged rehabilitation, increased exposure to blood products, and infection risk (CitationMuschler, Nitto et al 2003). In contrast, allografts are used in ∼43% of the bone graft procedures in the United States (1999), but exhibit a higher degree of immune reaction and lower osteogenic properties than autografts. Therefore, there is an increasing need for an alternative bone graft that can provide the osteogenic properties of autografts while avoiding their related complications.
A current state of the art alternative to autograft is the use of connective tissue progenitor cells (CTPs), isolated from the bone marrow of the patient, in combination with a three-dimensional (3D) biodegradable scaffold (CitationSalgado, Coutinho et al 2004). This approach involves a rapid intra-operative procedure for the concentration and selection of the CTP population from bone marrow into the graft using selective attachment to a matrix surface. The 3D scaffold provides the necessary environment for the patient’s CTPs to migrate, proliferate, and differentiate into bone forming cells within the fracture or diseased site. In vivo, this approach has been demonstrated to improve graft efficacy (CitationMuschler, Nitto et al 2003). In vitro, CTPs can be assayed and cultured under specific biochemical conditions that promote osteoblastic differentiation (CitationMajors, Boehm et al 1997; CitationMuschler, Boehm et al 1997). A single CTP from a fresh bone marrow sample gives rise to one colony of osteoblasts (CitationMuschler, Boehm et al 1997). The number of cells in the colony formed can provide an assay of proliferation, and the distribution of cells within a colony provides an indirect assay of relative migration. Successful bone healing requires the presence of a sufficient number of CTPs (CitationMuschler, Nitto et al 2001) to adhere, proliferate, and organize extracellular matrix molecules into a functional tissue (CitationMuschler, Boehm et al 1997). Unfortunately, CTPs represent a small fraction of cells in normal bone marrow (<1:20,000), and their abundance is almost certainly suboptimal in early fracture repair, and more especially so in older patients, smokers, and post-menopausal women (CitationMajors, Boehm et al 1997; CitationMuschler, Nitto et al 2001).
At the cell-scaffold interface, both an appropriate physicochemical environment and an idoneous surface topography (CitationKapur, Spargo et al 1996) profoundly affect the overall behavior of the engineered tissue. The presence of surface topographies at the cellular size scale has been reported to influence cell shape and modify gene activity (CitationBrunette and Chehroudi 1999). Consequently, the incorporation of engineered micro- and nanoscale topographies onto the scaffold surface could provide an attractive approach to selectively enhance specific and desirable cell behaviors without destabilizing the delicate biochemical environment.
To address the need for precise and controlled cell guidance, there has been increased interest in the application of MEMS (microelectromechanical systems) and nanotechnology strategies to tissue engineering. These technologies closely parallel the multidimensional size scale of living cells, and therefore might be exploited to provide tissue engineering scaffolds that possess topographical, spatial, and chemical properties to optimize control over cell behavior (CitationDesai 2000). Microfabrication and micromachining techniques associated with MEMS technology has been used to create two dimensional (2D) substrates with micro-textures (surface topography with defined dimensions and distributions) such as posts (CitationSchmidt and von Recum 1992; CitationGreen, Jansen et al 1994; CitationCraighead, Turner et al 1998; CitationDeutsch, Motlagh et al 2000) and channels (CitationBrunette 1986; CitationBrunette 1986; Citationden Braber, Ruijter et al 1995; Citationden Braber, Ruijter et al 1996; Citationden Braber, Ruijter et al 1996; CitationCurtis and Wilkinson 1997; Citationden Braber, Ruijter et al 1998; Citationvan Kooten, Whitesides et al 1998; CitationBrunette and Chehroudi 1999; CitationAlaerts, De Cupere et al 2001) to investigate cell behavior in vitro. Many of these investigations (CitationGreen, Jansen et al 1994; Citationden Braber, Ruijter et al 1995; Citationden Braber, Ruijter et al 1996; Citationden Braber, Ruijter et al 1996; Citationden Braber, Ruijter et al 1998; Citationvan Kooten, Whitesides et al 1998; CitationDeutsch, Motlagh et al 2000) have used polydimethylsiloxane (PDMS) as the substrate material for their cell culture experiments.
We are examining the influence of surface micro-textures on growth characteristics for ultimate application in scaffold design for bone tissue engineering (CitationMata, Boehm et al 2002; CitationMata, Boehm et al 2002; CitationMata, Fleischman et al 2004). Specifically, human bone marrow cells containing CTPs are harvested, isolated, and cultured on 2D PDMS substrates comprising smooth surfaces as well as channel and post micro-textures. A primary advantage of PDMS is its chemical inertness, which permits isolation of the effect of surface micro-textures on cell behavior from other surface (chemistry) effects. The proliferation and migration attributes of CTPs on micro-textured PDMS substrates in vitro should provide insight into CTP behavior in vivo as well as the potential for selective stimulation by topographies incorporated onto the scaffold surface. This paper reviews and extends our previous work (CitationMata, Boehm et al 2002; CitationMata, Boehm et al 2002; CitationMata, Fleischman et al 2004) by incorporating the latest results from recent experiments and updated analyses.
Material and methods
Experimental design
Bone marrow derived CTPs were cultured on PDMS substrates comprising smooth (non-patterned) surfaces (SMOOTH), 4 different cylindrical post micro-textures (POSTS) that were 7–10 μm high and 5, 10, 20, and 40 μm diameter, respectively, and channel micro-textures (CHANNELS) with curved cross-sections that were 11 μm high, 45 μm wide, and separated by 5 μm wide ridges. The textured PDMS substrates were created using microfabrication and micromachining techniques. The primary advantage of using PDMS as the substrate material is its chemical inertness characteristic, which permits isolation of the physical effect of surface micro-textures on cell behavior from other surface effects. Fresh bone marrow derived cells were plated on the substrates, cultured for 9 days, fixed, analyzed using light, fluorescent, confocal, time-lapse, and scanning electron microscopy, and tested for differentiation using in situ staining for alkaline phosphatase activity. Each experiment was repeated three times and the results were compared to those from cells grown on standard glass tissue culture dishes that served as controls.
Substrate preparation
The various PDMS substrates were produced by a process based on Soft Lithography (CitationXia and Whitesides 1998). The fabrication of the micro-textured posts and channels is schematically depicted in and detailed below.
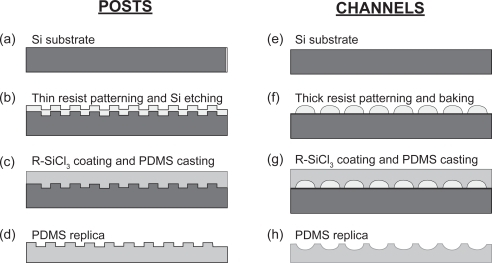
Figure 1 Fabrication of micro-textured POSTS (a–d) and CHANNELS (e–h) polydimethylsiloxane (PDMS) substrates by Soft Lithography. The cross-sectional schematic diagrams for POSTS depict: (a) starting substrate, which is a 100 mm-diameter, (100)-oriented silicon (Si) wafer; (b) patterned Si master, which has been processed by microfabrication and micromachining techniques and coated with a fluorinated alkyltrichlorosilane (R-SiCl3) to facilitate mold release; (c) molding of PDMS by casting; and (d) release of PDMS cast from Si master. The cross-sectional schematic diagrams for CHANNELS depict: (e) starting substrate, which is a 100 mm-diameter, (100)-oriented Si wafer; (f) thick photoresist coating patterned by photolithography, and rounding of pattern edges due to reflow of photoresist during baking; (g) molding of PDMS by casting onto patterned master after coating with a fluorinated R-SiCl3 to facilitate mold release; and (h) release of PDMS cast from master.
Posts surfaces ()
A 1.3 μm-thick layer of photoresist was coated on top of a 100 mm-diameter, (100)-oriented silicon wafer that had been previously oxidized to grow a 1.5 μm-thick SiO2 layer. Photolithography was then used to transfer the different texture patterns from a photomask onto the photoresist. Afterwards, the SiO2 layer was etched using buffered oxide etchant (BOE) to create a patterned mask for selective removal of the silicon substrate by reactive ion etching (RIE). The silicon substrate was etched to a depth of 7–10 μm to create the master for subsequent PDMS molding. The patterned wafer was then coated with 1H, 1H, 2H, 2H-Perfluorodecyltrichlorosilane (Lancaster, Pelham, NH) to aid the PDMS release. The liquid PDMS base and curing agent (Sylgard 184) (Dow Corning, Midland, MI) components were mixed in a ratio of 10:1, degassed for 7 minutes, and then poured uniformly on top of the patterned master. After additional degassing for 12 minutes, the PDMS on the patterned silicon was cured at 65 °C for 3 hours and at room temperature (∼25 °C) for 21 hours. The cured PDMS cast was released from the master and sectioned into 1 cm × 1 cm samples. Four different micro-textures were realized on the PDMS substrates comprising posts that were 7–10 μm high and 5, 10, 20, 40 μm diameter, respectively. The separation between posts on a given substrate was equal to the corresponding post diameter.
Channels surfaces ()
An 11 μm-thick layer of photoresist (AZ-9260, AZ Electronic Materials, Somerville, NJ) was coated on top of a standard 100 mm-diameter, (100)-oriented silicon wafer. Photolithography was then performed to transfer straight channel patterns from a photomask to the coated photoresist. The reflow of the photoresist during the final bake step (115 °C for 30 minutes) of the photolithography process resulted in rounding of the edges of photoresist patterns. This patterned photoresist on the silicon wafer constituted the master for subsequent PDMS molding. The PDMS casting process was the same as that used for the POSTS textures. The cured PDMS cast was released from the master and sectioned into 1 cm × 1 cm samples with curved channels that were nominally 11 μm high and 45 μm wide. The micro-channels were separated by ridges that were flat and 5 μm wide at the top and offset at maximum of 50° from the channel wall.
Smooth surfaces
The SMOOTH PDMS surfaces were created using the same process as the one used for both POSTS and CHANNELS, except that the silicon master was a bare silicon wafer. The cured PDMS substrates were released from the silicon wafers and cut into 1 cm × 1 cm samples to obtain PDMS substrates with smooth surfaces.
Representative surfaces of POSTS, CHANNELS, and SMOOTH were inspected for defects by scanning electron microscopy (SEM) (JSM-5310, JEOL USA, Peabody, MA) before and after sterilization in ethanol as described in the next section.
Cell culture
Cell culture experiments were conducted on the various PDMS substrates. The investigations included: (a) quantification of cell number, cell number/colony, colony density, cell alignment, and colony aspect ratio; (b) cell staining for actin cytoskeleton, cell nuclei, and focal adhesions as well as cell height quantification; (c) DNA transfection for live viewing of the actin cytoskeleton; (d) time-lapse microscopy for live viewing of cell behavior; and (e) SEM examinations for cell morphology.
All cell cultures were conducted in the same manner, except those used for DNA transfection. In general, bone marrow aspirates were harvested with informed consent from patients immediately prior to elective orthopaedic procedures as described by Muschler et al (CitationMuschler, Nitto et al 2003). Briefly, a 2 ml sample of bone marrow was aspirated from the anterior iliac crest into 1 ml of saline containing 1000 units of heparin (Vector, Burlingame, CA). Human bone marrow provides relatively easy isolation of CTPs compared to other tissues. The heparinized marrow sample was suspended into 20 ml of Heparinized Carrier Media (alpha-MEM + 2 units/ml Na-heparin; Gibco, Grand Island, NY) and centrifuged at 1500 rpm (400x) for 10 minutes. The buffy coat was removed, resuspended in 20 ml of 0.3% BSA-MEM (Gibco), and the number of nucleated cells was counted. The PDMS substrates and control surfaces were sterilized for 30 minutes with 70% ethanol (Aaper Alcohol and Chemical Co.). Cells were then plated on Day 0 at a seeding concentration of 250,000 cells/ml and cultured for 9 days in α-MEM media (Gibco #11900–073) with 10% Fetal Bovine Serum (Whittaker, Walkersville, MD) plus Dexamethasone (Sigma-Aldrich #D-1756), which was used to enhance osteoblastic expression (CitationMajors, Boehm et al 1997). The media was removed and replaced on Days 1, 2, 5, and 7.
Cell fixation and staining
Fixation for cell quantification
On Day 9, the cultures were fixed and permeabilized by placing the substrates in acetone:methanol in a 1:1 ratio for 10 minutes. Afterwards, cells were stained with 6-diamidino-2-phenylindole dihydrochloride hydrate (DAPI) (Vector), a nuclear fluorescent stain (Citationden Braber, Ruijter et al 1995), for 6 minutes at 25 ºC and subsequently washed three times with phosphate buffer. After imaging nuclei using DAPI staining, cells were again stained in situ for alkaline phosphatase (ALP), a marker for osteoblastic differentiation (CitationMuschler, Boehm et al 1997), using 0.9 mM Napthol AS-MX phosphate and 1.8 mM Fast Red-TR Salt for 30 minutes at 37 °C. This staining forms an insoluble Napthol-Fast Red complex that precipitates in regions where cells express ALP activity. The precipitate was observed after autofluorescence.
Fixation for actin and focal adhesion staining
Other SMOOTH, POSTS, AND CHANNELS surfaces were used for staining actin and phosphotyrosine to observe the cell actin cytoskeleton and focal adhesions, respectively. These cells were fixed with 2% paraformaldehyde (Electron Microscopy Sciences, Washington, PA) in PBS for 10 minutes, rinsed three times with PBS, permeabilized for 10 minutes with 0.2% Triton X-100® (Lab Chem Inc., Pittsburgh, PA) in PBS, and rinsed again three times with PBS prior to both phosphotyrosine and actin immunostaining. Specimens to be immunostained for phosphotyrosine were incubated with a primary antibody Ab 4G10 (Upstate Biotechnology, Lake Placid, NY) at 1:500 in PBS for 2 hours at 25 °C, rinsed with PBS, followed by a secondary antibody Alexa 546 (Molecular Probes, Eugene, OR) at 1:20 in PBS for 1 hour at 25 °C. After exposure to the secondary antibody, the specimens were rinsed three times with PBS, and then mounted with DAPI-containing Vectashield® (CitationMata, Boehm et al 2002; CitationMata, Su et al 2003). Specimens stained for filamentous actin were incubated with Rhodamine Phalloidin (Sigma, St. Louis, MO) at 1:50 in PBS for 45 minutes at 25 °C, rinsed three times with PBS, and then mounted with DAPI-containing Vectashield as stated above.
Staining using DNA transfection
Another group of cells cultured were transfected with a bacterial plasmid tagged with a Green Florescent Protein (GFP) (CitationVasanji, Ghosh et al 2004). These cells were cultured for 5 days on the 10 μm POSTS and SMOOTH surfaces, and subsequently, incubated for 5 hours with pEGFP-actin (1.25 μg/substrate, human cytoplasmic β-actin with GFP on the C terminus, Clonetech, Palo Alto, CA). After a wash with DMEM/Ham’s F-12 medium containing 5% serum, the cells were placed back into the incubator for 3 additional days of culture. The live cells were then observed under a fluorescent microscope and the transfected cells analyzed using time-lapse microscopy.
Fixation for SEM observations
SEM was used to observe cell morphology. In order to assess the possibility of cell damage due to cell fixation (CitationGreen, Jansen et al 1994), two different procedures were used to prepare the cells for SEM observation. On Day 9, the media was removed and the plated substrates were immersed in a solution containing 2% glutaraldehyde (Electron Microscopy Sciences, Fort Washington, PA), 3% sucrose (Sigma-Aldrich Co., Irvine, UNITED KINGDOM), and 0.1 M PBS (Baxter, Deerfield, IL) at 4 °C and 7.4 pH. After 1 hour, substrates were rinsed twice with the PBS for 30 minutes at 4 °C and washed with deionized (DI) water for 5 minutes. Dehydration was achieved by placing the plated substrates in 50% ethanol (in DI) for 15 minutes and replacing it every 15 minutes while increasing the concentration of ethanol to 60, 70, 80, 90, and finally 100% (Aaper Alcohol and Chemical Co.). The liquid ethanol was removed using critical point drying. The second fixation protocol followed the same steps, except that dehydrated cells were immersed for 5 minutes in hexamethyldisilazane (HMDS) (CitationNation 1983) instead of using critical point drying (CitationGreen, Jansen et al 1994).
Cell culture analysis
Cell quantification
A phase contrast microscope (Olympus CK2) (Olympus Optical Co., JAPAN) was used for daily observation of the cells. Cells were fixed on Day 9, stained with DAPI and viewed under a fluorescent microscope (Olympus BX50F) (Olympus Optical Co.) to study different cell parameters: cell attachment, by counting the number of colonies that are formed; cell proliferation, by counting the number of cells within a single colony; cell migration, by studying the distribution of cells within the colony; and cell differentiation, by assay of markers of the osteoblastic phenotype. To verify this quantification technique, additional cells were cultured and five randomly chosen 4x fields of vision were imaged with the fluorescent microscope (Olympus BX50F, Olympus Optical Co.), and the corresponding number of cells was counted.
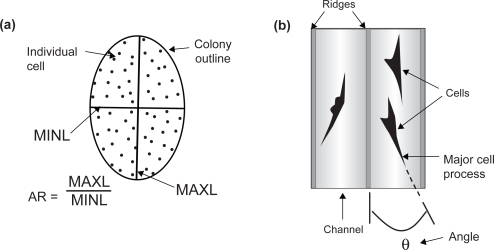
In addition to cell number/colony and total cell number, the following colony parameters were also quantified: colony area, colony density, length of longest axis of the colony (MAXL), and length of shortest axis of the colony (MINL) (). A colony was defined as a cluster of 8 or more cells (CitationMuschler, Nitto et al 2001). Colony area, MAXL, MINL, and the resulting colony aspect ratio (AR = MAXL/MINL) were quantified using the computer software Image-Pro Plus (Media Cybernetics, Inc., Silver Spring, MD). In order to account for random variations between and within experiments, statistical significance was defined at the 95% confidence interval using a One way analysis of variance (ANOVA) test performed in Microsoft Excel (Microsoft Corp., Redmond, WA). Cell alignment was quantified by photographing five randomly chosen fields of vision of CTPs on CHANNELS textures, and measuring the angle between the longest axis of the cell and the channel axis (Citationden Braber, Ruijter et al 1996) (). The morphology of cells cultured on the PDMS substrates and control surfaces was also examined using SEM, while the actin cytoskeleton and focal adhesions were observed using a confocal microscope (Leica TCS-SP Laser Scanning Confocal Microscope, Heidelberg, GmBH, Germany). Finally, cells were stained in situ for ALP and viewed using a fluorescent microscope to verify differentiation into osteoblastic phenotype.
Figure 2 Schematic diagrams depicting: (a) a single colony of cells and colony parameters: longest axis of the colony (MAXL), shortest axis of the colony (MINL), and colony aspect ratio (AR); and (b) a pair of channels illustrating alignment of cells with respect to channel axis.
Analysis of other experiments
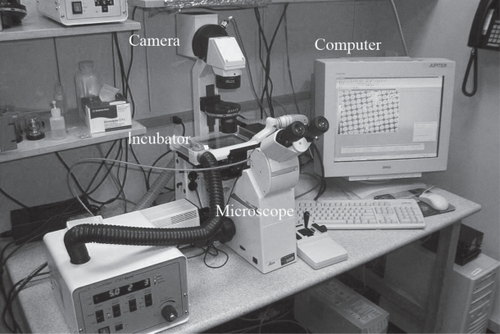
SEM observations were used to qualitatively describe the morphology of the cells grown on the different substrates. The actin cytoskeleton and focal adhesions on POSTS, CHANNELS, and SMOOTH surfaces were observed with the confocal microscope on randomly chosen cells. Two different heights were quantified on cells grown on POSTS: the height from the lowest observed actin to the bottom of the cell nuclei, and the height from the lowest actin to the top of the cell nuclei. The mean heights from 20–30 cells on 10, 20, 40 μm POSTS and SMOOTH surfaces were calculated. Time-lapse microscopy was used to observe the cells transfected with DNA on the 10 μm POSTS under a Leica DM IRB fluorescent microscope (Leica, Heidelberg, GmBH, Germany), and the cells cultured on 10 μm POSTS, CHANNELS, and SMOOTH surfaces using the same microscope in a phase contrast mode. This microscope was equipped with an incubator that controlled temperature and CO2 for live viewing of the cells ().
Figure 3 Photograph showing setup for time-lapse microscopy including the microscope (with fluorescent and phase contrast modes), an incubator, a camera for imaging of the cultures at specific times, and a computer for storage and display.
Results and discussion
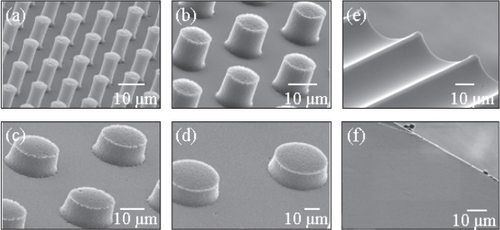
SEM examinations revealed that the PDMS substrates did not exhibit significant geometrical variations with respect to the photoresist/silicon master. Furthermore, a comparison of the PDMS substrates before and after ethanol sterilization did not reveal any apparent pattern degradation (). The effect of the SEM fixation procedure on the PDMS substrates was minimal; only slight markings were observed on PDMS surfaces immersed in HMDS. Qualitative SEM examinations revealed that morphologies of cells on the various PDMS substrates were similar for both critical point drying and HMDS-based fixation procedures.
Figure 4 Scanning electron microscope (SEM) images of POSTS that are 7–10 μm high, (a) 5 μm, (b) 10 μm, (c) 20 μm, and (d) 40 μm diameter, with the same separation distance between the posts; (e) CHANNELS that are 11 μm high and 45 μm wide; and (f) SMOOTH substrates.
Cell morphology and distribution
CTPs attached, proliferated, migrated, and differentiated on all PDMS substrates and control surfaces. There were clear differences at the cell and colony level between cells grown on all three PDMS substrates ().
Figure 5 Images illustrate differences in colony (fluorescent microscope) and cell (SEM) morphology after fixation and staining. (a) On SMOOTH, colonies were approximately circular in shape and cells exhibited a broad flattened shape; (b) on POSTS, colonies were larger and cells exhibited narrower elongated processes; and (c) on CHANNELS, both colonies and cells were highly aligned along the channel axis.
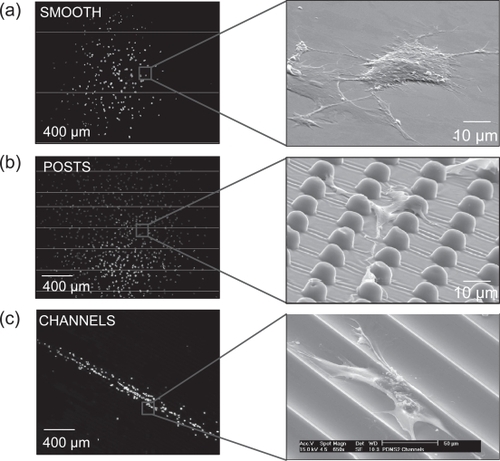
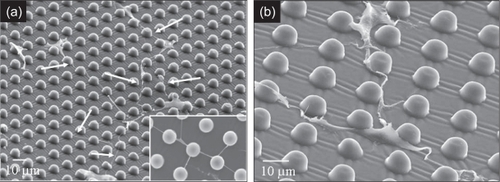
Before spreading, the cells exhibited a circular shape of approximately 10–12 μm diameter, and when spread, the cell morphology varied with the culturing substrate. On the SMOOTH PDMS and control surfaces, cell bodies adopted a broad flattened shape, ranging from 40–100 μm-diameter and exhibited average process lengths up to 80 μm (). The cells on POSTS tended to attach next to the posts and spread between them, exhibited highly contoured morphology, and directed their long processes (up to 300 μm) towards posts and other cells (). Similar observations on cell morphology have been made by Deutsch et al (CitationDeutsch, Motlagh et al 2000) on myocytes and Brunette and Chehroudi (CitationBrunette and Chehroudi 1999) on epithelial cells.
Figure 6 SEM images illustrate: (a) cells growing on 10 μm POSTS with long processes (white arrows and inset) directed towards posts and other cells; and (b) a closer view demonstrating cells with highly contoured morphologies and processes directed towards posts and their neighboring cells.
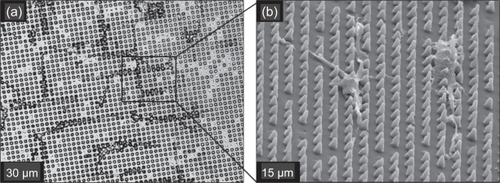
Qualitatively, cells cultured on POSTS with smaller-diameter posts were smaller and exhibited narrower processes than those grown on larger-diameter posts with correspondingly greater distances between posts. Similar observations have been previously described by Schmidt and von Recum (CitationSchmidt and von Recum 1992). The narrowest processes were observed on cells cultured on the 5 μm POSTS, in which individual cells tended to grow between and along the array of posts (). Similar orthogonal alignment was also observed for most of the cells cultured on the 10 and 20 μm POSTS. Other research groups (CitationBrunette 1986; CitationBrunette 1986; Citationden Braber, Ruijter et al 1995; CitationCurtis and Wilkinson 1997; CitationAlaerts, De Cupere et al 2001) have reported cell process alignment when cultured on channel textures. In our case, an equivalent channel-like texture is also provided by the short separation between posts on the 5, 10, and 20 μm POSTS, which would explain the corresponding cell alignment.
Figure 7 Phase contrast (a) and SEM (b) images of cells on 5 μm POSTS. Cells tended to grow in an orthogonal manner between and along the array of posts, which form an equivalent channel-like texture.
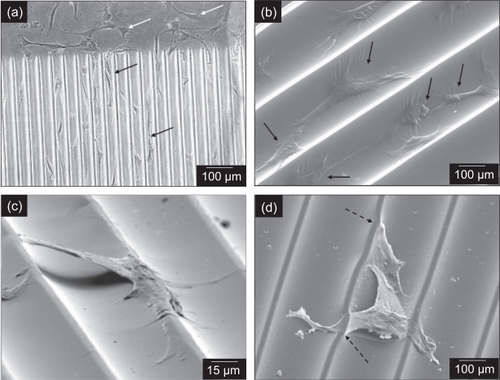
On CHANNELS, cells tended to attach and spread mostly within and along the channels with a mean alignment of 14.44º. Although the process lengths were comparable to those on cells grown on the smooth surfaces, cell bodies were narrower and were oriented along the channel axis. Similar characteristics of cell alignment in channels have been previously reported (CitationBrunette 1986; CitationBrunette 1986; Citationden Braber, Ruijter et al 1995; CitationCurtis and Wilkinson 1997; CitationAlaerts, De Cupere et al 2001). In regions with both channels and smooth surfaces, cells on CHANNELS aligned, while cells on SMOOTH kept their random orientation (). The majority of CTPs on CHANNELS were located within the channels and aligned to the channel axis with the major processes generally directed towards those of other cells (). However, a few cells straddled the ridges between channels (), which is consistent with previous reports (CitationBrunette 1986; CitationBrunette 1986). SEM and phase contrast microscope images revealed distortions on ridges at points of attachment by cell processes (), which suggests strong adhesion that is likely mediated by either adsorbed serum proteins from the medium to the surface, or by cell attachment factors expressed by CTPs on the PDMS surfaces (Citationden Braber, Ruijter et al 1998).
Figure 8 Cells on CHANNELS aligned along the direction of the channels (black arrows), while cells on SMOOTH kept their random orientation (white arrows) (a). The majority of cells aligned within the channels (b). while a few straddled the ridges (c). In some cases, distortions of the ridges at the points of cell attachment were observed (dashed black arrows), which suggest strong adhesion of the cell to PDMS (d). Phase contrast image is (a); (b)–(d) are SEM images.
Cell shape has been implicated to participate in the regulation of cell differentiation (CitationChen, Mrksich et al 1998). However, our qualitative observations revealed similar ALP staining on all the surfaces, which suggested that surface texture did not affect their differentiation into osteoblastic phenotype.
Actin cytoskeleton, focal adhesions, and cell height
As expected, the actin cytoskeleton in cells on CHANNELS was aligned along the axes of the channels, compared to a more random orientation in cells grown on SMOOTH (), which is consistent with previous reports (Citationden Braber, Ruijter et al 1995). On POSTS, the actin microfilaments were packed closer together (possibly due to their narrower bodies as revealed by SEM), and were directed towards the posts; while focal adhesions were observed on the bottom and on the sides of the posts ().
Figure 9 Fluorescent microscope images depict: (a) actin cytoskeleton aligned along the axis of the CHANNELS; and (b) actin cytoskeleton exhibiting random orientation on SMOOTH.
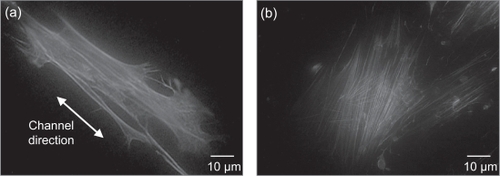
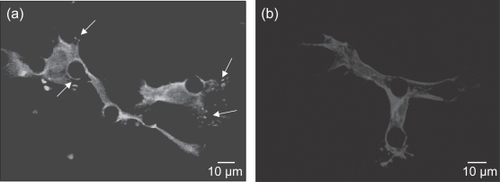
Figure 10 Fluorescent microscope images of cells grown on 10 μm POSTS showing: (a) focal adhesion contacts (spots marked by white arrows) and cell nuclei; and (b) actin cytoskeleton and cell nuclei.
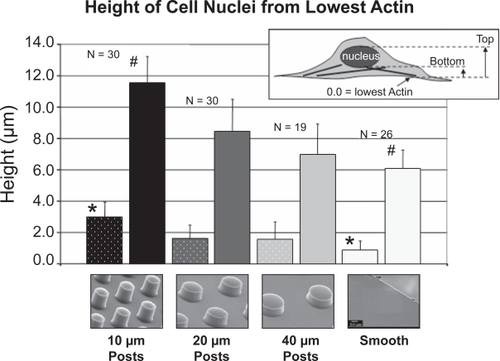
The heights of cells were quantified using confocal microscopy to verify SEM observations, which suggested a more contoured cell morphology on smaller sized POSTS. The height of the cell nuclei was measured from the lowest observed actin microfilaments on the different surfaces. These measurements revealed higher positions of the cell nuclei as the spacing between posts decreased. The position of the cell nuclei (from the lowest actin) increased from 0.9 μm on SMOOTH to 3.0 μm on the 10 μm POSTS (). In addition, the height of the cell nuclei also increased from 6.1 μm on SMOOTH to 11.5 μm on the 10 μm POSTS. The cell nucleus height was calculated by taking the difference between the highest and lowest points of the nucleus.
Figure 11 Quantification of height from the bottom of the lowest observed actin microfilaments to the bottom of the nucleus (lighter tone striped bars on left), and from the lowest actin to the top of the nucleus (darker tone solid bars on right). The difference between the two bars for each substrate corresponds to the cell nucleus height. N corresponds to the number of cells measured on each substrate. There was a statistically significant difference between the 10 μm POSTS and the SMOOTH for both bars (p < 0.05).
Time-lapse microscopy
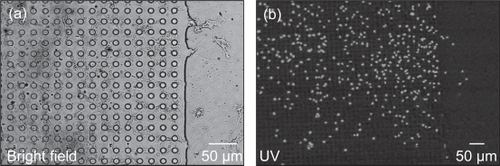
Time-lapse microscopy using phase contrast mode allowed visualization of cell proliferation and migration on POSTS, CHANNELS, and SMOOTH. Cell behavior was different on the three surfaces. On POSTS, cells migrated within the posts exhibiting narrower shapes and higher contours than cells on SMOOTH, and appeared to preferentially attach to the posts as they moved. In contrast, cells on SMOOTH appeared to anchor to random locations on the surface as they migrated. At the interfacet between POSTS and SMOOTH, cells were observed to attach to the posts and either stay within the posts or migrate towards the posts (). This behavior is confirmed in where a fixed cell colony, stained with DAPI, clearly shows the preference of cells to stay and grow on the POSTS compared to the SMOOTH.
Figure 12 Time-lapse microscopy images showing a cell (white arrow) at the edge of a growing colony near the interface of 10 μm POSTS and SMOOTH (a), reaching the smooth regions (b), and as it migrates on SMOOTH (c), it attaches to the posts (d–f) and migrates back towards POSTS (g, h). Time scale is 10 hours. (Note: the brighter, irregular circular shapes visible between and above posts represent erythrocytes and other cells present in the bone marrow aspirate).
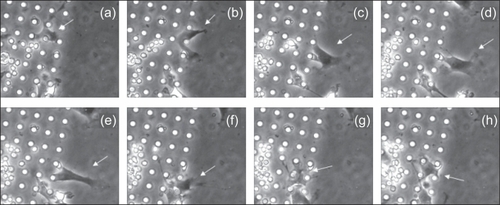
Figure 13 Phase contrast (a) and fluorescent microscope (b) images illustrating a colony of cells (stained with DAPI) demonstrating preference for 10 μm POSTS while avoiding SMOOTH.
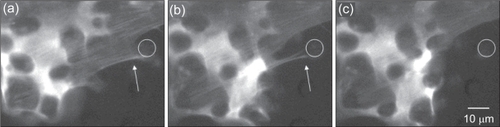
Observations on the transfected cells confirmed that cells growing on POSTS directed their actin microfilaments towards posts (). Close examination revealed that a cell attached to posts by extending its cytoskeleton and surrounding (grabbing) the posts as the cell migrated between them.
Figure 14 Time-lapse microscopy images showing transfected cells grown on 10 μm POSTS. Notice the fluorescent actin cytoskeleton (white arrow) attaching to a post (white circle drawn for clarity) (a); detaching from the post as it begins to migrate (b); and finally release from the post (c). Time scale is 15 minutes.
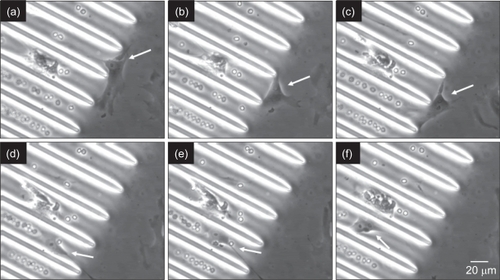
On CHANNELS, cells appeared to align along the direction of the channels, while positioning their body within the channel and extending their processes towards the ridges (elevated areas) of the channels. In addition, cells appeared to migrate along the axis of the channels, but following a meandering path as they moved from side to side within the channels. At the interface between CHANNELS and SMOOTH, cell bodies appeared to become narrower as they entered the channels and aligned within them (). Unlike cells on POSTS, there was no evidence that cells preferred to grow on CHANNELS compared to SMOOTH.
Figure 15 Time-lapse microscopy images depicting a cell (white arrow) at the interface between CHANNELS and SMOOTH. The cell spreads perpendicular to the channels (a, b), attaches to the ridge of a channel (c), and migrates into the channel while aligning its body along the channel axis (d–f). Time scale is 4 hours.
Note: the circular shapes visible in the channels represent erythrocytes and other cells present in the bone marrow aspirate.
Cell and colony quantification
CTPs attached, proliferated, and differentiated on all PDMS substrates and control surfaces. and present results from the cell culture analysis for different cell and colony parameters on POSTS, CHANNELS, SMOOTH and control surfaces. It is known that humans differ significantly from one another with respect to the cellularity of bone marrow and the prevalence of osteoblastic progenitor cells (CitationMuschler, Nitto et al 2003), and therefore, the cell counts on the PDMS substrates are normalized to the control surfaces for a particular experiment (same donor). The mean and standard deviation parameters were derived from three different experiments. The AR values were computed from the corresponding MAXL and MINL (not shown) values.
Figure 16 Graphs showing quantification of cell number/colony (a) and total cell number (b) from five fields of vision. Both graphs reveal a similar trend with POSTS exhibiting higher number of cells, with the highest number on 10 μm POSTS (* denotes statistical significance: p < 0.05).
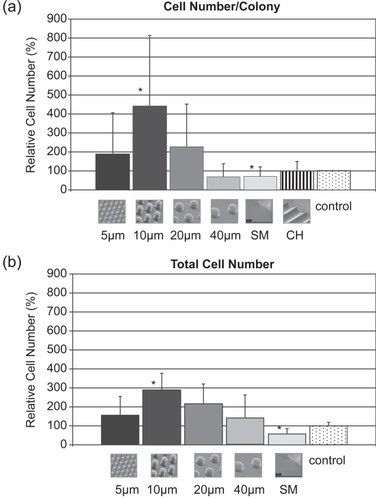
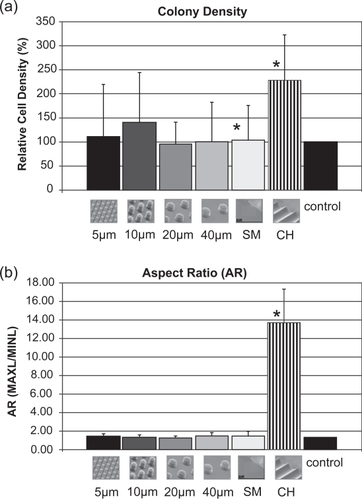
Figure 17 Graphs showing quantification of cell density (cell number/colony area) (a) and colony aspect ratio (AR = MAXL/MINL) (b) on CHANNELS (*denotes statistical significance: p < 0.05).
Cell number/colony and cell number
On Day 9, SMOOTH exhibited a mean number of cells per colony that was 71% of that on the control surfaces (100%). This observation is consistent with previous studies, where smooth PDMS films have been reported to exhibit significantly lower number of cells compared to their respective controls (CitationGreen, Jansen et al 1994; CitationDeutsch, Motlagh et al 2000). The difference in cell number/colony between Smooth and control might be partially explained by the difference in critical surface tension between the PDMS (24 dynes/cm, hydrophobic) (CitationRatner 1996) and glass (170 dynes/cm, hydrophilic) (CitationLyman, Muir et al 1965). Brunette and Chehroudi (CitationBrunette and Chehroudi 1999) have reported that materials with critical surface tensions between 20 and 30 dynes/cm exhibit minimal biological adhesion, and that high-energy surfaces would be expected to support cell attachment. Craighead et al (CitationCraighead, Turner et al 1998) also reported increased cell attachment on hydrophilic surfaces compared to hydrophobic ones.
In contrast, most POSTS had increased numbers of cells per colony compared to both the SMOOTH and control surfaces, as illustrated in . The maximum number of cells/colony was observed on the 10 μm POSTS, which exhibited around four times (442%) the number of those on the control and a statistically significant difference compared to the SMOOTH surface (p < 0.05). Cell number/colony on the 20 and 5 μm POSTS nearly doubled (228% and 188%) that on the control surface, while 40 μm POSTS exhibited the lowest cell number/colony (67%), and CHANNELS (98%) presented comparable cell number/colony to the control surface. Likewise, cell number quantified from the five random fields of view followed the same trend (), where POSTS had increased numbers of cells compared to SMOOTH and control surfaces. As in the previous experiments, the maximum number of cells was observed on the 10 μm POSTS, which exhibited nearly three times (286%) the number of those on the control and a statistically significant difference compared to the SMOOTH (p < 0.05). Cell number on 20 μm PDMS POSTS textures was almost double (213%) that on the control surface, while the 5 and 40 μm POSTS textures exhibited cell numbers that were 153% and 144% that on the control surface, respectively.
These results contrast those reported by Green et al (CitationGreen, Jansen et al 1994) and Schmidt and von Recum (CitationSchmidt and von Recum 1992), where the tissue culture dishes exhibited significantly higher fibroblast and macrophage proliferation compared to corresponding PDMS post textures. Although the reasons for the discrepancy between our observations and the previous reports are not clear, it is possible that the difference in cell types and corresponding surface affinities (CitationRich and Harris 1981; CitationBrunette and Chehroudi 1999; CitationWebster, Ergun et al 2000), along with variations in topography and biochemical stimuli, might be contributing factors.
Some groups have previously reported an enhancement of cell attachment on post textures with respect to smooth surfaces. Deutsch et al (CitationDeutsch, Motlagh et al 2000) reported increased cell attachment of myocytes on PDMS pegs of 10–15 μm diameter with 20 μm spacing compared to standard tissue culture dishes. Craighead et al (CitationCraighead, Turner et al 1998) also reported increased astrocyte attachment on post-like surfaces of 0.5 μm diameter with 1 μm spacing. In our investigation, the number of colonies ranged from 5–16 among different donors (separate experiments), but was generally consistent (± 2) on all substrates for an individual donor (same experiment). This minor variation in the number of colonies on all substrates within a particular experiment suggests that CTP attachment was not preferentially enhanced, but rather, there was increased proliferation on the POSTS.
CTP proliferation, like for other cell types, is preceded by a period of cell spreading until an activation threshold is achieved. Dobereiner et al (CitationDobereiner, Dubin-Thaler et al 2005) have established that onset of fibroblast spreading is characterized by an increase in actin polymerization, which is triggered by favorable contact with the extracellular matrix (ECM). Furthermore, Dubin-Thaler et al (CitationDubin-Thaler, Giannone et al 2004) have reported length of the time lag between fibroblast contact with ECM molecules and onset of cell spreading was inversely related to ECM molecule concentration. In our investigation, the increased surface area of the POSTS resulted in greater ECM relative to the SMOOTH. Furthermore, 10 μm POSTS provided the most favorable contact for CTPs to the ECM, which was confirmed by the extent of their contoured morphology () relative to the other substrates. Therefore, we hypothesize that the lag time between CTP attachment and onset of spreading is decreased on POSTS relative to the SMOOTH and control surfaces. In turn, CTP spreading on 10 μm POSTS would achieve the activation threshold to proliferation earlier than on other substrates. This earlier onset of proliferation would result in increased cell number on Day 9, which would be consistent with our observations.
Colony density
The size of cell colonies was different on the various substrates, and correlated with the cell number/colony results. Areas of cell colonies on SMOOTH (0.96 mm2) and control surfaces (1.05 mm2) were comparable, but significantly smaller than the areas of the cell colonies on POSTS, especially compared to the 10 μm POSTS (6.57 mm2). Nonetheless, CHANNELS exhibited the smallest colonies (0.64 mm2). Furthermore, an examination of cell density within colonies (cell number per unit area) revealed that colonies on CHANNELS (229% denser than control) tended to be denser than colonies on POSTS (up to 140% on 10 μm POSTS), and were significantly denser than those on SMOOTH (104%) (). These observations collectively suggest that the rate of migration of cells within colonies on CHANNELS was significantly lower than on SMOOTH and control surfaces. It is unlikely that the highest density on CHANNELS is due to fusion of multiple cell colonies since the number of colonies was similar on all POSTS, CHANNELS, and SMOOTH substrates.
Colony aspect ratio
Colonies on POSTS, SMOOTH, and control surfaces were similar and exhibited arbitrary shapes without any preferred orientation (AR ∼1). In contrast, colonies on CHANNELS were highly directional and appeared elongated along the direction of the channel axes, with a mean MAXL of 3252 μm. POSTS exhibited lower MAXL values (1744 μm on 40 μm POSTS to 3086 μm on 10 μm POSTS), while SMOOTH presented significantly lower mean MAXL of 1265 μm. The directionality of the CTP migration is reflected by the higher AR values of colonies on the CHANNELS with a mean AR of 13.72 compared to 1.57 on SMOOTH, 1.51 on control, and 1.26 and 1.51 on 20 μm and 40 μm POSTS, respectively (). These results correlate with those from Brunette (CitationBrunette 1986) where epithelial cell colonies cultured on grooves exhibited preferred orientation.
The drastic increase in colony AR and MAXL for the CTPs cultured on PDMS CHANNELS textures are important parameters that should be considered when designing not only bone, but a variety of tissue engineering constructs that use CTPs. These effects may be particularly applicable when cells need to be localized in specific areas or when cell migration needs to be directed.
Conclusion
Microfabrication and micromachining techniques enable reproducible patterning of 2D substrates with precisely defined surface micro-textures, which can offer insight into cellular response to surface topography. The information obtained from such investigations is particularly crucial to the successful development of implantable 3D scaffolds.
Micro-textures resulted in the modification of CTP morphology, attachment, migration, and proliferation characteristics. Specifically, CTP colonies on 10 μm POSTS exhibited higher cell number than any other POSTS, and a significant increase in cell number (442%) compared to colonies on SMOOTH (71%). In addition, CHANNELS significantly enhanced cell density and colony directionality. These results demonstrate a significant response of CTPs to topography, and suggest a practical role for textured materials in modifying CTP behavior. This knowledge could be used not only to investigate fundamental cell growth characteristics but also to guide the design of 3D scaffolds for enhanced bone grafting outcomes.
Most investigations into the effects of micro-textured surfaces for in vitro cell studies have generally concentrated on individual cell morphology and not colony characteristics. In addition to knowledge of the effects of topography on individual cells, the successful engineering of functional tissues will require understanding how cells behave with their neighbors. Therefore, in vitro colony investigations can be clinically relevant in designing and predicting local tissue reactions to implanted scaffolds. Our study is unique in not only combining human CTPs with micro-textured surfaces, but also in quantifying the resulting cell and colony attributes.
Acknowledgements
The authors gratefully acknowledge the assistance of the following persons in the Lerner Research Institute at the Cleveland Clinic: Anna Dubnisheva, M.S., for MEMS fabrication and manuscript preparation; Charles Blaha, B.S., for cell culture; Morgan Grossman-McKee for quantification and data organization; Eun Jung Kim, M.S., for discussions and insights on cell growth characteristics; Amit Vasanji, Ph.D., and Judy Drazba, Ph.D., for cellular imaging; and Paul Fox, Ph.D. and Prabar Kumar Ghosh, Ph.D., for DNA transfection. The authors thank Ronald Midura, Ph.D., and Josephine Adams, Ph.D., also in the Lerner Research Institute for valuable discussions. This work was partially supported by a grant from the Rockefeller Brothers Foundation.
References
- Bone grafting CHC medical library and patient education1999Bone grafts and bone substitutesOrthopedic Network News1010172003Synthetic bone graft to be tested in revision hip surgery, Bioportfolio; (2005). Bone grafting, The Cleveland Clinic.
- AlaertsJADe CupereVM2001Surface characterization of poly(methyl methacrylate) microgrooved for contact guidance of mammalian cellsBiomaterials221216354211374465
- BauerTWMuschlerGF2000Bone graft materials. An overview of the basic scienceClinical Orthopaedics and Related Research371102710693546
- BrunetteDM1986Fibroblasts on micromachined substrata orient hierarchically to grooves of different dimensionsExperimental Cell Research164111263956588
- BrunetteDM1986Spreading and orientation of epithelial cells on grooved substrataExperimental Cell Research1671203173758202
- BrunetteDMChehroudiB1999The effects of the surface topography of micromachined titanium substrata on cell behavior in vitro and in vivoJournal of Biomechanical Engineering1211495710080089
- ChenCSMrksichM1998Micropatterned surfaces for control of cell shape, position, and functionBiotechnology Progress143356639622515
- CraigheadHGTurnerSW1998Chemical and topographical surface modification for control of central nervous system cell adhesionBiomedical Microdevices114964
- CurtisAWilkinsonC1997Topographical control of cellsBiomaterials18241573839613804
- den BraberETRuijterJE1996Quantitative analysis of fibroblast morphology on microgrooved surfaces with various groove and ridge dimensionsJournal of Biomedical Materials Research1721203744
- den BraberETRuijterJE1998Orientation of ECM protein deposition, fibroblast cytoskeleton, and attachment complex components on silicone microgrooved surfacesJournal of Biomedical Materials Research4022913009549624
- den BraberETRuijterJE1995Effect of parallel surface microgrooves and surface energy on cell growthJournal of Biomedical Materials Research2951187622536
- den BraberETRuijterJE1996Quantitative analysis of cell proliferation and orientation on substrata with uniform parallel surface micro-groovesBiomaterials1711109398718969
- DesaiTA2000Micro- and nanoscale structures for tissue engineering constructsMedical Engineering Physics22959560611259928
- DeutschJDMotlagh2000Fabrication of microtextured membranes for cardiac myocyte attachment and orientationJournal of Biomedical Materials Research5332677510813767
- DobereinerHGDubin-ThalerBJ2005Force sensing and generation in cell phases: analyses of complex functionsJ Appl Physiol9841542615772064
- Dubin-ThalerBJGiannoneG2004Nanometer analysis of cell spreading on matrix-coated surfaces reveals two distinct cell states and STEPsBiophys J863179480614990505
- FlemingJECornellCN2000Bone cells and matrices in orthopedic tissue engineeringOrthopedic Clinics of North America3133577410882463
- GreenAMJansenJA1994Fibroblast response to microtextured silicone surfaces: Texture orientation into or out of the surfaceJournal of Biomedical Materials Research285647538027105
- KapurRSpargoBJ1996Fabrication and selective surface modification of 3-dimensionally textured biomedical polymers from etched silicon substratesJournal of Biomedical Materials Research334205168953387
- LymanDJMuirWM1965The effect of chemical structure and surface properties of polymers on the coagulation of blood. I. Surface free energy effectsTransactions of the American Society for Artificial Internal Organs1130130614329101
- MajorsAKBoehmCA1997Characterization of human marrow stromal cells with respect to osteoblastic differentiationJournal of Orthopaedic Research154546579379264
- MataABoehmC2002Analysis of connective tissue progenitor cell behavior on polydimethylsiloxane smooth and channel micro-texturesBiomedical Microdevices442677516596170
- MataABoehmC2002Growth of connective tissue progenitor cells on microtextured polydimethylsiloxane surfacesJournal of Biomedical Materials Research62449950612221697
- MataAFleischmanAJ2004Microfabricated 3D scaffolds for tissue engineering applicationsMRS Fall Meeting: Nanoscale materials science in biology and medicine
- MataASuX2003Osteoblast attachment to a textured surface in the absence of exogenous adhesion proteinsIEEE Transactions on NanoBioscience242879415376920
- MuschlerGFBoehmCA1997Aspiration to obtain osteoblast progenitor cells from human bone marrow: The influence of aspiration volumeThe Journal of Bone and Joint Surgery791116997099384430
- MuschlerGFNittoH2001Age- and gender-related changes in the cellularity of human bone marrow and the prevalence of osteoblastic progenitorsJournal of Orthopedic Research19111725
- MuschlerGFNittoH2003Spine fusion using cell matrix composites enriched in bone marrow-derived cellsClinical Orthopaedics and Related Research40710211812567137
- NationJL1983A new method using Hexamethyldisilazane for preparation of soft insect tissues for scanning electron microscopyStain Technology586347516679126
- RatnerBD1996Surface properties of biomaterialsBiomaterials ScienceHA RatnerBDSchoenFJLemonsJESan Diego CAAcademic Press25
- RichAHarrisAK1981Anomalous preferences of cultured macrophages for hydrophobic and roughened substrataJournal of Cell Science501177033247
- SalgadoAJCoutinhoOP2004Bone tissue engineering: State of the art and future trendsMacromolecular Biosciences4874365
- SchimandleJHBodenSD1997Bone substitutes for lumbar fusion: present and futureOperative Techniques in Orthopaedics71607
- SchmidtJAvon RecumAF1992Macrophage response to microtextured siliconeBiomaterials13151059691493189
- TsangVLBhatiaSN2004Three-dimensional tissue engineeringAdvanced Drug Delivery Reviews56111635164715350293
- van KootenTGWhitesidesJF1998Influence of silicone (PDMS) surface texture on human skin fibroblast proliferation as determined by cell cycle analysisJournal of Biomedical Materials Research4311149509339
- VasanjiAGhoshPK2004Polarization of plasma membrane microviscosity during endothelial cell migrationDevelopmental Cell61294114723845
- WebsterTJErgunC2000Specific proteins mediate enhanced osteoblast adhesion on nanophase ceramicsJ Biomed Mater Res5134758310880091
- XiaYWhitesidesGM1998Soft lithographyAngewandte Chemie International Edition37555075