Abstract
The end-product of the electrospinning process is typically a randomly aligned fiber mesh or membrane. This is a result of the electric field generated between the drop of polymer solution at the needle and the collector. The developed electric field causes the stretching of the fibers and their random deposition. By judicious selection of the collector architecture, it is thus possible to develop other morphologies on the nanofiber meshes.
The aim of this work is to prepare fiber meshes using various patterned collectors with specific dimensions and designs and to evaluate how those patterns can affect the properties of the meshes relevant to biomedical applications. This study aims at verifying whether it is possible to control the architecture of the fiber meshes by tailoring the geometry of the collector. Three different metallic collector topographies are used to test this hypothesis.
Electrospun nonwoven patterned meshes of polyethylene oxide (PEO) and poly(ε-capro-lactone) (PCL) were successfully prepared. Those fiber meshes were analyzed by scanning electron microscopy (SEM). Both mechanical properties of the meshes and cell contacting experiments were performed to test the effect of the produced patterns over the properties of the meshes relevant for biomedical applications. The present study will evaluate cell adhesion sensitivity to the patterns generated and the effect of those patterns on the tensile properties of the fiber meshes.
Introduction
Polymeric fibers have been produced through conventional processes such as wet spinning, dry spinning, or melt spinning. In these processes, pressure-driven extrusion of a polymeric fluid produces fibers that typically range from 10 to 500 μm. The production of fibers with smaller diameters, in the submicron or nanometer range, allows a significant increase of the surface area to volume ratio and may allow to obtain superior mechanical performance (eg, stiffness and in particular tensile strength) of individual fibers. In fact, the strength of materials is very dependent on the typical dimensions and on the probability of occurrence of local defects of critical size. By obtaining sufficiently small diameter fibers it may be possible to obtain superior mechanical strengths on materials.
A number of processing techniques have been used to prepare polymer nanofibers. These include drawing (CitationOndarcuhu 1998), self-assembly (CitationWhitesides 2002) or electrospinning (CitationFong 2001). The drawing process, in which fibers are produced using a process similar to dry spinning, requires strong viscoelastic materials that can sustain the large deformations required for the production of nanofibers. The self-assembling method relies on chemical motifs, most of which are specifically tailored using peptide fragments that spontaneously aggregate into specific 3D motifs similar to hydrogels when the medium has specific stimuli such as the pH. Electrospinning (or electrostatic spinning) can also be used to produce polymeric nanofibers. This process is commonly referred to as electrostatic atomization and occurs when an electric field causes a stress that overcomes the surface tension of a liquid drop is by, thus ejecting tiny droplets from the liquid surface. With the adequate selection of parameters of the electrospinning process it is possible to obtain electrospraying of the solution into particles instead of fibers (CitationLoscertales 2002).
The structures obtained using electrospinning are typically non-woven membranes composed by consecutive layers of randomly aligned nanofibers with porosities comparable to the diameters of the fibers. Each nanofiber layer deposited in the membrane may carry a sufficient amount of solvent at the instant of deposition enabling to produce a link with the previous layer and resulting into a mechanically stable mesh. One-dimensional nanostructures such as nanofibers when assembled in a structured way into specific architectures have received considerable interest in literature. Most studies aim at obtaining basic building blocks enabling to fabricate complex devices and systems. The growing interest in the electrospinning process is due to the possibility of targeting new materials applications in nanotechnology, once nanofibers and nanostructures of various polymers can be obtained by this process. This interest is shown in the number of publications related to electrospinning (eg, CitationHuang 2003). A great variety of synthetic and natural polymers was already successfully electrospun (CitationDoshi 1995; CitationReneker 1996).
The interest for the patterning of meshes in electrospin-ning started in 1966 with a patent filed to produce fibers under different patterns using electrospinning (CitationSimons 1966). In the protected embodiment, the positive electrode was immersed into the polymer solution while the negative electrode was connected to a belt, where the fabric was deposited. Similar strategies were followed by other groups that reported the production of aligned, non-woven meshes, obtained in rotating cylinder collectors (CitationMatthews 2002; CitationKatta 2004; CitationBhattarai 2005).
Alignment in confined regions (CitationTheron 2001; CitationZussman 2003) was also produced by the use of sharp discs to position and align individual polymer nanofibers into parallel arrays. Others produced polymeric and ceramic nanofibers as axially aligned arrays by the use of a collector consisting of two pieces of electrically conductive substrate separated by an electrical insulating gap (CitationLi 2004).
Another very interesting method to control the morphology of meshes reported the use of collectors with defined patterns to develop new air filters for chemical protective clothing and filter masks (CitationGibson 2004). In this work, collectors with different topographies were used to produce polyamide meshes and thermoplastic polyurethane elastomeric membranes and their mechanical properties assessed in air pressure bursting tests.
The control of the deposition of fibers using conducting and insulating regions in the collector was also proposed recently (CitationLi 2005). It was observed that the collector conductivity influences the electrostatic forces acting on the deposition of the charged fibers and that the fibers can be assembled into defined structures with different configura-tions by changing the design of the collector.
Another very interesting concept, combining the use of an insulating rotating drum with a moving and conducting needle placed underneath the drum, was shown to produce controlled and aligned polystyrene and acrylic nanofibers (CitationSundaray 2004).
Rectangular frame electrodes were shown to produce parallel aligned fibers both in PLA and PA6 (CitationDersch 2003). The authors also studied the crystalline structure of the nano-fibers obtained and concluded that the intrinsic structures of PLA and PA6 fibers with diameters down to 50 nm do not differ considerably from those found for much thicker fibers obtained by melt extrusion.
Two metal blades were used to concentrate the deposition of aligned nanofibers (CitationTeo 2005). Through this method a bundle formed of highly aligned polycaprolactone fibers was obtained, enabling to produce braided structures and twisted ropes. Most of those structures were developed in the context of attempts to control the morphology and consequently of the properties of the nanofiber meshes. A very detailed review condensing the potential of the nanofiber meshes for biomedical applications and tissue engineering has been published (Pham 2003). Although many studies reporting in vitro testing of different cell cell types seeded at the surface of nanofiber meshes have already been published, few reports have been published about the in vivo performance of the nanofiber meshes. Mouse bone marrow stem cells were seeded at the surface of PCL nanofiber meshes and cultured for two days in vitro in osteogenic differentiation media and further implanted in the abdomen of the recipient animals in the omentum region, a highly vascularized tissue (CitationShin 2004). The results showed a successful differentiation of the cells and colonization of both the periphery and the inner regions of the scaffold.
The effect of mesh orientation was specifically explored in the study of the neurite outgrowth of a neural stem cell line seeded at the surface of aligned PLLA nanofiber meshes (CitationYang 2005). The neural stem cells are reported to produce higher differentiation rate at the surface of thinner fibers whereas the cell orientation and extension seems to be less affected by the fiber diameter but considerably affected by the orientation of the fiber meshes.
In the present work, we aim at studying the behavior of an osteoblastic cell line at the surface of PCL nanofiber meshes with different morphologies to understand how the cells react and adapt to the local topography showing preferential regions of cell attachment.
Experimental
Materials
Polyethylenoxide (PEO) with an average molecular weight, Mn = 90 000 was purchased from the Dow Chemical Company and Poly(ɛ-caprolactone) (PCL) was purchased from Union Carbide, ridgeport, New Jersey and used directly as supplied.
The concentration used for the electrospinning of polyethyl-enoxide (PEO) and polycaprolactone (PCL) was 4% (w/w) and 0.14 g/mL, respectively. The solvents used for PEO and PCL were water and an organic solvent mixture (1:1) composed of tetrahydrofuran and dimethylformamide (DMF), respectively, followed by mixing for 24 h at room temperature.
The fibers were electrospun with a flow rate of 0.8 mL/h and a voltage of 12–13 kV between the needle and the grounded collector. Those conditions were experimentally optimized to obtain bead-free membranes and to have stable processing conditions.
The collector patterned geometries were the thread crest of a screw and a metallic net for PCL and a metallic net for PEO (). A flat copper collector was used as reference to compare with the patterned collectors (). The thread crest of a 20 mm diameter metric screw (M 20) was used as a finer patterned collector (). A metal wire net (1.75 mm × 1.3 mm) was used to obtain an orthogonal pattern of deposition ().
Figure 1 Metallic collectors used for the fiber meshes: a) copper plate, b) thread crest of a screw and c) metal wire net.
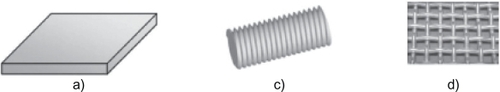
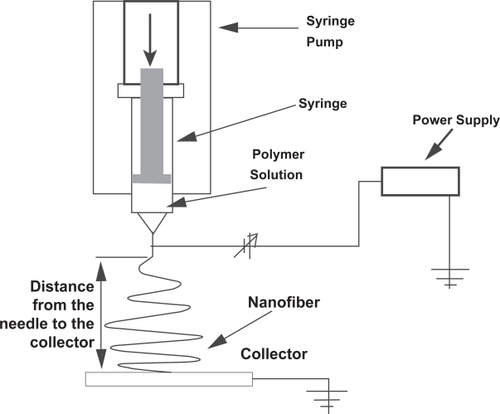
Figure 2 Schematic draft of the electrospinning apparatus.
Apparatus for electrospinning
The experimental apparatus (shown schematically in ) uses a high voltage power supply, a syringe pump and a collector system. The electric field was generated by a high voltage power supply. The maximum allowed voltage was 20 kV, corresponding to an average current of few microamperes. The flow rate was controlled by the syringe pump. The fibers were collected in a grounded metal collector plate. This collector plate consists of a copper base (400 cm2) electrically isolated with bakelite.
The liquid polymer solution was drained at a constant flow rate in order to get a constant flow through the needle. The needle was tilted by about 20º relative to its vertical position. The electric field was applied between the syringe needle and the metal collector plate (grounded). The electric voltage was incremented until the fiber spinning was observed.
The electric field can be changed by varying the distance between the syringe needle and the collector plate. Typically the distances range from 10 to 20 cm. The needle diameter was chosen according to the viscosity of the solutions.
Mechanical testing
For tensile testing, a (3 × 3 cm) paper frame with 1 cm square window was used as a support for the fiber mesh specimen preparation. The fiber mesh was placed in the central square window and glued to the paper frame. The mesh specimen size was a rectangular sample of 20 × 5 mm enabling the use of a 10 mm gauge length in the tensile experiment. The specimen width and thickness were measured prior to the experiments with a flat tip micrometer. The result of this measurement characterizes the thickest region on the width of the specimen, maximizing the value of the area of the cross-section and consequently resulting in mechanical properties which are probably under-evaluated. However, the reported mechanical properties should only be seen as indicative and providing data enabling to compare the different structures produced.
A 4505 Instron universal tensile testing machine with a 1 kN load cell was used in the experiments. The crosshead speed was selected at 5 mm/min and 10 mm gauge length. After clamping the paper frame to which the specimen was glued, the lateral sides of that paper frame were cut and the tensile test was initiated.
At least three specimens were tested for each sample. The test was defined to finish when fracture was reached. Typical tensile curves are shown in and the overall results are presented in .
Table 1 Tensile test results of PCL fiber meshes obtained with various collectors. The standard deviation appears between brackets in the table)
Cell contacting assay
The method used for cell culture will be briefly described. For direct contact assay a cell line of human osteoblasts, SaOs–2, was used. This cell line was chosen for this purpose because it is well characterized and its behavior is well studied in various environments and surfaces.
The cells were grown as monolayer cultures with DMEM culture medium supplemented with 10% FBS and 1% antibiotics/antymicotics until they reached confluence. At this stage the cells were trypsinized and seeded on the materials at a cell density of 33,000 cells/mL/specimen.
Cell adhesion and morphology was assessed by scanning electron microscopy (SEM) after 7 days of culture. The cell density and distribution on the materials surface was assessed qualitatively by methylene blue staining and observation by stereo light microscopy.
Results and discussion
Morphology of the fiber meshes
Polymer fibers were deposited randomly on a flat copper collector, in the form of stacked layered meshes during electrospinning. Various patterned meshes were successfully prepared using patterned collectors and their morphology was analyzed by scanning electron microscopy.
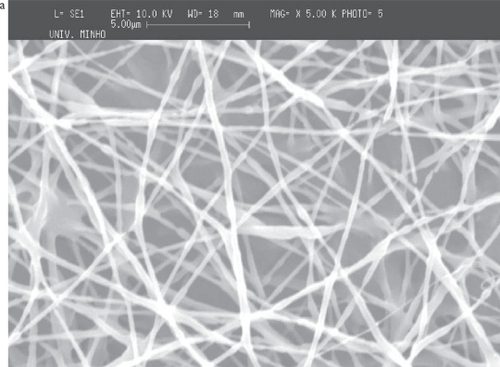
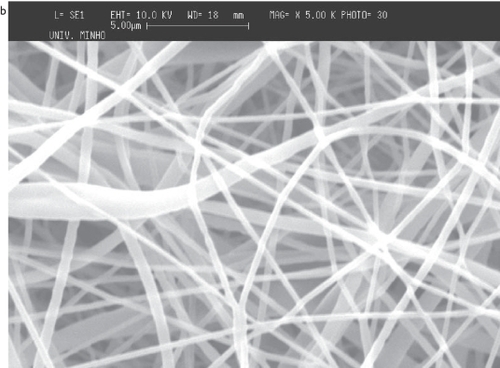
It was observed that larger production time (or number of layers deposited in the collector) do increase the fiber deposition density and consequently the fiber mesh apparent thickness. Meshes obtained with a flat copper collector are shown in the SEM micrographs in for PCL and for PEO.
Figure 3 SEM micrographs of meshes obtained with PEO (top) and PCL (bottom) with similar deposition time.
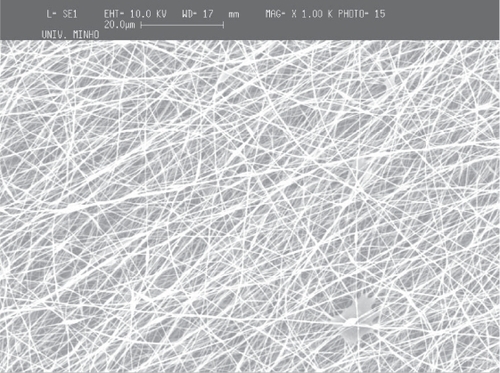
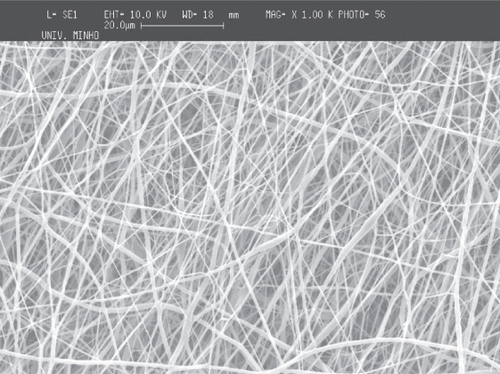
Although the fibers cover primarily the metallic collector, a considerable quantity falls outside of the collector. The comparative analysis of the meshes obtained at the collector and outside of it showed that the fibers are randomly deposited in both cases (). The average diameter of the fibers in the meshes is about 650 nm (scattered in an interval between 200 nm and 1300 nm), and the average diameter observed outside of the flat collector, is about 600 nm (ranging between 200 nm and 1200 nm).
Figure 4 SEM images of PCL deposited on top and in the area surrounding the flat copper collector: a) on top of the collector; b) in the area surrounding the flat copper plate.
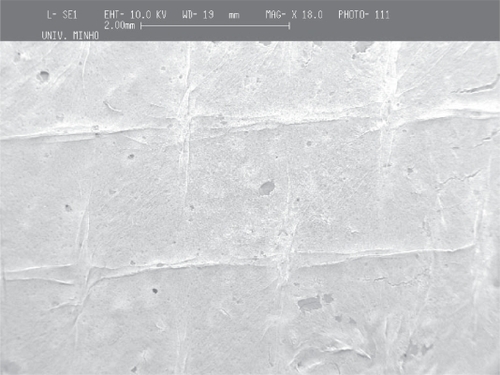
For PCL, and using the thread of a 20 mm diameter screw as collector, it is observed that the regions of the mesh corresponding to the thread crest of the screw have thicker cross-sections. It can be seen in , the fiber meshes seem to reproduce the existing pattern in the collector (the pattern depicted in is not linear because of the extraction process and subsequent flattening that causes some deformation of the mesh). It can be observed that in the same regions of the thread crest of the screw (), the fibers are aligned parallel to the pattern of the collector. The consecutive deposition of fibers in the same region seems to cause an agglomeration of solvent that join the fibers. The deposition pattern is less defined between two consecutive threads and the density of fibers is also smaller (). Furthermore, the high magnification of the fibers in the mesh, shows that the density of fibers is much larger in the thread crest than in the other regions of the screw. This observation enables to conclude that the thickening corresponds to a region of larger density of fibers in the fiber mesh, probably caused by the disturbance of the electric field caused by the topography of the collector. The average diameter of the fibers seems to be affected by the local conditions, being about 660 nm in the thinner region of the threads of the screw and about 720 nm in the thicker one. Between the threads of the screw, in the thinner region, the average diameter is around 660 nm and in the thicker region the average diameter is 720 nm.
Figure 5 SEM images of PCL fiber meshes deposited in the screw collector: a) lower magnification of the fiber mesh, b) close-up showing the region of the mesh corresponding to the thread crest and c) the region between two consecutive threads of the screw collector.
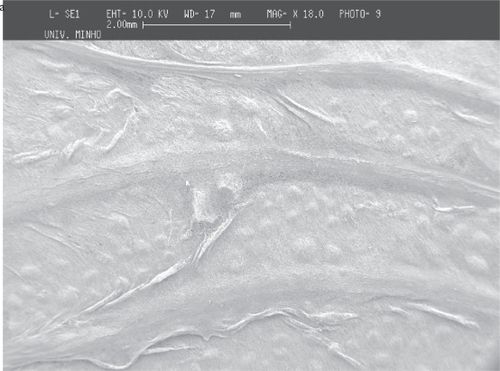
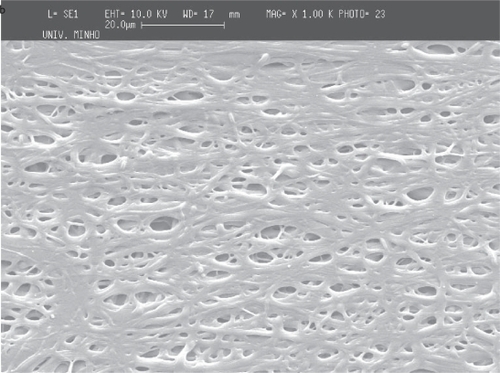
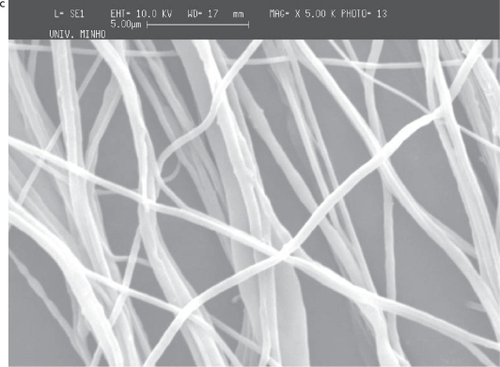
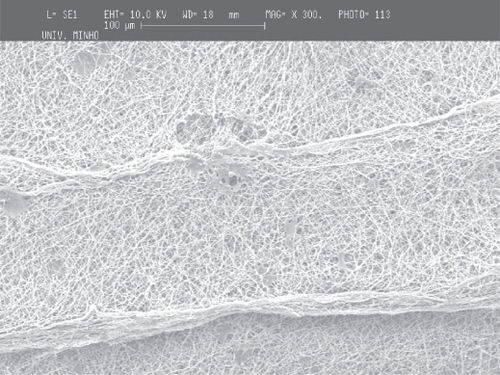
Figure 6 Deposition of PEO fiber meshes in a metallic wire net. The holes in the mesh structure (micrograph with lower magnification) are caused probably by moisture dissolving locally the PEO.
The deposition of the PCL and PEO polymers was performed on a metallic wire net collector. A thicker region (corresponding to a preferential deposition of the fibers) was obtained on top of the most protuberant wires of the net. Again the local electrical field may cause this preferential deposition. Those tests were conducted both for PCL and for PEO to show that the patterning process applies to different materials (see and ).
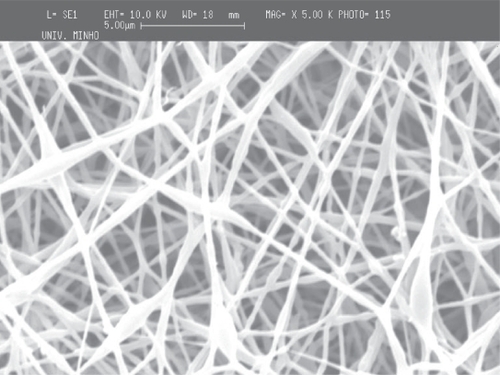
Figure 7 Deposition of PCL fiber meshes in a metallic wire net: a) macroscopic pattern of the fiber mesh, b) region of agglomeration of aligned fibers surrounded by random fibers and c) aligned fibers
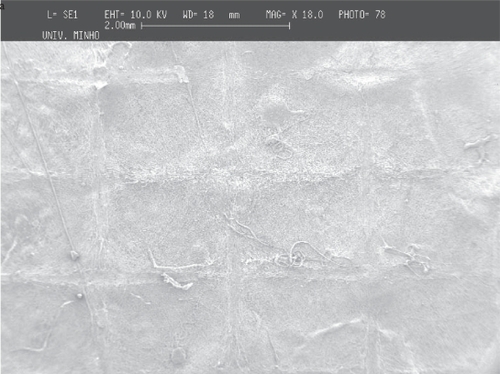
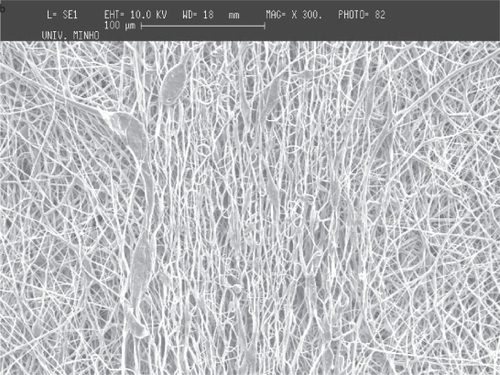

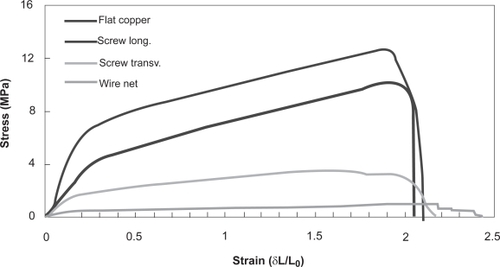
Figure 8 Typical plots of the stress-strain curves obtained for the various fiber meshes.
As in the screw collector, the architecture of the metallic wire net was reproduced in the meshes, the thicker areas corresponding to regions of highly aligned fibers. Those areas are characterized by significantly larger fiber densities, and it was observed that in those regions the fibers were deposited with random alignment.
The reproduction of the collector pattern is even more pronounced when PCL is processed. Furthermore, it was also observed that in the regions of the meshes corresponding to the most protuberant wires, the fibers are consistently aligned and have a larger density of deposition. The two orthogonal directions of the wire mesh are equally oriented and densified. Outside those areas, as observed in PEO meshes, the fibers are randomly aligned and have lower deposition densities.
No clear differences can be observed between the average fiber diameter in the randomly aligned areas of the meshes and in the aligned and denser areas. In both regions the average diameter of the fibers is of about 600 nm. An overall estimation of the average fiber diameter in the whole mesh for PCL is of about 650 nm.
Mechanical properties
The results obtained in tensile tests of PCL meshes are summarized in and in . Considering the tensile modulus of the fiber meshes, it was observed that the screw collector made it possible to obtain the stiffest fiber meshes. Those fiber meshes are considerably more compliant in transverse direction. This result confirms the importance of the alignment of the fibers in the mechanical properties of the fiber meshes obtained by electrospinning.
It is also important to observe that the meshes obtained with a flat copper collector have intermediate tensile modulus when compared with the previous discussed and this is a result of the random alignment of the fibers. Those meshes showed a very consistent behavior (see standard deviation of the tensile modulus data in ).
Because of the fiber high degree of alignment, it was somehow unexpected the observed tensile modulus obtained using the wire net collector. However, the orthogonal alignment of the fibers with high alignment of fibers transversely to the main tensile test direction may explain the very low value of the modulus. Those transverse aligned fibers will control the strain in the tensile test, causing a more compliant behavior.
The tensile strength data of the fiber meshes follow the same trends already discussed for the tensile modulus. The differences in the behavior among the various fiber meshes are less pronounced than in the case of the tensile modulus. It is important to point out that the strength is by its nature much more sensitive to local imperfections and defects in the structure, causing local stress concentration. Thus, this result is consistent with what was expected.
Regarding the maximum strain sustained by the fiber meshes, it should be highlighted that all fiber meshes have comparable values. This is also rather unusual since a stiffening of the materials causes a decrease in the maximum strain. It is very important in this discussion to keep in mind that the behavior of the fiber meshes is probably controlled by the properties of the fibers when aligned with the stress. However, when the fibers are less aligned the properties are very dependent on the local links existing between neighbour fibers which is caused by the presence of a solvent at the time of deposition in the collector.
The tensile tests show the typical curves obtained with electrospun fiber meshes (). The initial region of the curve corresponds to a deformation that stretches completely the mesh structure. The stress builds up beyond this region and this is where the maximum slope of the whole curve appears. The tensile moduli were derived from that region of the curve. After the yield point, the mesh continues to increase the stress, up to a maximum where the onset of failure is reached. Despite the variability associated with the mesh structures obtained by electrospinning, the curves obtained for different individual specimens within the same sample are qualitatively very consistent. That was observed for all the conditions tested.
Cell direct contact assays
The adhesion and proliferation of osteoblastic cells in the fiber meshes and their density and distribution on the materials surface were observed in SEM micrographs and using stereo optical microscopy by methylene blue staining after 7 days. Those assays were only performed in PCL fiber meshes, since the PEO meshes dissolved immediately when immersed in the culture medium.
The adhesion and proliferation of cells in PCL surfaces is normally difficult. The same behavior was observed with the fiber meshes. However, as shown in and the cells do adhere to the fiber mesh. The cells maintained the morphology during the period of study and it was observed that they proliferate and stretch to create links to the fiber mesh. The cells also adhere and adapt their shape to the local topography of the fiber meshes.
Figure 9 Adhesion of osteoblastic cells to PCL fiber meshes after 7 days in culture: a) flat copper plate, b) screw collector and c) wire net collector.
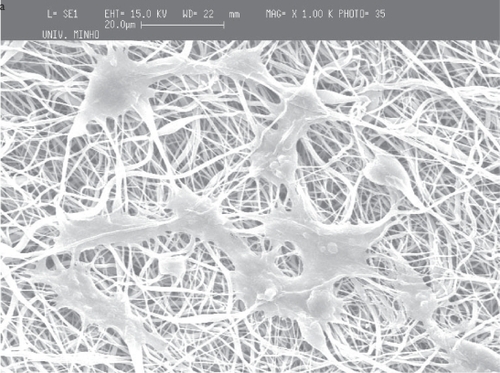
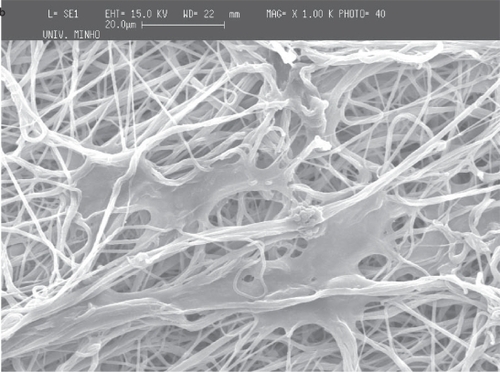
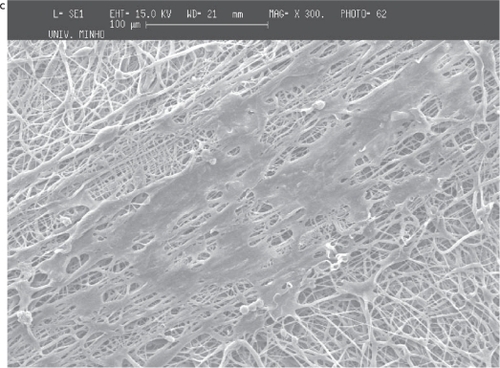
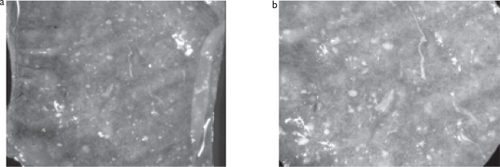
Figure 10 Stereo light microscope pictures of the cell density and distribution on the surface of PCL fiber meshes obtained with the screw collector stained with methylene blue. a) 25x magnification; b) 50x magnification.
It was also observed in some cases that the cells migrate to inner regions of the fiber mesh. However, the porosity of the mesh does not allow the cells to extensively colonize the inner regions of the fiber mesh.
From the SEM micrographs () it is shown that, in general, the adhesion of osteblastic is preferential in regions of random alignment of the fibers. However, in some cases it was observed that after 7 days some cells were aligned with the regions of higher orientation, thus the cells not being specifically or uniquely attracted by random regions.
From the micrographs taken under the stereo light microscope with Methylene blue staining () of meshes decorated with the morphology created by the screw collector, it can be observed that the cells tend to prefer attaching to the regions of random orientation. Those regions have a darker blue staining corresponding to larger cell densities whereas the regions of higher alignment have lighter blue stain. The pattern of alignment in the nanofibers seems to affect the preferential attachment of this cell line onto those specific surfaces of the PCL fiber meshes obtained using patterned collectors.
This observation however needs further study with other materials with different surface chemistry and with whom the cells have stronger initial affinity.
Conclusions
It was shown that patterned fiber meshes of PEO and PCL can be produced by electrospinning. The main parameter controlling the architecture of the pattern is the surface topography of the collector.
It is possible through this technique to control locally the pattern of alignment of the fibers. However, apart from the local topography details, the fiber meshes keep assuming the random orientation typical of electrospinning.
The patterns were reproduced with PEO and with PCL showing that the observations are not a unique characteristic of a specific material. The fibers in the meshes keep having average diameters in the submicron range.
The mechanical properties of the nanofiber meshes are very consistent. It was observed that the mechanical properties depend on the degree of alignment of the fibers in the mesh. Most of the meshes can be strained up to 200%.
Cell contacting experiments showed that the cells are viable when seeded in those fiber meshes and cultured up to 7 days. Generally, the osteoblastic cells react to the patterns showing some preference in cell adhesion for the regions of random alignment of the fibers in the patterns under study.
References
- BhattaraiNEdmondsonDVeisehO2005Electrospun chitosan-based nanofibers and their cellular compatibilityBiomaterials2661768415885770
- DerschRLiuTSchaperAK2003Electrospun nanofibers: Internal structure and intrinsic orientationJ Polym Sci Part A: Polym Chem4154553
- DoshiJRenekerDH1995Electrospinning Process and Applications of Electrospun FibersJ of Electrostatics3515160
- FongHRenekerDH2001Electrospinning and formation of nanofibersSalemDRStructure formation in polymeric fibersMunichHanser22546
- GibsonPSchreuder-GibsonH2004Patterned Electrospray Fiber StructuresIntern Nonwovens J23441
- HuangZMZhangYZKotakiM2003A review on polymer nano-fibres by electrospinning and their applications in nanocompositesComp Sci and Tech632223
- KattaPAlessandroMRamsierRD2004Continuous Electrospin-ning of Aligned Polymer Nanofibers onto a Wire Drum CollectorNano Letters422158
- LiDWangYXiaY2004Electrospinning Nanofibers as Uniaxially Aligned Arrays and Layer-by-Layer Stacked FilmsAdv Mat163616
- LiDOuyangGMcCannJT2005Collecting electrospun nanofibers with patterned electrodesNano Letters5913615884893
- LoscertalesIGBarreroAGuerreroI2002A. M. Micro/Nano Encapsulation via ElectriÞed Coaxial Liquid JetsScience2951695811872835
- MatthewsJAWnekGESimpsonDG2002Electrospinning of Collagen NanofibersBiomacromolecules3232811888306
- OndarcuhuTJoachimC1998Drawing a single nanofibre over hundreds of micronsEurophysics Letters4221520
- PhamQPSharmaUMikosAG2006Electrospinning of polymeric nanofibers for tissue engineering applications: A reviewTissue Engineering121197121116771634
- RenekerDHChunI1996Nanometer diameter fibres of polymer, produced by electrospinningNanotechnology721623
- ShinMYoshHVacantiJP2004Tissue Engineering103315009928
- SimonsHL1966 US patent 3 280 229
- SundarayBSubramanianVNatarajanTS2004Electrospinning of continuous aligned polymer fibersAppl Phys Lett8412224
- TeoWERamakrishnaS2005Electrospun fibre bundle made of aligned nanofibres over two fixed pointsNanotechnology16187884
- TheronAZussmanEYarinAL2001Electrostatic field-assisted alignment of electrospun nanofibresNanotechnology1238490
- WhitesidesGMGrzybowskiBA2002Dynamic Aggregation of Chiral SpinnersScience2967182111976449
- YangFMuruganRWangS2005Electrospinning of nano/micro scale poly(L-lactic acid) aligned fibers and their potential in neural tissue engineeringBiomaterials2626031015585263
- ZussmanETheronAYarinAL2003Formation of nanofiber crossbars in electrospinningAppl Phys Lett829735