
 ?Mathematical formulae have been encoded as MathML and are displayed in this HTML version using MathJax in order to improve their display. Uncheck the box to turn MathJax off. This feature requires Javascript. Click on a formula to zoom.
Abstract
Background:
Nonspecific tumor targeting, potential relapse and metastasis of tumor after treatment are the main barriers in clinical photodynamic therapy (PDT) for cancer, hence, inhibiting relapse and metastasis of tumor is significant issues in clinic.
Purpose:
In this work, chidamide as a histone deacetylases inhibitor (HADCi) was bound onto a pH-responsive block polymer folate polyethylene glycol-b-poly(aspartic acid) (PEG-b-PAsp) grafted folate (FA-PEG-b-PAsp) to obtain the block polymer folate polyethylene glycol-b-poly(asparaginyl-chidamide) (FA-PEG-b-PAsp-chidamide, FPPC) as multimodal tumor-targeting drug-delivery carrier to inhibiting tumor cell proliferation and tumor metastasis in mice.
Methods:
Model photosensitizer pyropheophorbide-a (Pha) was encapsulated by FPPC in PBS to form the polymer micelles Pha@FPPC [folate polyethylene glycol-b-poly(asparaginyl-chidamide) micelles encapsulating Pha]. Pha@FPPC was characterized by transmission electron microscope and dynamic light scattering; also, antitumor activity in vivo and in vitro were investigated by determination of cellular ROS level, detection of cell apoptosis and cell cycle arrest, PDT antitumor activity in vivo and histological analysis.
Results:
With favorable and stable sphere morphology under transmission electron microscope (TEM) (~93.0 nm), Pha@FPPC greatly enhanced the cellular uptake due to its folate-mediated effective endocytosis by mouse melanoma B16-F10 cells and the yield of ROS in tumor cells induced by PDT, and mainly caused necrocytosis and blocked cell growth cycle not only in G2 phase but also in G1/G0 phase after PDT. Pha@FPPC exhibited lower dark cytotoxicity in vitro and a better therapeutic index because of its higher dark cytotoxicity/photocytotoxicity ratio. Moreover, Pha@FPPC not only significantly inhibited the growth of implanted tumor and prolonged the survival time of melanoma-bearing mice due to both its folate-mediated tumor-targeting and selectively accumulation at tumor site by EPR (enhanced permeability and retention)effect as micelle nanoparticles but also remarkably prevented pulmonary metastasis of mice melanoma after PDT compared to free Pha, demonstrating its dual antitumor characteristics of PDT and HDACi.
Conclusion:
As a folate-mediated and acid-activated chidamide-grafted drug-delivery carrier, FPPC may have great potential to inhibit tumor metastasis in clinical photodynamic treatment for cancer because of its effective and multimodal tumor-targeting performance as photosensitizer vehicle.
Introduction
Photodynamic therapy (PDT) has been widely employed and shown effective modality in treating melanoma, breast cancer, superficial tumors.Citation1–Citation4 Although PDT develops rapidly in recent years, several deficiencies have still hampered the application of PDT in the clinic. Firstly, photosensitizers belong to non-specific drugs in molecular structure, and there is no specific drug target in tumor tissues. Hence, large doses utilized in clinics expose patients to potential systemic dark toxicity and local light toxicity. Secondly, it is very difficult to develop the drug for a great number of highly active photosensitizers such as pyropheophorbide-a (Pha), etc. because of their poor water-solubility and high dark toxicity. Thirdly, plenty of clinical data reveal a fact that activity of histone deacetylase (HDAC) in residual tumor cells significantly increases after treatment with PDT,Citation5–Citation7 which causes a fast proliferation of tumor cells, and finally probably lead to the relapse and metastasis of cancers.Citation8–Citation10 In addition, it has been proven that histone deacetylases inhibitor (HDACi) combined with PDT can potentiate PDT antitumor effect via down-regulating the activity of HDAC.Citation5,Citation11,Citation12 However, some defects of HADCi such as poor solubility, short half-life, and low efficiency of cellular uptake also hamper the development of HDACi in the clinic.Citation13–Citation15 Many HDACi even administrated at large doses cannot reach the effective concentration in target tissue before their degradation. Therefore, it is significant to explore the synergetic antitumor effect of photosensitizer and HDACi by fabricating both of them into a tumor-targeting water-soluble drug- delivery system to overcome the shortcomings of both above two kinds of drugs.
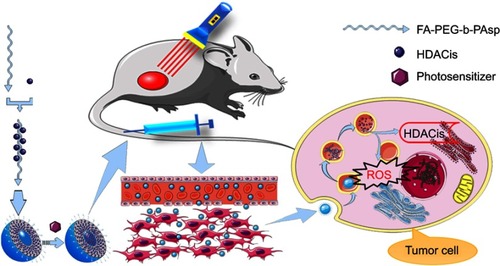
As illustrated in , a folate-mediated and pH-responsive chidamide-bound block polymer micelle-encapsulating pyropheophorbide-a (Pha) with tumor-targeting, acid-activation, and compartmental drugs release in endosome or lysosome was designed and fabricated to deliver the drugs to tumor sites. Namely, chidamide was bound onto pH-responsive polymer polyethylene glycol-b-poly(aspartic acid) (PEG-PAsp)Citation16 grafted folate (FA) (FA-PEG-PAsp) to obtain block polymer folate polyethylene glycol-b-poly(asparaginyl-chidamide) (FA-PEG-PAsp-chidamide, FPPC), followed by self-assembly with pyropheophorbide-a (Pha) to form the polymer micelles Pha@FPPC [folate polyethylene glycol-b-poly(asparaginyl-chidamide) micelle-encapsulating pyropheophorbide-a]. Among them, chidamide (Epidaza) was a HDACi developed wholly in China and approved by the Chinese FDA for relapsed or refractory peripheral T-cell lymphoma in 2014, and also being researched as a treatment for pancreatic cancer, breast cancer, and non-small cell lung cancer. In addition, pyropheophorbide-a was also taken as the model photosensitizer because of its good chemical stability and hydrophobic interaction with amphiphilic polymeric micelles.
Scheme 1 Illustration of self-assembly and acid-activated of drugs loading micelle.
Note: Self-assembly folate-mediated and pH-responsive chidamide-bound micelle-encapsulating pyropheophorbide-a Pha@FPPC was endocytosed into the tumor cell, and then endosome evolved into lysosome with pH decreasing to 5.0–5.3 which led an osmotic swelling and burst of lysosome to achieve a release of chidamide and pyropheophorbide-a into the cytoplasm resulting in respectively inhibition HDACs and production cytotoxic substances ROS after light irradiation at 660 nm. Abbreviations: FA-PEG-b-PAsp, folate polyethylene glycol-b-poly(aspartic acid); FPPC, folate polyethylene glycol-b-poly(asparaginyl-chidamide); Pha@FPPC, folate polyethylene glycol-b-poly(asparaginyl-chidamide) micelle encapsulating pyropheophorbide-a; HDACs, histone deacetylases; ROS, reactive oxygen species.
After tumor cellular uptake of the Pha@FPPC micelles through FA-receptor-mediated endocytosis,Citation17–Citation19 endosomes evolve into lysosome due to the proton pump effects in the membrane of endosomes.Citation20 Therefore, pH value of the lysosome finally could reach to 5.2 or even lower, and pH-responsive segment polymer poly(aspartic acid) (PAsp) was to turn to hydrophilicity from hydrophobicity in neutral solution, and Pha molecules were then directionally released in the lysosome from the micelles. Meanwhile, chidamide-grafted polymer was catalyzed by lipase to gradually release chidamide in the lysosome.
As a result, on the one hand, it should be expected that Pha@FPPC could improve water-solubility and tumor cellular uptake of Pha and chidamide, and directionally release Pha in tumor sites by acid-triggering in a tumor’s slightly acidic environment, resulting in enhancing PDT antitumor efficacy of free Pha due to both its folate-mediated tumor-targeting and selectively accumulation at tumor site by EPR (enhanced permeability and retention) effect as micelle nanoparticles.Citation21–Citation23 On the other hand, chidamide segment in Pha@FPPC could not only exert its own antitumor effect as an HDACi, but also augment PDT antitumor efficiency of Pha probably due to prevention the potential relapse and metastasis via inhibiting the elevated activity of HDAC induced by PDT. In a word, the purpose of this study was to verify and provide a dual tumor-targeting drug-delivery carrier for photosensitizer Pha to potentiate its PDT antitumor efficacy with inhibition tumor metastasis.
Materials and methods
Materials
Amino polyethylene glycol (PEG-NH2, MW=5000), L-aspartate-4-benzyl ester (H-Asp(OBzl)-OH), 1-(3-Dimethylaminopropyl)-3-Ethylcarbodiimide hydrochloride (EDCI), 2-(7-Azabenzotriazol-1-yl)-N,N,N’,N’-tetramethyluronium hexafluorophosphate (HATU), N-hydroxybenzotrizole (HOBt),N,N’-carbonyldiimidazole (CDI), Tetrahydrofuran (THF) and N,N-diisopropylethylamine (DIPEA) were purchased from Shanghai Aladdin Bio-Chem Technology Co., Ltd. (Shanghai, People’s Republic of China). Chidamide was purchased from Dalian Meilun Biotechnology Co., Ltd. (Dalian, People’s Republic of China). Folate amino polyethylene glycol (FA-PEG-NH2,MW=5000) was purchased from Shanghai Pengsheng Bio-technology Co., Ltd. (Shanghai, People’s Republic of China). Aniline, dichloromethane (DCM),N,N-dimethyl formamide, dimethyl sulfoxide (DMSO),ethyl acetate were purchased from Chinese Medicine Group Chemical Reagent Co., Ltd. (Shanghai, People’s Republic of China)
Cell culture
The human ovarian cancer cell line A2780, the mice malignant melanoma cells B16-F10, human umbilical vein endothelial cell (HUVEC) was purchased from Institute of Biochemistry and Cell Biology, Chinese Academy of Sciences (Shanghai, People’s Republic of China). All cells were incubated in RPMI 1640 culture medium supplemented with 10% fetal bovine serum and 1% penicillin–streptomycin at 37°C in a humidified environment with 5% CO2.
Preparation of Pha@FPPC and Pha@PPC
Folate polyethylene glycol-b-poly(asparaginyl-chidamide) (FA-PEG-b-PAsp-chidamide, FPPC) and polyethylene glycol-b-poly(asparaginyl-chidamide) (PEG-b-PAsp-chidamide, PPC) were synthesized as described in supplementary materials referring to literature method.Citation4,Citation24–Citation27 10 mg FPPC was dissolved in 3 mL of PBS (pH 7.4) and 1 mg Pha in 0.5 mL of THF was immediately added. The mixtures were openly stirred in dark atmosphere overnight, and then centrifuged at 5000 rpm for 15 mins. The supernatant liquor was the destination product Pha@FPPC micelles (FPPC micelles encapsulating Pha), and the precipitation was used to calculate Pha loading rate.
In addition, Pha@PPC micelles (PPC micelles encapsulating Pha) were similarly prepared in accordance with the above method using PPC in place of FPPC. Meanwhile, blank FPPC micelles were provided by dispersing FPPC into PBS (pH 7.4).
Determination of Pha loading efficiency
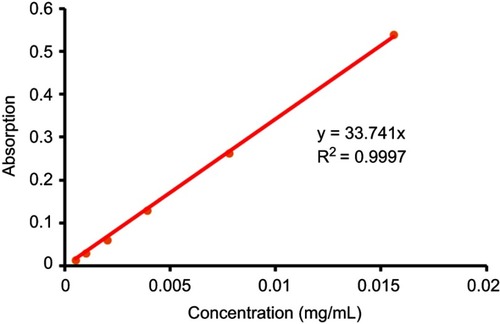
The above precipitation was dried by vacuum and then dissolved in 5 mL of DMSO to form the mother solution, following to be diluted by ten times with DMSO. The absorbance of the final solution at 405 nm was measured by UV/VIS via ELISA, following to figure out the concentration of Pha in DMSO mother solution of the precipitation (CPha,precipitation) according to the UV absorption standard curve at 405 nm of Pha (), and then the Pha loading rate was calculated as follows:
In this equation, mass of total Pha (mPha,total) and total FPPC (mFPPC,total) was 1.0 and 10 mg, respectively. Mass of Pha in the precipitation (mPha,precipitation) was obtained via CPha,precipitation multiplication by the total volume of mother solution.
Characterization of Pha@FPPC
The morphology of Pha@FPPC and FPPC micelles was dyed by uranyl acetate and observed under transmission electron microscope (TEM) (TecnaiG2 F20 S-Twin; FEI, Hillsboro, OR, USA). The size and diameter distribution of Pha@FPPC and FPPC micelles were measured by dynamic light scattering (DSL, ZEN3600, Malvern Panalytical, UK).
Drug release of Pha@FPPC
One milliliter of Pha@FPPC micelles in dialysis tube was dialyzed against release media (20 mL, PBS: DMSO: Tween-20=98: 1: 1; pH =5.2, 7.4, respectively) at 37°C. Drawn 1 mL of dialyzate at 0.5, 1, 2, 4, 8, 12, 24, 48, 60, 72 hrs, and replenished 1 mL of fresh release media timely. The absorbance of the samples at 405 nm was measured by UV/VIS via microplate reader to draw the accumulative release curve.
Cytotoxicity of Pha@FPPC in vitro
Ovarian cancer cell A2780, murine melanoma cell B16-F10, and normal cell HUVEC were chosen to access the cytotoxicity of Pha@FPPC, FPPC, and free Pha via Cell Counting Kit-8 (CCK-8). A total of 1×10⁴ cells the exponential stage were seeded into each well of six 96-well plates and incubated for 12 hrs. The culture medium was removed and 100 μL of photosensitizer loaded micelles Pha@FPPC, Pha@PPC, and free Pha at different concentration gradients in the culture medium were then added into the plates, respectively. After incubating for 24 hrs in a dark environment, the culture medium was removed and complete culture medium was replenished. Whether receiving irradiation with the diode laser at 660 nm for 378 s at a power density of 25 mW/cm2 (ie, PDT at a light dose of 9.45 J/cm2) or not, cells were incubated for another 24 hrs. The above loading media were removed, and the cells were then fed 100 μL of new culture medium with 10%CCK-8 and incubated for 1.5 hrs. The cell viability was assessed by CCK-8 assay (Dojindo Laboratories, Japan) according to the manufacturer’s protocol. The absorbance of each well was monitored by a microplate reader (ELx800; BioTek, Winooski, VT, USA) at 450 nm followed to calculate the dark cytotoxicity and photocytotoxicity of the samples, respectively.
Cellular uptake and tumor cell targeting
B16-F10 cells at exponential phase with a concentration of 2.5×10⁵/mL were seeded on confocal plates. After incubating for 24 hrs, the culture medium was removed and the fresh culture media individually containing 5 μM of Pha@FPPC, Pha@PPC and free Pha were, respectively, added into the plates. After incubating for 24 hrs, the culture medium was removed and the fresh culture media individually containing 5 μM of Pha@FPPC, Pha@PPC and free Pha were, respectively, added into the plates. After 2 hrs, the cells in each plate were washed by PBS for three times and fixed by 4% paraformaldehyde for 20 mins. Then, the cells were stained by 2-(4-Amidinophenyl)-6-indolecarbamidine dihydrochloride (DAPI) for 20 mins, washed by PBS for three times, dispersed in 0.5 mL of PBS, and finally inspected under laser confocal microscopy. The cell nucleus dyed by DAPI and intracellular Pha could emit blue fluorescence and red fluorescence, respectively.
Determination of cellular ROS level
The protocol of reactive oxygen species (ROS) level determination was conducted as literature reported.Citation28–Citation30 In brief, a total of 5×10⁵ B16-F10 cells at the exponential stage were seeded into six-well plates. After incubating for 12 hrs, the culture medium was removed. The cells with PDT-treated were added 0.1 μM of Pha@FPPC, FPPC, and Pha in RPMI-1640 medium, respectively, and the other cells without PDT-treated were added 0.3 μM of the above samples. After incubating for 24 hrs, 10 mM of 2′, 7′-dichlorodihydrofluorescin diacetate (DCFH-DA, 1 μL) was added into each well for 1 hr. All the cells were washed by PBS for three times, and replenished 2 mL of complete medium. The cells with PDT-treated were irradiated by the diode laser at 660 nm with a light dose of 9.45 J/cm2. All the cells were kept in dark for 20 mins and then cellular ROS level was detected via flow cytometry (λex=488 nm, λem=525 nm).
Detection of cell apoptosis and cell cycle arrest
A total of 2.5×10⁵ B16-F10 cells at the exponential stage were seeded into two six-well plates overnight and then the culture medium was removed. According to the cytotoxicity of Pha previously determined, the cells without PDT-treated were individually added into 10 μM of Pha@FPPC and Pha while the cells with PDT-treated were, respectively, added into 0.15 μM of Pha@FPPC, FPPC, Pha and 0.5 μM of Pha@FPPC and Pha, following to receive irradiation by the diode laser at 660 nm with a light dose of 9.45 J/cm2. After incubating for 24 hrs, all the cells were collected to detect the apoptosis with FITC-AnnexinV/PI kit and the cell cycle arrest with EZCellTM Cell Cycle Analysis Kit by flow cytometry (BD FACS Calibur, USA).
PDT antitumor activity in vivo and histological analysis
C57BL/6J (18–20 g) male mice were purchased from Shrek Animal Co. Ltd. (Shanghai, People’s Republic of China). All animal experiments were conducted in compliance with the Guiding Principles for the Care and Use of Laboratory Animals, the Second Military Medical University. Protocols were approved by the Institutional Animal Care and Use Committee of the Second Military Medical University. Mice-bearing melanoma models were prepared by injecting a total of 1×10⁵ B16-F10 cells in a 100 μL of culture medium into right hind leg subcutaneously. Till the tumor volume reached ~80 mm3, mice were randomly divided into five groups (five mice in each group): saline group (negative control), Pha@FPPC group, Pha@PPC group, FPPC group, and free Pha group. Tumors in each group were irradiated by the diode laser at 660 nm with a power density of 300 mW/cm2 for 360 s (ie, light dosage:90 J/cm2) at 45 mins after drug administration via tail intravenous injection with a dosage of 2 mg/kg. Tumor volumes and the survival rate of mice bearing B16-F10 melanoma were observed. The mice were given free access to food and water during the experiment.
The intact lung from the first dead tumor-bearing mouse in every group was excised, fixed in 4% paraformaldehyde. After the metastatic nodules on lung surface were observed, the lung tissue was paraffin embedded, sectioned, and stained with hematoxylin and eosin (H&E) for microscopic analysis (Olympus CKX41-A22PHP).
Statistical analysis
The statistical significance between the cytotoxicities for Pha@FPPC, Pha, and FPPC in vitro was evaluated using the Student’s t-test. The statistical significance of tumor volume between the two groups was conducted in GraphPad Prism 5.0 by two-way ANOVA. The mice survival curve was analyzed by Log-rank (Mentel of Cox) Test. A P-value below 0.05 was considered to be statistically significant for all analyses.
Results and discussion
Preparation and characterization of Pha@FPPC
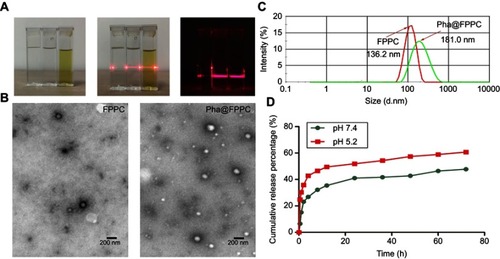
Pha@FPPC micelles were successfully prepared in PBS (pH 7.4), and observed Tyndall Phenomenon in dark (). Morphology of Pha@FPPC micelles under the TEM emerged as favorable sphere morphology (~93.0 nm) with good dispersion in PBS (). Moreover, Pha@FPPC micelles had higher stability than blank FPPC micelles because of their higher scattering light intensity () and better-dispersed sphere morphology (), suggesting that encapsulating Pha could stabilize the micelles due to the hydrophobic interaction between Pha and PAsp segments at a neutral pH. In addition, the hydrodynamic diameters of Pha@FPPC and blank FPPC micelles at pH 7.4 were 181.0 nm and 136.2 nm, respectively ()
Figure 1 Characterization, Pha loading and release performance of samples.
Note: (A) Tyndall phenomenon of samples (from left to right in each picture: water, FPPC micelles, Pha@FPPC micelles); (B) the TEM images of blank FPPC micelles (left) and Pha@FPPC (right), Scale bar =200 nm; (C) sizes of Pha@FPPC and blank FPPC under dynamic light scattering; (D) pH responsiveness release curve of Pha from Pha@FPPC in vitro.
Abbreviations: FPPC, folate polyethylene glycol-b-poly(asparaginyl-chidamide); Pha, pyropheophorbide-a; Pha@FPPC, folate polyethylene glycol-b-poly(asparaginyl-chidamide) micelle encapsulating pyropheophorbide-a; TEM, transmission electron microscope.
Determination of Pha loading efficiency and pH-responsive drug release in vitro
Pha loading rate of Pha@FPPC prepared in PBS at pH 7.4 was 4.67%. As shown in , the pH-responsive release of Pha in Pha@FPPC micelles was measured in PBS at different pH conditions (pH 7.4, 5.2) by simulating the normal drug-delivery microenvironment and acidic microenvironment of endosome or lysosome in tumor cells. In the condition of pH 5.2, 57.39% of Pha was released from Pha@FPPC at 48 hrs, while only ~42.78% of Pha was released from Pha@FPPC even over 48 hrs at pH 7.4. In neutral conditions, PAsp segments were hydrophobic tight core encapsulating Pha in the micelles. On the contrary, in acidic conditions, the PAsp segments became hydrophilic and loose chains to result in exposing Pha to the cytoplasm (pH 5.1–5.4). Hence, PAsp segments actually potentiated acid-activation of the micelles and made a faster release of Pha from Pha@FPPC micelles in the cytoplasm.
Cytotoxicity of Pha@FPPC in vitro
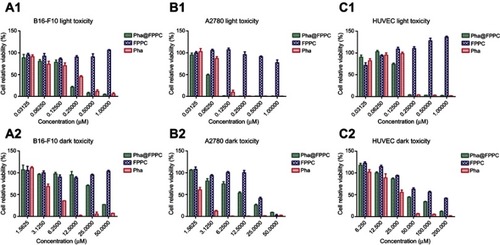
Dark and light cytotoxicity of Pha@FPPC were evaluated via CCK-8 assay against B16-F10, A2780 , and HUVEC cells. As shown in and , Pha@FPPC had lower dark cytotoxicity against B16-F10 or A2780 cells than Pha (B16-F10: P<0.0001, A2780: P=0.0004). Moreover, Pha@FPPC had a higher light cytotoxicity against A2780 cells than free Pha (P=0.0008), while Pha@FPPC showed comparable light cytotoxicity against B16-F10 cells to free Pha (P=0.4848), demonstrating that Pha@FPPC could significantly decrease the dark cytotoxicity of Pha and had a better therapeutic index because of its higher dark cytotoxicity/photocytotoxicity ratio (ie, 204.8 for B16-F10 cells and 204.7 for A2780 cells) compared to free Pha (ie, 25.4 for B16-F10 cells and 20.6 for A2780 cells). In addition, the polymer carrier FPPC displayed certain dark cytotoxicity to tumor cells (ie, IC50 value: 23.82±1.96 μM for A2780 cells) due to its ingredients of chidamide as an HDACi. Moreover, because polymeric carrier FPPC containing folate (FA) was expected to be able to identify abundant FA receptors of the tumor cell surface and transfect cells by receptor-mediated endocytosis, Pha@FPPC exhibited higher dark cytotoxicity to tumor cell (ie, IC50 value: 34.61±3.22 μM for B16-F10 cells and 12.69±1.71 μM for A2780 cells) compared to normal healthy HUVEC cell (ie, IC50 value: 56.88±11.60 μM), indicating its tumor cell targeting.
Table 1 Cytotoxicity for Pha@FPPC, Pha and FPPC in vitro (IC50, μM)
Figure 2 Cytotoxicity of Pha@FPPC in vitro.
Note: Relative viabilities of B-16-F10 (A1, A2), A2780 (B1, B2), and HUVEC (C1, C2) cells were analyzed by CCK-8 assay after treatment by various concentrations of Pha@FPPC, Pha, and FPPC with or without light irradiation at 660 nm on a dosage of 9.45 J/cm2. The data were shown as the mean ± standard deviation (n=3).
Abbreviations: FPPC, folate polyethylene glycol-b-poly(asparaginyl-chidamide); Pha, pyropheophorbide-a; Pha@FPPC, folate polyethylene glycol-b-poly(asparaginyl-chidamide) micelles encapsulating pyropheophorbide-a.
Cellular uptake and tumor cell targeting
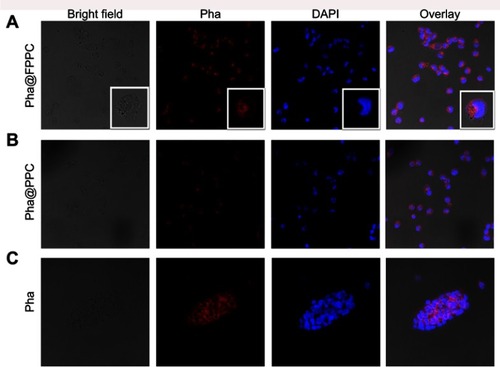
High efficient cellular uptake is a crucial premise for drug-delivery system in vivo. As shown in , Pha@FPPC and Pha@PPC were both well uptaken into B16-F10 cells and distributed in cytoplasm around the cell nucleus (). Moreover, Pha@FPPC in cells had stronger red fluorescence intensity under the same concentration compared to Pha@PPC in cells, suggesting that cellular uptake for Pha@FPPC was reinforced by folate receptor of the tumor cell surface-mediated endocytosis due to its ingredients of folate (the maximum fluorescence intensity of each group based on related to cellular uptake provided in ). Additionally, as a lipophilic photosensitizer, free Pha mainly was distributed in B16-F10 cell membrane, and the integrity of cytomembrane was destroyed probably because of its dark cytotoxicity (IC50=4.72 μM, shown in ), resulting in that cells were inclined to aggregate (). These were quite the visualized images further demonstrated that Pha@FPPC and Pha@PPC micelles could significantly decrease the dark cytotoxicity of free Pha.
Figure 3 Cellular uptake and tumor cell targeting of Pha@FPPC in vitro.
Note: Fluorescence images of B16-F10 cells under laser confocal microscopy after co-incubation with 5 μM of Pha@FPPC, Pha@PPC, and Pha for 2 hrs. Scale bar =50 μm. The cell nucleus stained by DAPI emits blue fluorescence at the excitation wavelength of 358 nm, and Pha uptake by cells emits red fluorescence at the excitation wavelength of 633 nm.
Abbreviations: Pha, pyropheophorbide-a; Pha@FPPC, folate polyethylene glycol-b-poly(asparaginyl-chidamide) micelles encapsulating pyropheophorbide-a; Pha@PPC, polyethylene glycol-b-poly (asparaginyl-chidamide) micelles encapsulating pyropheophorbide-a; DAPI, 2-(4-Amidinophenyl)- 6-indolecarbamidine dihydrochloride.
Detection of cell apoptosis, cellular ROS level, and cell cycle arrest
Cell apoptosis was detected by flow cytometry (BD FACS Calibur, USA) and shown in . Compared to control (), Pha@FPPC showed hardly any cytotoxicity on B16-F10 cells at a dose of 10 μM () without light irradiation while free Pha, whose cell necrosis rate was 96.73%, nearly killed all the cells at this dosage (), demonstrating that the drug loading micelles could significantly decrease the dark cytotoxicity of Pha which was always the main shortcoming of photosensitizers. Cell necrosis rates for 0.15 μM of Pha@FPPC and free Pha with light irradiation was, respectively, 95.45% and 52.36% (), which meant that Pha@FPPC could significantly decreased the effective PDT therapeutic concentration of Pha due to the synergistic effect of the chidamide segment. In addition, FPPC with light irradiation also displayed scarcely any cytotoxicity () at a dose of 0.5 μM compared to control (). All the above results were in accordance with previous cytotoxicity data measured by CCK-8 assay for Pha@FPPC, FPPC, and free Pha. Interestingly, there was a notable fact that few cell apoptosis was found in this experiment, suggesting that necrocytosis was probably the main mechanism of cell death induced by Pha@FPPC after PDT.
Figure 4 The mechanism of B16-F10 cells death induced by Pha@FPPC after PDT.
Notes: The apoptosis (A), ROS level (B), and cell cycle arrest (C) of B16-F10 cells detected by flow cytometry after treatment by Pha@FPPC, FPPC, and free Pha without (“-”) or with 660 nm light irradiation (“+”) at a dosage of 9.45 J/cm2.
Abbreviations: PDT, photodynamic therapy; Pha, pheophorbide-a; Pha@FPPC, folate polyethylene glycol-b-poly(asparaginyl-chidamide) micelles encapsulating pyropheophorbide-a; FPPC, folate polyethylene glycol-b-poly(asparaginyl-chidamide); FITC, fluorescein isothiocyanate; PI, propidium iodide; ROS, reactive oxygen species.
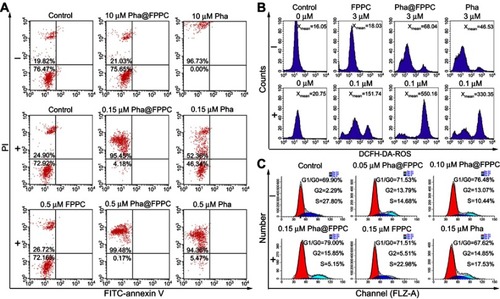
ROS is a critical factor in PDT. Mechanism of B16-F10 cells death induced by Pha@FPPC after PDT was further investigated by measuring the intracellular ROS level (). Non-fluorescent probe DCFH-DA could freely penetrate plasma lemma into the cytoplasm where it was hydrolyzed into 2′, 7′-dichlorodihydrofluorescin (DCFH). By reacting with intracellular ROS, DCFH was oxidized to fluorescent matter 2′, 7′-dichlorofluorescin (DCF), which could be used to measure the amount of ROS via fluorescence intensity count. As shown in , the average fluorescence intensity in B16-F10 cells treated by 0.1 μM of FPPC, Pha@FPPC and free Pha with light irradiation was, respectively, 151.7 (Figure 4B6), 550.2 () and 330.4 () while that treated by 3.0 μM of FPPC, Pha@FPPC, and free Pha without light irradiation was individually 18.0 (), 68.0, () and ~46.5 (), indicating that FPPC, Pha@FPPC, and free Pha all could greatly improve ROS amount in cells after PDT. Moreover, compared with free Pha, Pha@FPPC micelles significantly increased the yield of ROS in cells under the same drug dosage and light dosage conditions probably because endocytosis was enhanced by the proton sponge effect of the micelles to result in a higher cellular concentration of Pha.
As shown in , compared with control (), the B16-F10-cells treated with free Pha (0.15 μM) after PDT were blocked in G2 phase (), which was in accordance with literature report,Citation31,Citation32 and all the cells treated with Pha@FPPC after PDT were blocked not only in G2 phase like free Pha but also in G1/G0 phase like chidamide.Citation33,Citation34
PDT antitumor efficacy of Pha@FPPC in vivo and histopathology analysis
Antitumor therapeutic effects of Pha@FPPC-mediated PDT at a light dosage of 90 J/cm2 and drug dosage of 2 mg/kg were investigated by measuring tumor volume and survival period of C57/6J mice bearing B16-F10 melanoma in five groups (control, Pha@FPPC, Pha@PPC, FPPC, and Pha) (). Compared with the control group, on day 3 after PDT, Pha@FPPC, and Pha@PPC groups initiated significant difference (P<0.01 and P<0.05, respectively), while other groups indicated significant difference on day 4–6 in variety, demonstrating encapsulation of Pha into drug-delivery carrier FPPC could significantly enhance the PDT antitumor effect of Pha in vivo due to EPR effect of tumor as micelle nanoparticles.Citation21–Citation23 On day 7 after PDT, the destiny Pha@FPPC group showed a significant difference compared with every other group, indicating the advantage of folate-targeting strategy in retarding tumor proliferation due to its FA-mediated tumor targeting.Citation17–Citation19 Additionally, compared with the control group, the FPPC group showed significant difference on day 5 after PDT, hinting the antitumor effect of chidamide bound to the polymer vehicle.
Figure 5 PDT antitumor efficacy of Pha@FPPC on mice bearing B16-F10 melanoma in vivo.
Notes: (A) Mice bearing B16-F10 melanoma irradiated by the diode laser at 660 nm with a light dosage of 90 J/cm2 at 45 mins after intravenous administration with a drug dosage of 2 mg/kg; (B) tumor growth curve (*Represented the differences of control group vs every other group, and # represented the differences of Pha@FPPC vs every other group, *P, #P<0.05, **P, ##P<0.01 and ***P, P<0.001); (C) survival curves of C57BL/6J (control vs Pha@FPPC, *P=0.0127; control vs Pha@PPC, *P=0.0499; Pha@FPPC vs Pha, #P=0.0471; Pha@FPPC vs FPPC, &P=0.0364), the data were shown as the mean ± standard deviation, n=5; (D) the posteroanterior photographs of lung tissues with metastatic nodules of the first dead mice bearing B16-F10 melanoma in each group after PDT. (E) Microscopic images obtained by H&E staining of the lung sections from the first dead mice bearing B16-F10 melanoma in each group after PDT (×40).
Abbreviations: PDT, photodynamic therapy; Pha, pheophorbide-a; Pha@FPPC, folate polyethylene glycol-b-poly(asparaginyl-chidamide) micelles encapsulating pyropheophorbide-a; Pha@PPC, polyethylene glycol-b-poly(asparaginyl-chidamide) micelles encapsulating pyropheophorbide-a; FPPC, folate polyethylene glycol-b-poly(asparaginyl-chidamide).
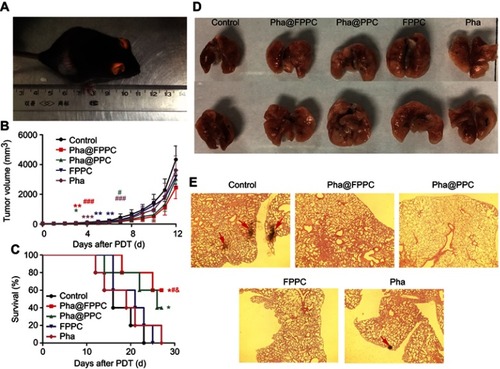
Furthermore, the mice survival curve also showed that the mice survival period of Pha@FPPC and Pha@PPC groups was both significant prolonged compared to the negative control group (P<0.05), while there was also no significant difference on the survival time between free Pha group and control group (P>0.05). It is noticeable that Pha@FPPC group showed a significant difference in prolonging the mice survival time compared with the free Pha group, while there was no difference between Pha@PPC group and free Pha group, which indicated the advantage of a folate-targeting strategy in the drug-delivery system.
With high rates of metastasis, mice melanoma often invaded other organs especially lungs. Accordingly, the pulmonary nodules in mice bearing melanoma were usually used to evaluate the degree of tumor metastasis. As shown in , no tumor node was found in melanoma-bearing mice lung from Pha@FPPC, Pha@PPC, and FPPC groups after PDT, while there were nodes in mice lungs from free Pha and control groups after PDT. Moreover, microscopic histological images of the H&E-stained lung tissue slices taken from above melanoma-bearing mice also showed typical metastatic nodules of tumor in control group and free Pha after PDT, while no visual nodules appeared in lung histological images from Pha@FPPC, Pha@PPC, and FPPC groups after PDT (). The above histological experiment results revealed that entrapment of Pha into drug-delivery carrier FPPC or PPC could significantly prevent metastasis of cancers in vivo due to the antineoplastic effect of chidamide as HDACi.
Conclusion
In the present study, a novel folate-mediated and pH-responsive chidamide-bound polymer micelles folate polyethylene glycol-b-poly(asparaginyl-chidamide) (FPPC) was successfully developed as a multimodal tumor-targeting drug-delivery carrier for photosensitizer Pha. Pha was well entrapped into FPPC in PBS (pH 7.4) to form Pha@FPPC micelles via the interaction between the hydrophobic layer of PAsp segments and Pha in the near neutral solution. The Pha@FPPC (FPPC polymer micelles encapsulating Pha) emerged as favorable sphere morphology under the TEM (~93.0 nm) with good dispersion and stability in PBS (pH 7.4) and could be well released in vitro at pH value of 5.2. After tumor cellular untaken by FA-receptor-mediated endocytosis,Citation18–Citation20 PAsp segments became hydrophilic, responding to the acidic pH of endosomes or lysosome, and Pha was rapidly released from unlocked FPPC into the cytoplasm. Therefore, the drug-delivery carrier FPPC could effectively increase the therapeutical concentration of hydrophobic photosensitizer Pha in the tumor site and decrease the systemic cytotoxicity of Pha and chidamide. Consequently, as we expected, compared with free Pha, Pha@FPPC micelles greatly enhanced the cellular uptake and the yield of ROS in tumor cells induced by PDT, and mainly caused necrocytosis and blocked cell growth cycle not only in G2 phase like free Pha but also in G1/G0 phase like chidamide after PDT. In addition, Pha@FPPC micelles had lower dark cytotoxicity against B16-F10 and A2780 cells and a better therapeutic index because of its higher dark cytotoxicity/photocytotoxicity ratio. More encouragingly, Pha@FPPC not only significantly strengthened the PDT antitumor efficacy on B16-F10-bearing mice of free Pha due to both its FA-mediated tumor-targetingCitation17–Citation19 and EPR effect of tumor as micelle nanoparticlesCitation21–Citation23 but also remarkably prevented pulmonary metastasis of mice melanoma due to chidamide segment as a HDACi, resulting in a significant synergistic antitumor effect of photosensitizer and HDACi. All in all, as a new modality of photodynamic therapy, folate-mediated and acid-activated chidamide-grafted drug-delivery polymer micelles, Pha@FPPC indeed have great potential to inhibit tumor metastasis and relapse in clinical photodynamic treatment.
Disclosure
The authors report no conflicts of interest in this work.
Supplementary materials
Synthesis of folate polyethylene glycol (PEG)-b-poly(asparaginyl-chidamide) (FA-PEG-b-PAsp-chidamide, FPPC)
Synthesis of L-aspartate benzyl ester-N-carboxylic acid anhydride (BLA-NCA)
L-Aspartic acid-4-benzyl ester (BLA, 4.7 g, 0.02 mol) was dissolved in 60 mL of anhydrous THF and triphosgene (6.0 g, 0.02 mol) was then added and allowed to stir at 60°C until the mixture solution turned clear. After evaporation of the solvent, the residue was re-crystallized with chloroform and n-hexane at 0°C to provide BLA-NCA as white crystal solid.
Synthesis of folate polyethylene glycol-b-poly(aspartic acid benzyl ester) (FA-PEG-b-PBLA)
FA-PEG-NH2 (0.1 g) was dissolved in 10 mL anhydrous DCM and BLA-NCA (1.0 g) in 30 mL of DCM was then added. The reaction mixture was stirred at room temperature under N2 for 72 hrs. The mixture solution washed successively by H2O and saturated brine, dried over anhydrous Na2SO4, and filtrated. After evaporation of the solvent, the residue was then re-crystallized with DCM and ether (Et2O) at 0°C to provide FA-PEG-b-PBLA as a light yellow powder.
Synthesis of folate polyethylene glycol-b-poly(aspartic acid) (FA-PEG-b-PAsp)
FA-PEG-b-PBLA (1.0 g) was dissolved in a mixed solution (25 mL THF and 25 mL 1M NaOH aqueous solution) and stirred at 35°C for 10 hrs. Then, the concentrated mixture was dialyzed in purified water to provide FA-PEG-b-PAsp as brown fluffy powder.
Conjugation of chidamide and FA-PEG-b-PAsp
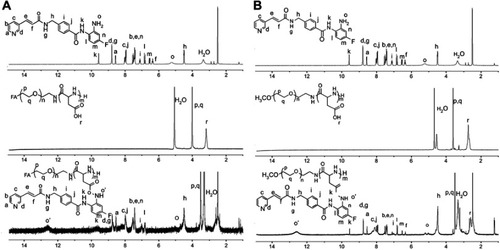
FA-PEG-b-PAsp (0.2 g) was dissolved in 10 mL anhydrous DCM and chidamide (0.243 g), HATU (0.238), and DIPEA (0.1 mL) was then added and stirred at room temperature. Then, the concentrated mixture was dialyzed in purified water for 48 hrs to provide FPPC as brown fluffy powder(1HNMR in ).
Meanwhile, polymer polyethylene glycol-b- poly(asparaginyl-chidamide) (PEG-b-PAsp-chidamide, PPC) was synthesized in a similar process only by replacement FA-PEG-NH2 with PEG-NH2 in step two(1HNMR in ).
Figure S1 1HNMR of (A:FPPC and B: PPC).
Establishment of standard curves
1 mg Pha was dissolved in 1 mL DMSO, doubling diluted. 100 μL solution of each sample was then transferred to 96-well plates, and triple duplicate wells for each concentration, and the absorbance of each concentration was measured via ELIASA at 405 nm. Finally, the standard curve was established according to the absorbances (Abs) ().
Figure S2 Standard curve of Pha.
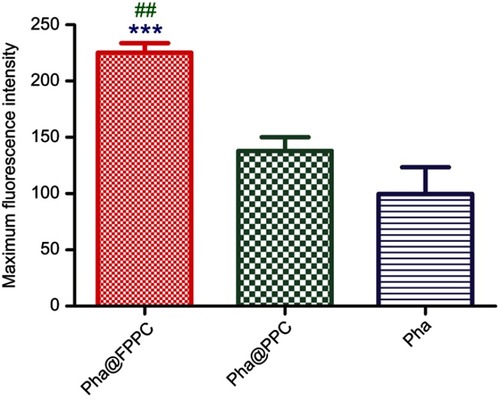
Analysis of maximum fluorescence intensity on Cellular uptake images
Maximum fluorescence intensity of three individual cells from each group in was detected and analyzed by Image J. (National Institutes of Health, US, version: 1.4.3.67). Due to the high cytotoxicity of free Pha and cell images overlaid, cells in free Pha group were chosen from mono-cell area.
Figure S3 Maximum fluorescence intensity of Pha (Turkey’s Multiple comparison Test, Pha@FPPC vs control ***P<0.001, Pha@FPPC vs Pha@PPC ##P<0.01).
Acknowledgments
This work was financially supported by grants from Shanghai Municipal Planning Commission of Science Research Fund for Youth Project (2016Y0039), Shanghai Natural Science Foundation (16ZR1444200), and National Natural Science Foundation of General Program (21778022) and Youth Program (81603124).
References
- Liu L, Xie H, Mu L, et al. Functional chlorin gold nanorods enable to treat breast cancer by photothermal/photodynamic therapy. Int J Nanomedicine. 2018;13:8119–8135. doi:10.2147/IJN.S18697430555230
- Wu P, Lin C, Lin C, et al. Methylene-blue-encapsulated liposomes as photodynamic therapy nano agents for breast cancer cells. Nanomaterials. 2019;9(1):14–25. doi:10.3390/nano9010014
- Doix B, Bastien E, Rambaud A, et al. Preclinical evaluation of white led-activated non-porphyrinic photosensitizer OR141 in 3D tumor spheroids and mouse skin lesions. Front Oncol. 2018;8:393. doi:10.3389/fonc.2018.0039330298119
- Nackiewicz J, Kliber-Jasik M, Skonieczna M. A novel pro-apoptotic role of zinc octacarboxyphthalocyanine in melanoma me45 cancer cell’s photodynamic therapy (PDT). J Photochem Photobio B. 2019;190:146–153. doi:10.1016/j.jphotobiol.2018.12.002
- Halaburková A, Jendželovský R, Kovaľ J, et al. Histone deacetylase inhibitors potentiate photodynamic therapy in colon cancer cells marked by chromatin-mediated epigenetic regulation of CDKN1A. Clin Epigenet. 2017;9(1):62–77. doi:10.1186/s13148-017-0359-x
- Li P, Tsai Y, Lee M, et al. Increased histone deacetylase activity involved in the suppressed invasion of cancer cells survived from ALA-mediated photodynamic treatment. Int J Mol Sci. 2015;16(10):23994–24010. doi:10.3390/ijms16102399426473836
- Zakaria S, Gamal-Eldeen AM, El-Daly SM, et al. Synergistic apoptotic effect of Doxil® and aminolevulinic acid-based photodynamic therapy on human breast adenocarcinoma cells. Photodiagn Photodyn. 2014;11(2):227–238. doi:10.1016/j.pdpdt.2014.03.001
- Wang Y, Hu Y, Wu Z, et al. Latent role of in vitro Pb exposure in blocking A β-clearance and triggering epigenetic modifications. Environ Toxicol Phar. 2019;66:14–23. doi:10.1016/j.etap.2018.12.015
- Andrew J, Katherine M, Ruchi P, et al. Targeting mitochondrial hexokinases increases efficacy of histone deacetylase inhibitors in solid tumor models. Exp Cell Res. 2019;375(2):106–112. doi:10.1016/j.yexcr.2018.12.01230579954
- Lewis K, Jordan H, Tollefsbol T. Effects of SAHA and EGCG on growth potentiation of triple-negative breast cancer cells. Cancers. 2019;11(1):23–44. doi:10.3390/cancers11010023
- Zhang F, Chen Z, Shao C, et al. Is level of acetylation directly correlated to radiation sensitivity of cancer cell? Mutat Res Fund Mol Mech Mutagen. 2019;813:13–19. doi:10.1016/j.mrfmmm.2018.11.001
- Groselj B, Sharma NL, Hamdy FC, et al. Histone deacetylase inhibitors as radiosensitisers: effects on DNA damage signalling and repair. Br J Cancer. 2013;108:748–754. doi:10.1038/bjc.2013.2123361058
- Babu A, Kamaraj M, Basu M, et al. Chemical and genetic rescue of an ep300 knockdown model for rubinstein taybi syndrome in zebrafish. Biochim Biophys Acta Mol Basis Dis. 2018;1864(4):1203–1215. doi:10.1016/j.bbadis.2018.01.02929409755
- Li Y, Seto E. HDACs and HDAC Inhibitors in cancer development and therapy. Csh Perspect Med. 2016;6(10):1–24.
- Bahhaj FE, Denis I, Pichavant L, et al. Histone deacetylase inhibitors delivery using nanoparticles with intrinsic passive tumor targeting properties for tumor therapy. Theranostics. 2016;6(6):795–807. doi:10.7150/thno.1372527162550
- Zeng S, Xiong MP. Trilayer micelles for combination delivery of rapamycin and siRNA targeting Y-box binding protein-1 (siYB-1). Biomaterials. 2013;34(28):6882–6892. doi:10.1016/j.biomaterials.2013.05.01023768780
- He J, Duan S, Yu X, et al. Folate-modified chitosan nanoparticles containing the IP-10 gene enhance melanoma-specific cytotoxic CD8(+)CD28(+) T lymphocyte responses. Theranostics. 2016;6:752–761. doi:10.7150/thno.1452727022421
- Kang JH, Battogtokh G, Ko YT. Folate-targeted liposome encapsulating chitosan/oligonucleotide polyplexes for tumor targeting. AAPS PharmSciTech. 2014;15:1087–1092. doi:10.1208/s12249-014-0136-524848761
- Wang H, Sheng W. (131)I-traced PLGA-lipid nanoparticles as drug delivery carriers for the targeted chemotherapeutic treatment of melanoma. Nanoscale Res Lett. 2017;12:365. doi:10.1186/s11671-017-2140-728532129
- Jin M, Jin G, Kang L, et al. Smart polymeric nanoparticles with pH-responsive and PEG-detachable properties for co-delivering paclitaxel and survivin siRNA to enhance antitumor outcomes. Int J Nanomedicine. 2018;13:2405–2426. doi:10.2147/IJN.S16142629719390
- Niu K, Yao Y, Xiu M, et al. Controlled drug delivery by polylactide stereocomplex micelle for cervical cancer chemotherapy. Front Pharmacol. 2018;9:930. doi:10.3389/fphar.2018.0093030154721
- Raucher D, Dragojevic S, Ryu J. Macromolecular drug carriers for targeted glioblastoma therapy: preclinical studies, challenges, and future perspectives. Front Oncol. 2018;8:624. doi:10.3389/fonc.2018.0062430619758
- Zhang B, Hu Y, Pang Z. Modulating the tumor microenvironment to enhance tumor nanomedicine delivery. Front Pharmacol. 2017;8:952. doi:10.3389/fphar.2017.0095229311946
- Liu L, Chen B, Qin S, et al. A novel histone deacetylase inhibitor chidamide induces apoptosis of human colon cancer cells. Biochem Bioph Res Co. 2010;392(2):190–195. doi:10.1016/j.bbrc.2010.01.011
- Lai TC, Kataoka K, Kwon GS. Bioreducible polyether-based pDNA ternary polyplexes: balancing particle stability and transfection efficiency. Colloids Surf B. 2012;99:27–37. doi:10.1016/j.colsurfb.2011.09.026
- Ke Z, Yang L, Wu H, et al. Evaluation of in vitro and in vivo antitumor effects of gambogic acid-loaded layer-by-layer self-assembled micelles. Int J Pharmaceut. 2018;545(1–2):306–317. doi:10.1016/j.ijpharm.2018.04.016
- Ning Z, Li Z, Newman MJ, et al. Chidamide (CS055/HBI-8000): a new histone deacetylase inhibitor of the benzamide class with antitumor activity and the ability to enhance immune cell-mediated tumor cell cytotoxicity. Cancer Chemoth Pharm. 2012;69(4):901–909. doi:10.1007/s00280-011-1766-x
- Cai X, Liu B, Pang M, et al. Interfacially synthesized Fe-soc-MOF nanoparticles combined with ICG for photothermal/photodynamic therapy. Dalton Trans. 2018;47:16329–16365. doi:10.1039/c8dt02941e30403239
- Deng Y, Jia F, Chen S, et al. Nitric oxide as an all-rounder for enhanced photodynamic therapy: hypoxia relief, glutathione depletion and reactive nitrogen species generation. Biomaterials. 2018;187:55–65. doi:10.1016/j.biomaterials.2018.09.04330292942
- Wei Y, Wei Z, Luo P, et al. pH-sensitive metal-phenolic network capsules for targeted photodynamic therapy against cancer cells. Artif Cells Nanomed Biotechnol. 2018;46:1552–1558. doi:10.1080/21691401.2017.137772428918670
- Xu L, Zhang X, Cheng W, et al. Hypericin-photodynamic therapy inhibits the growth of adult T-cell leukemia cells through induction of apoptosis and suppression of viral transcription. Retrovirology. 2019;16:5–27. doi:10.1186/s12977-019-0467-030782173
- Vantieghem A, Xu Y, Assefa Z, et al. Phosphorylation of Bcl-2 in G2/M phase-arrested cells following photodynamic therapy with hypericin involves a CDK1-mediated signal and delays the onset of apoptosis. J Biol Chem. 2002;277:37718–37731. doi:10.1074/jbc.M20434820012101183
- Eva Bernhart NS, Kaltenegger H, Windpassinger C, et al. Histone deacetylase inhibitors vorinostat and panobinostatinduce G1 cell cycle arrest and apoptosis in multidrug resistantsarcoma cell lines. Oncotarget. 2017;8(44):77254–77267. doi:10.18632/oncotarget.2046029100385
- Qian H. Antitumor activity of Chidamide in hepatocellular carcinoma cell lines. Mol Med Rep. 2012;5:1503–1508. doi:10.3892/mmr.2012.85822484326