
Abstract
Background
Reactive oxygen species (ROS), such as hydrogen peroxide and superoxide, trigger biodegradation of polymer-based nanoparticles (NPs) bearing pinacol-type boronic ester groups. These NPs may selectively release their cargo, in this case paclitaxel (PTX), at the high levels of ROS present in the intracellular environment of inflamed tissues and most tumors.
Purpose
The main objective was to determine anti-tumor efficacy of PTX-loaded ROS-sensitive NPs and to examine whether macrophage infiltration had any impact on treatment efficacy.
Methods
NPs were synthesized and their characteristics in the presence of H2O2 were demonstrated. Both confocal microscopy as well as flow cytometry approaches were used to determine degradation of ROS-sensitive NPs. HeLa cells were cultured in vitro and used to establish tumor xenografts in nude mice. In vivo experiments were performed to understand toxicity, biodistribution and anti-tumor efficacy of the NPs. Moreover, we performed immunohistochemistry on tumor sections to study infiltration of M1 and M2 subsets of macrophages.
Results
We demonstrated that PTX delivered in NPs containing a ROS-sensitive polymer exhibits a better anti-tumor efficacy than PTX in NPs containing ROS-non-sensitive polymer, free PTX or Abraxane® (nab-PTX). The biodistribution revealed that ROS-sensitive NPs exhibit retention in liver, spleen and lungs, suggesting a potential to target cancer metastasizing to these organs. Finally, we demonstrated a correlation between infiltrated macrophage subsets and treatment efficacy, possibly contributing to the efficient anti-tumor effects.
Conclusion
Treatment with ROS-sensitive NPs containing PTX gave an improved therapeutic effect in HeLa xenografts than their counterpart, free PTX or nab-PTX. Our data revealed a correlation between macrophage infiltration and efficiency of the different antitumor treatments, as the most effective NPs resulted in the highest infiltration of the anti-tumorigenic M1 macrophages.
Introduction
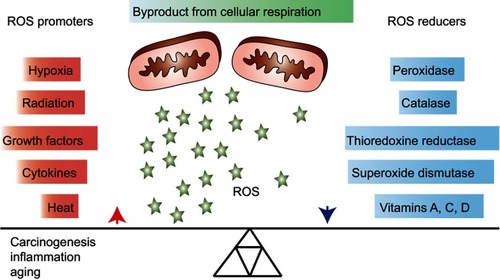
Reactive oxygen species (ROS) are necessary for growth and development of living organismsCitation1 and involved in biological processes, such as antimicrobial defense and radiation damage.Citation2 ROS are considered as being mainly formed as by-products of mitochondrial respiration. Cells can protect themselves against ROS damage by the use of specific ROS-reducing machineries that can either be non-enzymatic (eg, glutathione, α-tocopherol and ascorbate) or enzymatic (catalase, superoxide dismutase, peroxidases and reductases).Citation3 Consequently, progressive reduction in such intracellular ROS scavenging leads to increased intracellular oxidative stress ().Citation4
Figure 1 Overview of general promoters and reducers of reactive oxygen species (ROS). ROS are products of cellular respiration and their formation can contribute to oxidative stress and conditions, such as carcinogenesis, inflammation and aging. Upon elevated levels of ROS, cells may protect themselves by activating ROS reducing enzymatic or non-enzymatic mechanisms. Some factors that contribute to increasing or decreasing the ROS level are listed in the figure.
Increased levels of ROS in cells initiate several forms of reversible or irreversible oxidative modifications of DNA, lipids and proteins, which may cause a loss of molecular functions.Citation5 ROS play an important role in an extensive range of conditions, eg, chronic inflammation, aging, diabetes, cardiovascular diseases and obesity.Citation6–Citation10 ROS have also been shown to be involved in various cancer types, for instance, breast, cervical, ovarian, pancreatic, lung, liver, lymphoma and brain,Citation11–Citation18 either by introducing gene mutations, decreasing apoptosis or increasing cell proliferation and thereby adding further DNA alterations.Citation19
Advanced drug delivery systems aim at delivering larger amounts of a therapeutic agent in the tumor while limiting its systemic exposure, thus reducing systemic toxicity and improving the selectivity of the treatment.Citation20,Citation21 Nanoparticles (NPs) containing encapsulated drugs and allowing slow release of the drug in the tumor vicinity have been developed to reach this goal.Citation22,Citation23 The NPs may have incorporated motives that are sensitive to external stimuli, thereby inducing degradation and drug release. Such external stimuli could be a change in pH, enzymatic removal of protecting groups, light or the presence of ROS.Citation24 Pinacol-type boronic ester groups are the most sensitive and selective probes reported to detect H2O2 at physiological concentrations.Citation25,Citation26 Based on this, novel biocompatible and biodegradable ROS-sensitive polymers containing boronic ester groups have been developed; these substances self-degrade in ROS-rich areas and thereby release their drug cargo.Citation27–Citation29
Although it is difficult to quantify the exact ROS concentration in various tissues including tumor, it is widely accepted that highly proliferative cancer cells produce elevated amounts of ROS compared to healthy cells.Citation30 The overall effects of ROS on tumors range from tumor-promoting to tumor-destroying effects, which means that excess ROS production is potentially dangerous for both the tumor and the host.Citation31 Previously, we demonstrated in vitro degradation of paclitaxel (PTX)-loaded ROS-sensitive NPs in the presence of H2O2, and enhanced toxicity in various cancer cell lines was achieved when compared to the ROS-non-sensitive counterpart.Citation29
The present study was undertaken to investigate the toxicity, biodistribution and treatment efficacy of PTX-loaded ROS-sensitive NPs, in vivo. The toxicity of the NPs and free PTX was tested on healthy mice. Treatment efficacy was investigated utilizing subcutaneously growing HeLa xenografts, while treatment-induced leukocyte infiltration, focusing on tumor-associated macrophages (TAM) and natural killer (NK) cells, was assessed by immunohistochemistry. The NPs were well tolerated and the ROS-sensitive NPs showed improved anti-tumor efficacy compared to free PTX and to Abraxane® (nab-PTX), a commercially available albumin-bound PTX formulation. Increased pro-inflammatory/anti-tumorigenicM1 macrophage infiltration and reduced anti-inflammatory/pro-tumorigenic M2 macrophage infiltration were observed in the tumors treated with the ROS-sensitive NPs compared to all other treatments, suggesting that the innate immune system contributes to the enhanced therapeutic effect.
Materials and methods
Reagents
Abraxane® (nab-PTX- NPs containing albumin-bound PTX) was purchased from Celgene (Uxbridge, UK) and PTX was purchased from Mylan (Saint-Priest, France) for treatment efficacy study using free PTX. Triethylamine (≥99.5%), copper (I) iodide (99.999%), Nile Red (NR) for microscopy, BSA and bovine liver catalase were all obtained from Sigma-Aldrich (Prague, Czech Republic) and were used without further purification. AlexaFluor® 647 was purchased from Life Technologies (Carlsbad, CA, USA). For NP encapsulation, PTX was purchased from Aurisco (Yangzhou, People’s Republic of China). Polymethylmethacrylate (PMMA) standards were purchased from Polymer Source (Canada). All solvents, unless otherwise stated, were used without further purification.
Polymer synthesis and characterization
The ROS-sensitive polymer P1 and the ROS-non-sensitive counterpart polymer P2 were synthesized and fully characterized according to our previous work.Citation29
Synthesis of the polymers with conjugated alexafluor 647
The charged polymer P1 or P2 (40 mg, 0.05 mmol terminal alkyne groups), AlexaFluor 647 azide dye (0.5 mg, 0.59 µmol) and triethylamine (10 μL, 0.05 mmol) were added to a vial containing 2.5 mL anhydrous N,N-dimethylformamide (DMF; Sigma-Aldrich, Czech Republic) and equipped with a magnetic stirrer (used under argon atmosphere) copper (I) iodide (0.2 mg, 1 µmol) was added, followed by stirring at room temperature for 5 mins, and thereafter stirred vigorously for 6 hrs at 40°C. After cooling of the reaction mixture, the copper catalyst was removed by filtering and finally dialyzed for 48 hrs in the dark. The P1 and P2 polymer-AlexaFluor 647 conjugates were recovered by lyophilization as light blue solids ().
NP preparation
Solutions of P1 or P2 in acetone (5 mL, 10 mg·mL−1), were added 250 μg·mL−1 of PTX and PBS (10.0 mL, containing 0.01% (v/v) Tween 80). The NPs were then formed following aggregation of the polymers due to the increased solvent polarity. Following removal of acetone by evaporation, solutions were concentrated to a final volume of 2.5 mL. Finally, the NPs were washed twice with PBS by using Amicon 10 kDa filters (MilliPore, Czech Republic), and the PTX concentration was measured using HPLC as described earlierCitation29 and adjusted to 15 mg⋅mL−1.
The NR-loaded P1 and P2 NPs were prepared as follows: 5 mL solutions containing 20 mg P1 or P2 and 50 µg NR in acetone, PBS (containing 0.01% (v/v) Tween 80) were added (10 mL) as a precipitant. Acetone was then removed by evaporation and the volume was adjusted to give a concentration of the NPs of 5 mg⋅mL−1. The NPs were washed twice with PBS by using Amicon 10 kDa filters (MilliPore). The final preparations were adjusted such that they contained 8.0 µg⋅mL−1 of NR in PBS with 0.2% (w/v) of the polymers.Citation29
NP characterization
Dynamic light scattering measurements were performed by using the Zetasizer NanoZS, Model ZEN3600 (Malvern Instruments, Malvern, UK). The Zetasizer was equipped with a 633 nm He-Ne laser and it was operating at an angle of 173°. The Dispersion Technology Software version 6.01 from Malvern was used to collect and analyze the data. One mL of the NPs was measured in disposable polystyrene half-micro cuvettes of 10 mm at 25°C or 37°C. The measurements were performed at a position of 4.65 mm from the cuvette wall (using an automatic attenuator). Each measurement of the NP dispersion lasted for 45 s and was repeated ten times. The instrument software was used to calculate the average hydrodynamic diameter DH and the width of the distribution denoted as the polydispersity index PDI. Additionally, the zeta-potential, describing the surface charge of the NPs, is obtained from the measured data.
Size exclusion chromatography (SEC) of the polymer NPs
SEC analysis was used to estimate the weight-average molecular weight (Mw), number-average molecular weight (Mn) and the respective polydispersity I = (Mw/Mn).Citation29 These analyses were performed at 25°C. The columns used were two PLgel MIXED-C columns (300×7.5 mm, styrene-divinylbenzene copolymer (SDV) gel with particle size 5 μm. The linear Mw operation range for this system is in the range of 0.200–200 kDa (Polymer Laboratories, USA). UV detection was performed using UVD 305 (Watrex, Czech Republic) and RI detection was performed using RI-101 (Shodex, Japan). The mobile phase (DMF containing LiBr [0.01% v/v]) was used at a flow rate of 1 mL⋅min−1. Clarity software (DataApex, Czech Republic) was used to calculate the molecular weight values, and calibration was performed with PMMA standards (Polymer Source). The MWs of P1 and P2 were determined to be 21.5 kDa (I =49) and 21.9 kDa (I =1.64), respectively.Citation29
SEC analysis of polymer degradation
Solutions of P1 and P2 NPs were made prepared by adding 6 mg of the polymers to 1.6 mL of DMF-PBS (pH 7.4, 80/20 v/v). H2O2 (30% w/w solution in H2O) was added to obtain solutions containing 500 µM, 1 mM and 5 mM H2O2, respectively. After incubations for 1 or 3 days, aliquots of 250 µL were evaporated to dryness, and 350 µL DMF (containing 0.01% (w/v) LiBr) was added. The solutions were filtered 0.22 µM PVDF (Millipore) and 20 µL were injected for SEC analysis.
Cell culture
HeLa (cervical cancer cell line) cells, purchased from American Type Culture Collection (ATCC), were cultured in RPMI medium with 10% (v/v) fetal bovine serum (Sigma-Aldrich) and 1%(v/v) GlutaMax (Life Technologies, CA, USA). PC-3cells (a hormone-independent prostate carcinoma cell line) were purchased from ATCC and cultured in F12 medium with 10% (v/v) fetal bovine serum, 100 µg/mL streptomycin and 100U penicillin (Life Technology, Czech Republic). Cells were incubated in a humidified incubator at 37°C with 5% (v/v) CO2. The cell culture was split twice a week and regularly tested for mycoplasma contamination and cell identity. The latter was verified using the Powerplex 16 kit (Promega, Madison, WI, USA) based on analyses of genomic DNA. The HeLa cells were detached using cold 0.02% (w/v) EDTA (Sigma-Aldrich), washed and re-suspended in PBS before injection in mice.
Confocal laser scanning microscopy
High ROS-producing PC-3 cellsCitation28 were seeded in 8-well µ-slides (Ibidi GmbH, Germany) at a density of 2.104 cells per well. Cells were left to attach overnight, before addition of NR-loaded P1 or P2NPs (200 µg.mL−1) for 2 hrs for internalization of the NPs into the cells. After removal of the non-internalized NPs, the cells were further incubated for 4 and 20 hrs before the cells were washed and kept in PBS containing 0.5% (w/v) bovine serum albumin. The nuclei were stained with 1 µg.mL−1 of Hoechst 34,580 (all Life Technologies, Czech Republic) prior to imaging. Images were acquired at an Olympus FV 10-ASV confocal laser scanning microscope with a 60X oil objective, using the software FluoView FV1000. Transmission and Hoechst fluorescence (channel CH1, excitation 405 nm, emission 425–475 nm) were detected. The NR fluorescence was imaged in channels CH2 (excitation 543 nm, emission 555–625 nm) and CH3 (excitation 635 nm, emission 655–755 nm).
Flow cytometry
For particle chase experiments, PC-3 cells were seeded as given above, then the cells were chased with NR-loaded P1 or P2 NPs (200 µg.mL−1 for 2 h). Then, NR fluorescence in the cells was measured immediately (0 hr post-chase) or after 4 hrs additional incubation in NP-free medium (4 hrs post-chase). The cells were trypsinized and washed with PBS containing 0.5% (w/v) BSA and proceeded for flow cytometry analysis.
For the catalase experiments, the PC-3 cells were seeded at a density of 5.104 cells per well and left to attach overnight. Afterward, cells were incubated with 2000 U⋅mL−1 of catalase for 16 hrs before addition of P1 and P2 NR-loaded NPs (200 μg⋅mL−1). The NPs were incubated with the cells for further 6.5 hrs before proceeded for flow cytometry analysis. NR-loaded P1 and P2 NPs (200 μg⋅mL−1) were also incubated with cells without addition of catalase and were used as controls.
Measurements and data analyses were done with a FACSverse flow cytometer (BD Biosciences, USA) using the FlowJo V10 (FlowJo, USA) and OriginLab software (OriginLab Corporation, USA). Single cells were selected in plots of forward scatter area (FSC-A) vs sideward scatter area (SSC-A) (for exclusion of debris) and FSC-A vs FSC height (for duplet discrimination).
The green part of the fluorescence of particle-incorporated NR (FL1, excitation 488 nm, emission BP527/32, ie, bandpass filter at 527±16 nm) and the red-shifted quenched fluorescence of NR released from degraded particles (FL5, excitation 640 nm, emission BP660/10, ie, bandpass filter at 660±5 nm) were captured. The ratio of the two fluorescence intensities (‘FL5/FL1ʹ) was a measure for the release of NR, ie, to estimate NP degradation.
Experimental animals
Female athymic nude foxn1nu mice were bred at the Comparative Medicine Department, Oslo University Hospital, and kept in a specific pathogen-free environment at a constant temperature (21.5±0.5°C) and humidity (55±5%); 15 air changes/h and a 12-hr light/dark cycle. The animals were 5–6 weeks old and their weight was 18–20 g before they were included in the experiments. Anesthesia was obtained with 5% (v/v) Sevofluran along with 1 L oxygen and 3 L nitrous oxide, given with inhalation mask. Mice were given cardboard houses and paper to play with. All the experiments were approved by the National Animal Research Authority, after first having been approved by the institutional veterinarian. Housing and all procedures involving animals were performed according to protocols approved by the National Animal Research Authority, and conducted according to the regulations of the Federation of European Laboratory Animals Science Association.Citation32 Food and water were supplied ad libitum. Animals were sacrificed performing cervical dislocation at the end of the experiments, or when tumor volume reached 1500 mm3, the weight loss exceeded 20% or when they became moribund.
Toxicity studies
Toxicity of the PTX-loaded P1 and P2 NPs or nab-PTX was examined by injecting different doses (10, 20, 40 or 60 mg/kg body weight) in disease-free female athymic nude foxn1nu mice. The animals were monitored daily the first week and thereafter twice per week for weight loss or any sign of toxicity. Weight loss should not exceed 20%. There were six animals per treatment group.
In vivo imaging
P1 or P2 NPs conjugated with the fluorescent dye AlexaFluor 647 were used to study biodistribution in healthy mice using an in vivo imaging system IVIS® Spectrum (Perkin Elmer, MA, USA). Mice were injected intravenously with NPs containing 270 µg AlexaFluor 647conjugated with 11.3 mg NPs in 250 µL. The mice were given the abovementioned gas anesthesia using multiple masks. The excitation/emission wavelength pair of 640/680 nm was used for imaging of the NPs. Full body images were obtained 1, 4 and 24 hrs after injection; the animals then were sacrificed and organs were harvested. Ex vivo imaging of the organs was also performed with the IVIS® Spectrum using the same settings as above. Relative signal intensity in the organs, such as liver, lungs and spleen was calculated, using Living Image software (Perkin Elmer), as radiant efficiency (Emission light [photons/sec/cm2/str]/Excitation light [μW/cm2]×109) per pixel of the region of interest, which was marked around the corresponding organs. Organs from only one animal from different treatment at each time point were imaged.
Treatment efficacy
The anti-tumor treatment efficacy was investigated in HeLa tumor-bearing mice, for which, 2.5 million HeLa cells were injected subcutaneously on each flank of mice to develop bilateral tumors. After the tumors reached approximately 5 mm in diameter, the mice were randomly allocated to the following treatment groups: P1 NPs, P2 NPs, nab-PTX, PTX and saline.
Free PTX solution was made right before the injection by dilution of the working solution with 0.9% (w/v) NaCl. All treatments were given as intravenous injections and the mice were monitored daily. The tumor was measured by caliper and the tumor volume was calculated according to the formula 0.5×length×width2 and related to the mean tumor volume at the day when the treatment started. Mice were sacrificed by cervical dislocation if tumor reached 1500 mm3 or when they became moribund.
Immunohistochemistry
Tumors from HeLa-bearing mice were collected 30 days after treatment, formalin-fixed and paraffin-embedded (FFPE). FFPE tumors were sliced to prepare 3 µm thick consecutive slides. The deparaffinization agent Neo-clear and the mounting agent Neo-mount were both obtained from VWR (Radnor, PA, USA). Heat-induced epitope retrieval was performed by placing deparaffinized slides in 10 mM sodium citrate buffer (pH 6.0) in a boiling water bath for 20 mins at 95–100°C. Endogenous peroxidase activity was blocked by incubating slides with 3% (v/v) hydrogen peroxide in tris-buffered saline (TBS; 50 mM Tris-Cl, 150 mM NaCl, pH 7.6). Sections were blocked for non-specific binding with 3% (w/v) bovine serum albumin (Roche Diagnostics GmbH, Mannheim, Germany) in TBS for 30–35 mins. Incubation with primary antibody was performed for 60 mins at room temperature. MACH 3 rabbit HRP-polymer detection kit (Biocare Medical, Concord, CA, USA) was used for detection of primary antibodies. Chromogen solution provided with the Betazoid DAB Chromogen kit (Betazoid DAB Chromogen kit; Biocare Medical) was used to develop signals. Hematoxylin and 37 mM ammonium hydroxide containing solutions (Sigma-Aldrich, St. Louis, MO, USA) were used for counter staining.
Three different primary antibodies, ie, anti-CD68 (1 mg/mL; ab125212, Abcam, Cambridge, UK), anti-CD206 (0.1 µg/mL; ab64693, Abcam, Cambridge, UK) and anti-iNOS (0.5 µg/mL; ab15323, Abcam, Cambridge, UK) were used to detect diverse macrophage populations. CD68 is generally used for detection of the whole macrophage population.Citation33,Citation34 To detect pro-inflammatory M1 macrophages, inducible nitric oxide synthase (iNOS) is used as a marker.Citation35 CD206 is considered as a marker for pro-tumorigenic M2 macrophages.Citation35 NK cells were detected using Anti-NCR1 (ab214468, Abcam). Negative controls were those tissues, which were stained without primary antibodies.
ImageJ analysis
Stained tissue sections were scanned (NanoZoomer HT, Hamamatsu Photonics, Hamamatsu, Japan) using a 40x objective. The digitalized slides were used to make small frames throughout the tissue section (five frames from each section) for better analysis and effective quantification of CD68, iNOS, CD206 or NCR1 expressing cells. These frames of tumor sections were transferred to ImageJ software (NIH, USA). Annotations in each frame were created to avoid blood vessels and necrotic parts of tumor, as they may give false positive or background signals. Black threshold was created to color all the brown stained spots into black. Then, binary images were created where only black spots were visible on white background for efficient quantification. The pixel numbers of black spots were calculated automatically and divided with total pixels in white background (illustrated an example in ). The obtained ratio was used as a semi-quantitative measurement of antigen expression in each stained section ().
Statistics
To calculate the significance in the efficacy studies, the area under the curve (AUC) was calculated for each tumor and the AUC values were compared between groups using unpaired, two-sided t-test. Statistical analysis of flow cytometry data was performed using one-way ANOVA and Tukey’s multiple comparisons post-hoc test. For all other studies, an unpaired two-sided Student t-test was used. The statistical analyses were performed using either GraphPad Prism (version 7.00 for Windows, GraphPad Software, La Jolla, California, USA) or Microsoft Excel 2010.
Results
In vitro polymer NPs degradation
The size distributions of the different polymers used in different studies are shown in ) and the values for DH, PDI and zeta-potential for all preparations are listed in . TEM micrographs of these particles have been published previously.Citation29
Figure 2 Size distribution of NPs and degradation of NPs in the presence of H2O2. The size distributions (hydrodynamic diameter, intensity weighted) for empty or AlexaFluor polymers conjugated P1 NPs (A), empty or AlexaFluor conjugated polymers P2 NPs (B) and PTX encapsulated P1 and P2 NPs (C) are shown. The average values of the hydrodynamic diameter (DH) and the polydispersity index (PDI) are also indicated. The SD values obtained (n=10) were smaller than the symbols used in the figure and therefore not visible. SEC chromatograms of P1 NPs (D) and P2 NPs (E) prior to the addition of H2O2 (black lines) and after degradation for 1 day (D) and 3 days (E) in 20% PBS/DMF solutions at 37°C containing 500 (red lines), 1 (green line) or 5 mM (blue lines) H2O2.
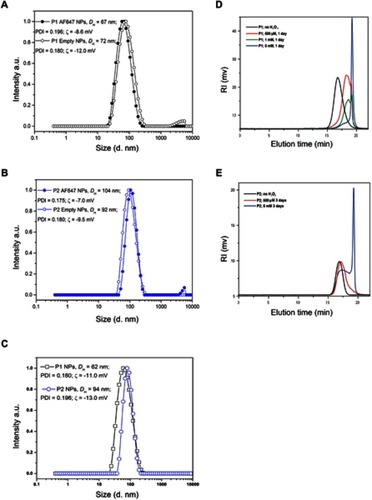
Table 1 The average values of hydrodynamic diameter (DH), polydispersity index (PDI) and zeta-potential (ζ) of empty, AlexaFluor 647 (AF647) conjugated, NR-loaded, and PTX encapsulated polymers P1 and P2 NPs are listed
In order to analyze the stability of the NPs in the presence of ROS, the particles were incubated in solutions containing different H2O2 concentrations and analyzed by SEC. The chromatograms depicted in ) reveal that the P1 NPs degraded to smaller molecules in an H2O2-dependent manner. The polymer degradation proceeded more extensively at higher H2O2 concentrations. P1 NPs were shown to be affected by physiologically relevant levels of H2O2 (500 μM) after 1 day (), while the non-ROS-sensitive counterpart P2 NPs showed almost no degradation after 3 days incubation with the same H2O2 concentration (). When degradation of the two NPs was compared at the highest H2O2 concentration tested (5 mM), the degradation of the P2 NPs was only partial after 3 days () whereas the P1 NPs were almost completely degraded after 24 hrs (). No degradation of the NPs was observed following incubation for 5 days in the absence of H2O2 (data not shown). Degradation of the NPs, assessed by 1H NMR at the same time intervals and conditions, has also been reported previously.Citation29
Degradation of the NPs was also assessed by flow cytometry using NPs containing the fluorescent dye NR. While NR is highly fluorescent when incorporated inside the NPs, ROS- dependent release of NR will result in reduced and overall red-shifted fluorescence (quenching and spectra shift due to polarity changes in the surrounding of the dye). Thus, the release of NR can be tracked both by quenching of the overall fluorescence intensity and by increase of the red-shifted component of the dye’s fluorescence. depicts the NR quenching (shift in the light vs dark curves) in PC-3 cells loaded with P1 NPs (, top), while almost no quenching is observed in cells loaded with the P2 NPs (, bottom). The NR fluorescence in cells loaded with P1 NPs is decreased by ~62% during 4 hrs, whereas only ~33% of the NR fluorescence is decreased after loading with P2 NPs ().
Figure 3 Flow cytometry and confocal microscopy images. Histograms show NR total fluorescence after 0 hr post-chasing (light blue/light green) and NR quenching in PC-3 cells 4 hrs post-chasing (dark blue/dark green) with P1 NPs (A; top panel) and P2 NPs (A; bottom panel). Grey curves indicate cells without fluorescence. Mean total NR fluorescence in PC-3 cells after 2 hrs chase with NR-loaded NPs 0 and 4 hrs post-chase (B). Confocal images of PC-3 cells after incubation with NR-loaded P1 NPs (left panel) and P2 NPs (right panel) for 4 (C, D) or 20 hrs (E, F) post-chasing. Error bars show SD. Asterisk indicates statistical significance obtained by one-way ANOVA and Tukey’s multiple comparisons post-hoc test. *P<0.05 (n=3).
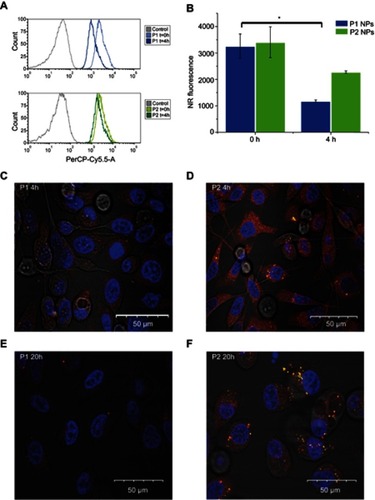
Confocal images show that at 4 hrs post-chasing,P1 NPs () display lower fluorescence intensity in the cells as compared to P2 NPs (), whereas after 20 hrs, the fluorescence of P1 NPs () is totally vanished compared to P2 NPs (). Furthermore, the NR release from the P1 and P2 NPs in PC-3 cells was also evaluated in the presence of catalase (a ROS scavenger, which degrades H2O2) (). In the absence of catalase, the NR was released to a high extent in cells loaded with the degradable P1 NPs, while the presence of catalase prevented particle degradation and strongly reduced the NR release (), demonstrating the specificity of the P1 NPs to release the drug in the presence of H2O2. In the case of P2 NPs, the NR release remained unchanged and low, disregarded the presence of catalase ().
Toxicity studies using P1 and P2 NPs
Toxicity experiments on healthy mice were performed to determine non-toxic dose of the different substances that could be injected for further studies. The weights of mice were regularly monitored to observe substance toxicity, and a given dose was considered toxic and mice would be sacrificed if weight reduction exceeded 20% compared to their initial respective weights. Our study showed that healthy mice could be administered a dose of 60 mg/kg PTX incorporated in both P1 and P2 NPs, as well as 60 mg/kg nab-PTX without giving any sign of toxicity (). This is in contrast to free PTX, where maximum tolerated dose had been reported to be 30 mg/kg body weight.Citation36
PTX-loaded P1 NPs exhibit significant anti-tumor efficacy
To determine anti-tumor efficacy in HeLa xenografts, tumor-bearing animals were treated with PTX containing P1 NPs (PTX 60 mg/kg), PTX containing P2 NPs (PTX 60 mg/kg), free PTX (15 mg/kg, two times with six days between the injections), nab-PTX (60 mg/kg) and PBS as control. Compared to control mice, anti-tumor efficacy was observed after treatment with P1 and P2 NPs, as well as after treatment with nab-PTX and free PTX (). The P2 treatment group had to be discontinued 18 days posttreatment due to some large tumors. Although nab-PTX (60 mg/kg) treatment displayed improved tumor inhibition compared to control and P2 NPs, the efficacy was not better than free PTX. Notably, the highest anti-tumor efficacy was achieved with the ROS-sensitive P1 NPs. When comparing all treatment groups, the P1 NPs demonstrated significantly improved growth retardation compared to P2 NPs and nab-PTX, but did not reach statistical significance in comparison with free PTX at day 18 (when the P2 group had to be discontinued). However, AUC calculations at the end of the experiment () demonstrated significant improved treatment efficacy by P1 NPs also when compared to free PTX (), P=0.017 (P1 NPs – PTX), P=0.001 (P1NPs – nab-PTX); unpaired, two-sided t-test. Also, total remission was obtained in 5 of 11 tumors treated with P1 NPs, 1 of 10 tumors treated with nab-PTX and 2 of 10 tumors treated with PTX.
Figure 4 Treatment efficacy in mice bearing HeLa tumors. (A) The effect of the different treatments on HeLa tumors in mice was studied for 30 days. PTX containing P1 NPs, P2 NPs or nab-PTX were injected with 60 mg/kg PTX. Free PTX was injected twice (day 1 and 7); 15 mg/kg in each injection. The blue arrows indicate PTX injections. PBS was used as a control. Data are shown as mean±SEM (P1NPs: n=11; P2 NPs, nab-PTX and PTX: n=10). Statistical significance between the treatment groups was calculated using AUC of individual tumors. Error bars show SEM. Asterisks indicate statistical significance obtained by two-tailed unpaired t-test. *P<0.05, **P<0.005. (B) Relative tumor volume at day 18 after the treatment plotted before two treatment groups were discontinued due to very large tumors. Statistical significance was determined using two-tailed unpaired t-test. Error bars show SEM. Asterisks indicate level of significance of each data set (n=12 [PBS], n=11 [P1], n=10 [P2, nab-PTX, PTX]). *P<0.05, **P<0.005, ****P<0.0001.
![Figure 4 Treatment efficacy in mice bearing HeLa tumors. (A) The effect of the different treatments on HeLa tumors in mice was studied for 30 days. PTX containing P1 NPs, P2 NPs or nab-PTX were injected with 60 mg/kg PTX. Free PTX was injected twice (day 1 and 7); 15 mg/kg in each injection. The blue arrows indicate PTX injections. PBS was used as a control. Data are shown as mean±SEM (P1NPs: n=11; P2 NPs, nab-PTX and PTX: n=10). Statistical significance between the treatment groups was calculated using AUC of individual tumors. Error bars show SEM. Asterisks indicate statistical significance obtained by two-tailed unpaired t-test. *P<0.05, **P<0.005. (B) Relative tumor volume at day 18 after the treatment plotted before two treatment groups were discontinued due to very large tumors. Statistical significance was determined using two-tailed unpaired t-test. Error bars show SEM. Asterisks indicate level of significance of each data set (n=12 [PBS], n=11 [P1], n=10 [P2, nab-PTX, PTX]). *P<0.05, **P<0.005, ****P<0.0001.](/cms/asset/f694f4a1-3711-4288-a40f-925c9d3b4c51/dijn_a_12190981_f0004_c.jpg)
Tissue localization of NPs
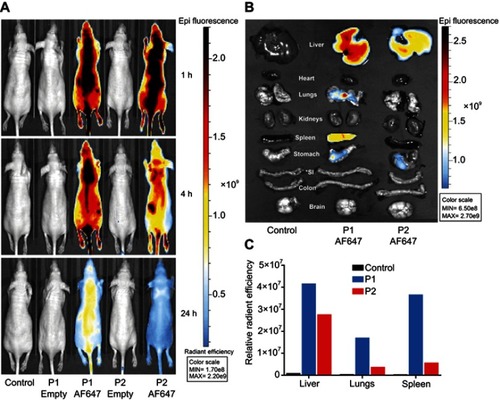
The biodistribution of the P1 or P2 NPs in healthy mice was studied by fluorescence imaging up to 24 hrs after injection of the NPs containing the fluorescent dye AlexaFluor 647. The images of mice were captured using the IVIS Spectrum scanner after 1, 4 and 24 hrs (), and demonstrate that the fluorescence signals decrease faster for P2 NPs than for P1 NPs. The mice were sacrificed to harvest organs for ex vivo visualization. The images of all organs harvested 24 hrs after injections are shown in and demonstrate stronger signals in liver, lungs and spleen after injection of P1 NPs than for P2 NPs. The mean radiant efficiency relative to the pixel size of the region of interest per organ is plotted ().
Figure 5 Biodistribution of P1 or P2 in healthy mice. In vivo fluorescence imaging of healthy mice at 1, 4 and 24 hrs after i.v. administration of unconjugated or AlexaFluor 647 (AF647) conjugated P1 or P2 NPs (A). Ex vivo fluorescence images of isolated organs, 24 hrs after injection (B). The columns demonstrate total radiant efficiency per pixel of region of interest of liver, lungs and spleen after 24 hrs (C). *SI=small intestine.
M1 macrophages are abundant in treated tumors
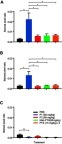
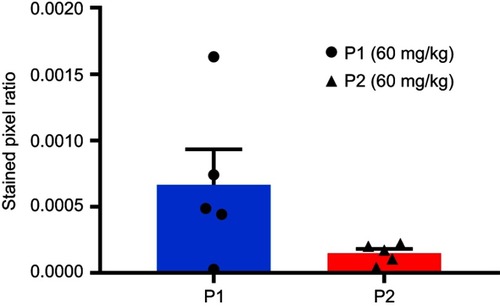
Immunohistochemistry was performed to detect different subsets of macrophages in treated or non-treated tumors. Image analysis and quantification were performed using the ImageJ software. Total population of infiltrating macrophages was quantified using an antibody against CD68. A significantly higher level of total macrophages was observed in tumors treated with the P1 NPs, compared to PBS (P=0.01), P2 (P=0.03), nab-PTX (P=0.04) or PTX (P=0.04) (). Also, the marker of pro-inflammatory/anti-tumorigenic M1 macrophages (iNOS) showed significantly higher macrophage infiltration into tumors of mice receiving P1 NPs compared to PBS (P=0.02), P2 (P=0.02), nab-PTX (P=0.03) or PTX (P=0.03) (). However, the CD206 positive cells, representing the anti-inflammatory/pro-tumorigenic M2 subset, demonstrated less infiltration after injection of P1 NPs than in tumors receiving PBS (P=0.006),and somewhat less, although not statistically significant, than P2 NPs (P=0.1) (). Selected photomicrographs of stained sections are presented for visualization (Figure S5A-E). Only a few NCR1 expressing NK cells were detected in the tumors and no significant difference (P=0.09) was observed between the groups treated with P1 NPs or P2 NPs ().
Figure 6 Expression of macrophage markers in untreated or treated HeLa tumor tissues. Macrophage infiltration was measured in HeLa tumors after treatment with PBS, P1 NPs, P2 NPs, nab-PTX or PTX. The total population of infiltrated macrophages was quantified using an antibody to CD68 (A). The population of pro-inflammatory (anti-tumorigenic) M1 macrophages was quantified using an antibody to iNOS (B). The population of anti-inflammatory (pro-tumorigenic) M2 macrophages was quantified with an antibody to CD206 (C). Data are shown as mean-stained pixel ratio±SEM (n=5 random regions in each tumor). Calculation of the stained pixel ratio is illustrated in . Asterisks indicate statistical significance obtained by two-tailed unpaired t-test. *P<0.05, **P<0.006.
Discussion
ROS are known to be elevated during inflammation and in tumors.Citation3,Citation37 Here, we used NPs designed to become degraded and release drug cargo, in this case PTX, in a ROS-enriched microenvironment.Citation29 We showed an effective degradation of ROS-sensitive P1 polymers in the presence of ROS using SEC analysis, confocal laser microscopy as well as flow cytometry with high ROS-producing PC-3 cells. Using HeLa xenografts in mice, we demonstrated superior anti-tumor efficiency of PTX embedded in ROS-sensitive NPs compared to PTX embedded in ROS-non-sensitive NPs, free PTX and nab-PTX, ie, a commercial product containing PTX bound to albumin. We did not observe any measurable toxicity following injection of PTX in the ROS-sensitive NPs.
Previously it has been established that biocompatible and biodegradable ROS-sensitive polymers containing boronic ester groups self-degrade in ROS-rich areas and thereby release their drug cargo.Citation29 Recently, superior activity of PTX-loaded pH-sensitive acetal-PEGylated NPs compared to free PTX has been demonstrated against HeLa cells in vitro.Citation38 Similarly, Lu et al showed a better antitumor efficacy of PEGylated PTX than free PTX.Citation39 In line with these findings, our data demonstrate less toxicity and better anti-tumor efficacy when PTX was incorporated into the ROS-sensitive NPs. There are at least two possible explanations for the improved therapeutic effect of treatment with P1 NPs compared to free PTX. Firstly, it was possible to deliver as high as 60 mg/kg PTX without demonstrating toxicity on healthy animals in formulation with P1 NPs, while the maximum tolerated dose of free PTX is only 30 mg/kg. Consequently, these NPs may deliver higher amounts of PTX in the tumor, limit the systemic exposure, and thus reduce toxicity and improve the selectivity of the treatment. However, the free PTX concentration in tumor was not quantified, hence we do not know if all PTX delivered by using NPs are available for their target inside tumors. Also, the better efficacy of the ROS-sensitive NPs compared to free PTX was observed many days after injection of these substances, and one may speculate if the better efficacy following injection of the NPs may be to ROS-triggered drug release over time.
The size of NPs is an important factor to achieve efficient tumor accumulation caused by the enhanced permeability and retention effect.Citation40 Our ROS-non-sensitive P2 NPs used in the mice studies have approx. 30 nm larger hydrodynamic diameter than the ROS-sensitive P1 NPs (). The biodistribution of these NPs obtained 24 hrs after intravenous injection in mice is shown in . It is not obvious why there seems to be more fluorescence accumulating in liver, spleen and lungs following injection of ROS-sensitive than ROS-non-sensitive NPs. A size difference between P1 and P2 NPs might contribute to different accumulation in these organs, but in this case, a higher accumulation of the larger P2 NPs could be expected. However, we have previously shown that incubations of P1 NPs with 1 mM H2O2 for 24 hrs at 37°C resulted in the appearance of both some very small, degraded particles (11 nm) and some very large aggregates (1.9 µm), whereas no changes were observed in the size distribution of P2 NPs at these conditions.Citation29 Thus, we speculate if the ROS-sensitive P1 NPs by passing tissue with elevated ROS levels may undergo swelling/aggregation and therefore get trapped. Interesting in this connection is that lungs are continuously exposed to oxygen and exogenous oxidants, such as dust particles or endogenous oxidants produced by macrophages, alveolar, bronchial and endothelial cells.Citation41 Also, spleen homes abundant amounts of ROS-producing myeloid-derived suppressor cells,Citation42 which might explain the profound number of ROS-sensitive P1 compared to P2 NPs in this organ.
Furthermore, the differences observed in the IVIS biodistribution data may also be due to different release rates of fluorophore from the two NPs such that the differences observed cannot be directly correlated to the amount of NPs in these tissues. We demonstrated in the present study a more rapid particle degradation and release from P1 than from P2 NPs during incubation in the presence of H2O2 (-E). In ROS-producing PC-3 cells, we observed approximately twice as much NR in P2 NPs as in P1 NPs after 4 hrs of incubation (). Furthermore, the NR release from P1 NPs was shown to be inhibited in the presence of ROS-scavenger agent (catalase), demonstrating the specificity of the P1 NPs to release the cargo in the presence of H2O2.
We have, as discussed above, shown that the ROS-sensitive NPs are activated in vitro. However, there are several challenges in comparing in vitro and in vivo ROS levels,Citation43,Citation44 and both artificially high levels of metabolic substrates and high partial pressures of oxygenCitation45 make it difficult to extrapolate in vitro results to the in vivo situation.Citation43,Citation46 Moreover, exact measurement of the ROS levels in intact organs and tumors are technically challenging due to their very short life span, high activity and extremely low concentration.Citation47 In any case, the data obtained clearly demonstrate that the P1 NPs are much more active than the P2 NPs in the subcutaneously growing tumors in vivo, resulting in a more pronounced therapeutic effect.
We also investigated the importance of the innate immune responses and related this to the observed treatment efficacy. Although NK cells are essential as a first line of defense against metastasis from circulating tumor cells, they are mostly not associated with the defense against tumor cells located in the tissues. Hence, the densities of NK cells found in tumors in most animal tumor models are low,Citation48 in accordance with the data in the present study. Contrary to NK cells, macrophages are the most abundant immune cells in the tumor microenvironment, and TAMs can be involved in both pro- and anti-tumorigenic processes. The TAM population is highly diverse with interchangeable phenotypes.Citation49 Macrophages have been subdivided into the classically activated pro-inflammatory M1 type, which exhibits anti-tumor immune response and the alternatively activated M2 type, which plays a more pro-tumorigenic role by secreting anti-inflammatory cytokines.Citation50,Citation51 Involvement of TAMs in tumor-related inflammation and induction of ROS also occurs through their production of cytokines, such as interferon-γ, interleukin-6 and tumor necrosis factor-α.Citation37,Citation52,Citation53 However, the functional role of TAMs varies between different forms of cancers, where they may contribute to either a favorable or poor prognosis.Citation54
Our immunohistochemistry results showed elevated expression of the M1 (anti-tumorigenic) specific marker in the tumors treated with P1 NPs, ie, in the tumors where the best therapeutic effect was observed. Treatment with ROS-sensitive NPs containing PTX displayed elevated CD68 and M1 macrophage-specific iNOS expression. This may suggest an ability of P1 NPs to induce anti-tumoral inflammation. Interestingly, tumor growth inhibition induced by docetaxel (another taxane) has been shown to partly depend upon expansion of M1 macrophages and depletion of M2 macrophages in models of breast cancer.Citation55 In contrast, enrichment of M1 macrophages was similarly observed after treatment of mice with cabazitaxel-loaded poly (2-ethylbutyl) cyanoacrylate NPs but not with free cabazitaxel.Citation56 Similarly, we did not observe any response in the macrophage populations upon treatment with free PTX, despite significant tumor inhibition compared to untreated controls.
Recently, PTX has been shown to reduce tumor growth by reprogramming TAMs to an M1 profile.Citation57 This might explain increased infiltration of M1 macrophages in PTX containing P1 treated tumors. Another interesting aspect of our finding is significantly decreased expression of pro-tumoral M2 macrophage marker CD206 upon P1 NPs treatment compared to control (P=0.006) group. This might point toward a possible role of M2 macrophages as a marker for poor prognosis concerning this treatment. Although only a small number (n=5) of immunohistochemical analyses were performed, the data point toward involvement of the innate immune system as a possible mechanism contributing to the enhanced treatment efficacy observed upon PTX delivery by ROS-sensitive NPs.
Conclusion
Injection of ROS-sensitive NPs containing PTX gave an improved therapeutic effect in HeLa xenografts in mice than injection of similar NPs containing a ROS-non-sensitive counterpart, free PTX or nab-PTX containing albumin-bound PTX. Our data revealed a correlation between macrophage infiltration and efficiency of the different anti-tumor treatments, as the most effective NPs resulted in the highest infiltration of the anti-tumorigenic M1 macrophages.
Abbreviation list
AUC, area under the curve; DLS, dynamic light scattering; DMF, N,N-dimethylformamide; EPR, enhanced permeability and retention; FFPE, formalin-fixed and paraffin-embedded; Inos, inducible nitric oxide synthase; i.v., intravenously; nab-PTX, Abraxane®; NK, natural killer; NPs, nanoparticles; PDI, polydispersity index; PTX, paclitaxel; SEM, standard error of the mean; TAMs, tumor-associated macrophages; TBS, tris-buffered saline.
Disclosure
Dr Martin Hrubý reports grants from Norwegian Grants, Ministry of Education, Youth and Sports of the Czech Republic, and Czech Science Foundation, during the conduct of the study. The authors report no other conflicts of interest in this work.
Acknowledgments
We thank Markus Fusser for his help with the biodistribution experiments. We are grateful to the Department of Comparative Medicine for animal maintenance and support. The two groups at the Institute for Cancer Research in Oslo were supported by the Research Council of Norway under the program NANO2021, project number 228200/O70 (Biodegradable nanoparticles in cancer diagnosis and therapy). E Jäger, A Jäger, V Sincari and M Hrubý acknowledge the Czech Science Foundation (grant #17-09998S). P Štěpánek acknowledges financial support from Norwegian Grants (grant # 7F14009) and from the Ministry of Education, Youth and Sports (grant #LM2015064 ERIC; grant POLYMAT # LO1507).
Supplementary materials
Figure S1 Structure of polymers. Polymers synthesized and utilized for the preparation of the PTX-loaded P1 NPs (A) and P2 NPs (B). (C) AlexaFluor 647 conjugated NPs (only showed for P1)
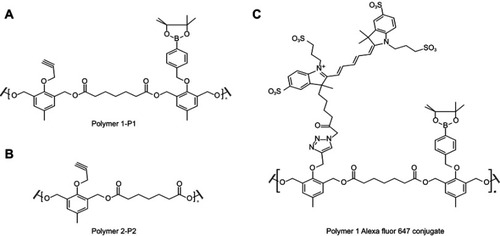
Figure S2 Calculation of myeloid cell infiltration in tumor tissue. The displayed photomicrograph slide was digitalized and randomly selected frames were imported to ImageJ software. Subsequently, black threshold was created over original frame and a binary mask was created to visualize black spots on white background (A). Quantification of shown example displays stained pixelated area, total pixelated area, pixel size and pixel count. The ratio of the stained area pixel to the total area pixel is called the stained pixel ratio and is shown on the y-axes in and (B)
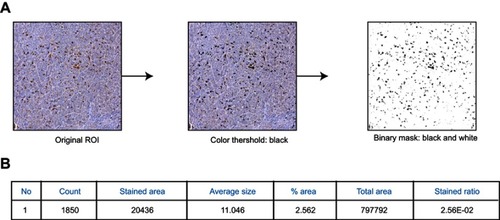
Figure S3 Flow cytometry and confocal microscopy images in the presence of catalase. NR fluorescence ratio of released NR (red channel – FL5) vs entrapped NR (green channel – FL1) from P1 NPs (blue) and P2 NPs (green) without catalase or after the 16-hr pretreatment with catalase (A). Confocal images of NR-loaded P1 NPs (B) and P2 NPs (C) in PC-3 cells after a 16hr pretreatment with catalase. Red shows the fluorescence from released and quenched NR and green shows the fluorescence from the particle-trapped, non-quenched NR; the blue color shows the Hoechst-stained nucleus. Error bars show SD. Asterisks indicate statistical significance obtained by one-way ANOVA and Tukey’s multiple comparisons post-hoc test. *P<0.05, **P<0.01 (n=3)
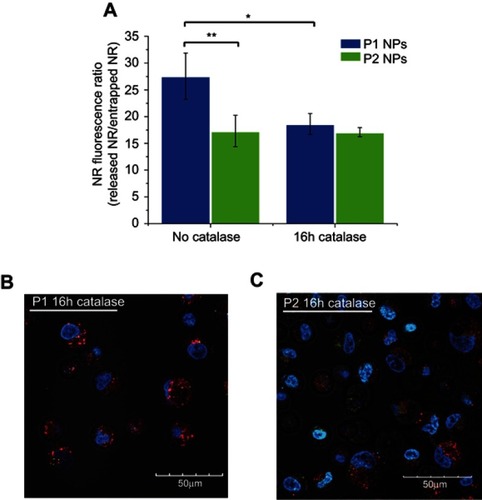
Figure S4 Toxicity of P1 NPs, P2 NPs and nab-PTX in healthy mice. Weight change (%) in healthy mice after treating with 40 or 60 mg/kg PTX containing P1 NPs, P2 NPs or nab-PTX. Error bars show SEM
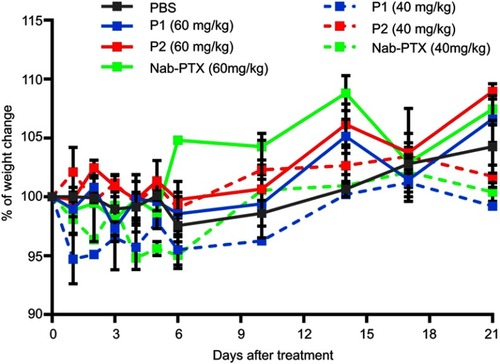
Figure S5 Photomicrographs of HeLa tissue samples labeled with CD68, iNOS or CD206. Photomicrographs of untreated tissue (A), and following treatment with P1 NPs (B), P2 NPs (C), nab-PTX (D) and PTX (E). Scale bar: 250 µm
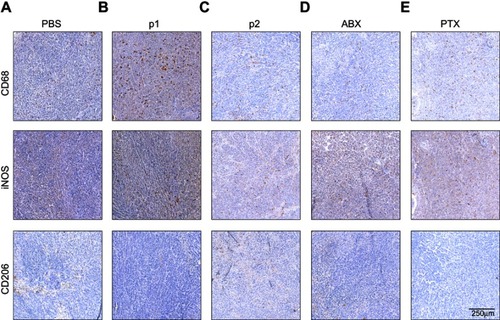
Figure S6 Expression of the NK cell marker NCR1 quantified in P1 NPs and P2 NPs treated tumors. Calculation of the stained pixel ratio was performed as illustrated in . Data are shown as mean-stained pixel ratio±SEM (n=5 random regions in each tumor). The difference was not statistically significant
References
- D’Autreaux B, Toledano MB. ROS as signalling molecules: mechanisms that generate specificity in ROS homeostasis. Nat Rev Mol Cell Bio. 2007;8(10):813–824. doi:10.1038/nrm225617848967
- Sies H, Stahl W, Sundquist AR. Antioxidant functions of vitamins - Vitamin-E and Vitamin-C, beta-carotene, and other carotenoids. Ann Ny Acad Sci. 1992;669:7–20. doi:10.1111/j.1749-6632.1992.tb17085.x1444060
- Sies H. Oxidative stress - from basic research to clinical-application. Am J Med. 1991;91:S31–S38. doi:10.1016/0002-9343(91)90281-2
- Minelli A, Bellezza I, Conte C, Culig Z. Oxidative stress-related aging: a role for prostate cancer? Biochim Biophys Acta. 2009;1795(2):83–91.19121370
- Giorgio M, Trinei M, Migliaccio E, Pelicci PG. Hydrogen peroxide: a metabolic by-product or a common mediator of ageing signals? Nat Rev Mol Cell Bio. 2007;8(9):722a–728a.17700625
- Di Virgilio F. New pathways for reactive oxygen species generation in inflammation and potential novel pharmacological targets. Curr Pharm Design. 2004;10(14):1647–1652. doi:10.2174/1381612043384727
- Dugan LL, Quick KL. Reactive oxygen species and aging: evolving questions. Sci Aging Knowledge Environ. 2005;2005(26):pe20. doi:10.1126/sageke.2005.26.pe2015994214
- Muhammad S, Bierhaus A, Schwaninger M. Reactive oxygen species in diabetes-induced vascular damage, stroke, and alzheimer’s disease. J Alzheimers Dis. 2009;16(4):775–785. doi:10.3233/JAD-2009-098219387112
- Touyz RM. Reactive oxygen species and angiotensin II signaling in vascular cells - implications in cardiovascular disease. Braz J Med Biol Res. 2004;37(8):1263–1273. doi:10.1590/S0100-879X200400080001815273829
- Furukawa S, Fujita T, Shimabukuro M, et al. Increased oxidative stress in obesity and its impact on metabolic syndrome. J Clin Invest. 2004;114(12):1752–1761. doi:10.1172/JCI2162515599400
- Johar R, Sharma R, Kaur A, Mukherjee TK. Role of reactive oxygen species in estrogen dependant breast cancer complication. Anti-Cancer Agent Me. 2016;16(2):190–199. doi:10.2174/1871520615666150518092315
- Sharma A, Rajappa M, Satyam A, Sharma M. Oxidant/anti-oxidant dynamics in patients with advanced cervical cancer: correlation with treatment response. Mol Cell Biochem. 2010;341(1–2):65–72. doi:10.1007/s11010-010-0437-220354762
- Chan DW, Liu VWS, Tsao GSW, et al. Loss of MKP3 mediated by oxidative stress enhances tumorigenicity and chemoresistance of ovarian cancer cells. Carcinogenesis. 2008;29(9):1742–1750. doi:10.1093/carcin/bgn16718632752
- Edderkaoui M, Hong P, Vaquero EC, et al. Extracellular matrix stimulates reactive oxygen species production and increases pancreatic cancer cell survival through 5-lipoxygenase and NADPH oxidase. Am J Physiol Gastrointest Liver Physiol. 2005;289(6):G1137–1147. doi:10.1152/ajpgi.00508.200416037546
- Azad N, Rojanasakul Y, Vallyathan V. Inflammation and lung cancer: roles of reactive oxygen/nitrogen species. J Toxicol Environ Health B Crit Rev. 2008;11(1):1–15. doi:10.1080/1093740070143646018176884
- Wang Z, Li Z, Ye Y, Xie L, Li W. Oxidative stress and liver cancer: etiology and therapeutic targets. Oxid Med Cell Longev. 2016;2016:7891574. doi:10.1155/2016/789157427957239
- Bur H, Haapasaari K-M, Turpeenniemi-Hujanen T, et al. Oxidative stress markers and mitochondrial antioxidant enzyme expression are increased in aggressive Hodgkin lymphomas. Histopathology. 2014;65(3):319–327. doi:10.1111/his.1238924698430
- Salganik RI, Albright CD, Rodgers J, et al. Dietary antioxidant depletion: enhancement of tumor apoptosis and inhibition of brain tumor growth in transgenic mice. Carcinogenesis. 2000;21(5):909–914. doi:10.1093/carcin/21.4.70110783311
- Klaunig JE, Xu Y, Isenberg JS, et al. The role of oxidative stress in chemical carcinogenesis. Environ Health Perspect. 1998;106(Suppl 1):289–295.9539021
- Petros RA, DeSimone JM. Strategies in the design of nanoparticles for therapeutic applications. Nat Rev Drug Discov. 2010;9(8):615–627. doi:10.1038/nrd259120616808
- Peer D, Karp JM, Hong S, Farokhzad OC, Margalit R, Langer R. Nanocarriers as an emerging platform for cancer therapy. Nat Nanotechnol. 2007;2(12):751–760. doi:10.1038/nnano.2007.38718654426
- Couvreur P. Nanoparticles in drug delivery: past, present and future. Adv Drug Deliv Rev. 2013;65(1):21–23. doi:10.1016/j.addr.2012.04.01022580334
- Skotland T, Iversen TG, Sandvig K. Development of nanoparticles for clinical use. Nanomedicine (Lond). 2014;9(9):1295–1299. doi:10.2217/nnm.14.8125204821
- Pu HL, Chiang WL, Maiti B, et al. Nanoparticles with dual responses to oxidative stress and reduced ph for drug release and anti-inflammatory applications. ACS Nano. 2014;8(2):1213–1221. doi:10.1021/nn405878724386907
- Dickinson BC, Chang CJ. A targetable fluorescent probe for imaging hydrogen peroxide in the mitochondria of living cells. J Am Chem Soc. 2008;130(30):9638–9639. doi:10.1021/ja802355u18605728
- Savina A, Peres A, Cebrian I, et al. The small GTPase Rac2 controls phagosomal alkalinization and antigen crosspresentation selectively in CD8(+) dendritic cells. Immunity. 2009;30(4):544–555. doi:10.1016/j.immuni.2009.01.01319328020
- de Gracia Lux C, Joshi-Barr S, Nguyen T, et al. Biocompatible polymeric nanoparticles degrade and release cargo in response to biologically relevant levels of hydrogen peroxide. J Am Chem Soc. 2012;134(38):15758–15764. doi:10.1021/ja303372u22946840
- Shim MS, Xia Y. A reactive oxygen species (ROS)-responsive polymer for safe, efficient, and targeted gene delivery in cancer cells. Angew Chem Int Ed Engl. 2013;52(27):6926–6929. doi:10.1002/anie.20120963323716349
- Jager E, Hocherl A, Janouskova O, et al. Fluorescent boronate-based polymer nanoparticles with reactive oxygen species (ROS)-triggered cargo release for drug-delivery applications. Nanoscale. 2016;8(13):6958–6963. doi:10.1039/C6NR00791K26961769
- Liou GY, Storz P. Reactive oxygen species in cancer. Free Radic Res. 2010;44(5):479–496. doi:10.3109/1071576100366755420370557
- Nathan C, Cunningham-Bussel A. Beyond oxidative stress: an immunologist’s guide to reactive oxygen species. Nat Rev Immunol. 2013;13(5):349–361. doi:10.1038/nri342323618831
- Guillen J. FELASA guidelines and recommendations. J Am Assoc Lab Anim Sci. 2012;51(3):311–321.22776188
- Knapp W, Dorken B, Rieber P, Schmidt RE, Stein H, von dem Borne AE. CD antigens 1989. Int J Cancer. 1989;44(1):190–191. doi:10.1002/ijc.29104401352744892
- Khazen W, M’Bika JP, Tomkiewicz C, et al. Expression of macrophage-selective markers in human and rodent adipocytes. FEBS Lett. 2005;579(25):5631–5634. doi:10.1016/j.febslet.2005.09.03216213494
- Komohara Y, Fujiwara Y, Ohnishi K, Takeya M. Tumor-associated macrophages: potential therapeutic targets for anti-cancer therapy. Adv Drug Deliv Rev. 2016;99(Pt B):180–185. doi:10.1016/j.addr.2015.11.00926621196
- Wang C, Wang Y, Wang Y, Fan M, Luo F, Qian Z. Characterization, pharmacokinetics and disposition of novel nanoscale preparations of paclitaxel. Int J Pharm. 2011;414(1–2):251–259. doi:10.1016/j.ijpharm.2011.05.01421596124
- Storz P. Reactive oxygen species in tumor progression. Front Biosci. 2005;10:1881–1896.15769673
- Huang D, Zhuang Y, Shen H, Yang F, Wang X, Wu D. Acetal-linked PEGylated paclitaxel prodrugs forming free-paclitaxel-loaded pH-responsive micelles with high drug loading capacity and improved drug delivery. Mater Sci Eng C Mater Biol Appl. 2018;82:60–68. doi:10.1016/j.msec.2017.08.06329025675
- Lu J, Chuan X, Zhang H, et al. Free paclitaxel loaded PEGylated-paclitaxel nanoparticles: preparation and comparison with other paclitaxel systems in vitro and in vivo. Int J Pharm. 2014;471(1–2):525–535. doi:10.1016/j.ijpharm.2014.05.03224858391
- Jager E, Giacomelli FC. Soft matter assemblies as nanomedicine platforms for cancer chemotherapy: a journey from market products towards novel approaches. Curr Top Med Chem. 2015;15(4):328–344. doi:10.2174/156802661566615013015230025633209
- Bargagli E, Olivieri C, Bennett D, Prasse A, Muller-Quernheim J, Rottoli P. Oxidative stress in the pathogenesis of diffuse lung diseases: a review. Respir Med. 2009;103(9):1245–1256. doi:10.1016/j.rmed.2009.04.01419464864
- Corzo CA, Cotter MJ, Cheng P, et al. Mechanism regulating reactive oxygen species in tumor-induced myeloid-derived suppressor cells. J Immunol. 2009;182(9):5693–5701. doi:10.4049/jimmunol.080277519380816
- Barja G. Mitochondrial oxygen consumption and reactive oxygen species production are independently modulated: implications for aging studies. Rejuvenation Res. 2007;10(2):215–224. doi:10.1089/rej.2006.051617523876
- Logan A, Shabalina IG, Prime TA, et al. In vivo levels of mitochondrial hydrogen peroxide increase with age in mtDNA mutator mice. Aging Cell. 2014;13(4):765–768. doi:10.1111/acel.1225524621297
- Beckman KB, Ames BN. The free radical theory of aging matures. Physiol Rev. 1998;78(2):547–581. doi:10.1152/physrev.1998.78.2.5479562038
- Brand MD. Uncoupling to survive? The role of mitochondrial inefficiency in ageing. Exp Gerontol. 2000;35(6–7):811–820. doi:10.1016/S0531-5565(00)00135-211053672
- Pavelescu LA. On reactive oxygen species measurement in living systems. J Med Life. 2015;8(Spec Issue):38–42.
- Larsen SK, Gao Y, Basse PH. NK cells in the tumor microenvironment. Crit Rev Oncog. 2014;19(1–2):91–105. doi:10.1615/CritRevOncog.v19.i1-224941376
- Qian BZ, Pollard JW. Macrophage diversity enhances tumor progression and metastasis. Cell. 2010;141(1):39–51. doi:10.1016/j.cell.2010.03.01420371344
- Mantovani A, Sica A, Locati M. Macrophage polarization comes of age. Immunity. 2005;23(4):344–346. doi:10.1016/j.immuni.2005.10.00116226499
- Komohara Y, Jinushi M, Takeya M. Clinical significance of macrophage heterogeneity in human malignant tumors. Cancer Sci. 2014;105(1):1–8. doi:10.1111/cas.1231424168081
- Brown ER, Charles KA, Hoare SA, et al. A clinical study assessing the tolerability and biological effects of infliximab, a TNF-alpha inhibitor, in patients with advanced cancer. Ann Oncol. 2008;19(7):1340–1346. doi:10.1093/annonc/mdn05418325912
- Grivennikov SI, Greten FR, Karin M. Immunity, inflammation, and cancer. Cell. 2010;140(6):883–899. doi:10.1016/j.cell.2010.01.02520303878
- Lewis CE, Pollard JW. Distinct role of macrophages in different tumor microenvironments. Cancer Res. 2006;66(2):605–612. doi:10.1158/0008-5472.CAN-05-400516423985
- Kodumudi KN, Woan K, Gilvary DL, Sahakian E, Wei S, Djeu JY. A novel chemoimmunomodulating property of docetaxel: suppression of myeloid-derived suppressor cells in tumor bearers. Clin Cancer Res. 2010;16(18):4583–4594. doi:10.1158/1078-0432.CCR-10-061320702612
- Fusser M, Overbye A, Pandya AD, et al. Cabazitaxel-loaded Poly(2-ethylbutyl cyanoacrylate) nanoparticles improve treatment efficacy in a patient derived breast cancer xenograft. J Control Release. 2018;293:183–192. doi:10.1016/j.jconrel.2018.11.02730529259
- Wanderley CW, Colon DF, Luiz JPM, et al. Paclitaxel reduces tumor growth by reprogramming tumor-associated macrophages to an M1- profile in a TLR4-dependent manner. Cancer Res. 2018. doi:10.1158/0008-5472.CAN-17-3480